Significance Tests Hypothesis Statement Regarding a Characteristic of


- Slides: 19

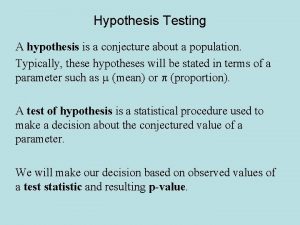
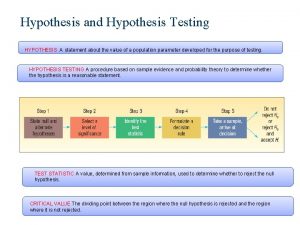
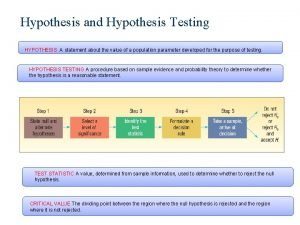
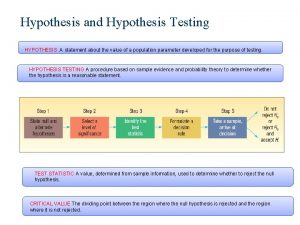
Significance Tests • Hypothesis - Statement Regarding a Characteristic of a Variable or set of variables. Corresponds to population(s) – Majority of registered voters favor health care reform – Average salary progressions differ for male executives whose spouses work than for those whose spouses “stay at home” • Significance Test - Means of using sample statistics (and their sampling distributions) to compare their observed values with hypothesized value of corresponding parameter(s)

Elements of Significance Test (I) • Assumptions – Data Type: Quantitative vs. Qualitative – Population Distribution: Some methods assume normal – Sampling Plan: Simple Random Sampling – Sample Size: Some methods have sample size requirements for validity • Hypotheses – Null Hypothesis (H 0): A statement that parameter(s) take on specific value(s) (Often: “No effect”) – Alternative Hypothesis (Ha): A statement contradicting the parameter value(s) in the null hypothesis

Elements of Significance Test (II) • Test Statistic: Quantity based on the sample data to test the null hypothesis. Typically is based on a sample statistic, parameter value under H 0 , and the standard error. • P-value (P): The probability that we would obtain a test statistic at least as contradictory to the null hypothesis as our computed test statistic, if the null hypothesis is true. – Small P-values mean the sample data are not consistent with the parameter value(s) under H 0

Elements of Significance Test (III) • Conclusion (Optional) – If the P-value is sufficiently small, we reject H 0 in favor of Ha. The most widely accepted minimum level is 0. 05, and the test is said to be significant at the. 05 level. – If the P-value is not sufficiently small, we fail to reject (but not necessarily accept) the null hypothesis. – Process is analogous to American judicial system • H 0: Defendant is innocent • Ha: Defendant is guilty

Significance Test for Mean (Large-Sample) • Assumptions: Random sample with n 30, quantitative variable • Null Hypothesis: H 0: m = m 0 (typically no effect or change from standard) • Alternative Hypothesis: Ha: m m 0 (2 -sided alternative includes both > and <) • Test Statistic: • P-value: P=2 P(Z |zobs|)

Example - Mercury Levels • Population: Patients visiting private internal medicine clinic in S. F. (High-end fish consumers) • Variable: Mercury levels (microg/L) • Sample: 66 Females • Recommended maximum level: 5. 0 microg/L • Null hypothesis: H 0: m = 5. 0 (Mean level=RML) • Alternative hypothesis: Ha: m 5. 0 (Mean RML) • Sample Data:

Example - Mercury Levels • Test Statistic: • P-Value: P=2 P(Z 5. 41) < 2 P(Z 5. 00) = 2(. 000000287)=. 000000574 0 • Conclusion: Very strong evidence that the population mean mercury level is above RML Source: Hightower and Moore (2003), “Mercury Levels in High-End Consumers of Fish, Environ Health Perspect, 111(4): A 233

Miscellaneous Comments • Effect of sample size on P-values: For a given observed sample mean and standard deviation, the larger the sample size, the larger the test statistic and smaller the P-value (as long as the sample mean does not equal m 0) • Equivalence between 2 -tailed tests and confidence intervals: If a (1 -a)100% CI for m contains m 0, the P-value will be larger than a • 1 -sided tests: Sometimes researchers have a specific direction in mind for alternative hypothesis prior to collecting data.

Example - Crime Rates (1960 -80) • Sample: n=74 Chicago Neighborhoods • Goal: Show the average delinquency rate in the population of all such neighborhoods has increased from 1960 -1980 • Variable: Y = DR 1980 -DR 1960 • H 0: m = 0 (No change from 1960 -1980) • Ha: m > 0 (Higher in 1980, see Y above) • Sample Data:

Example - Crime Rates (1960 -80) • Test Statistic: • P-value: (Only interested in larger positive values since 1 -sided) • Conclusion: Strong evidence that the true mean delinquency rate among all neighborhoods that this sample was taken from has increased from 1960 to 1980. Source: Bursik and Grasmick (1993), “Economic Deprivation and Neighborhood Crime Rates, 19601980”, Law & Society Review, Vol. 27, pp 263 -284

Significance Test for a Proportion (Large-Sample) • Assumptions: – Qualitative Variable – Random sample – Large sample: n 10/min(p 0 , 1 - p 0) • Hypotheses: – Null hypothesis: H 0: p = p 0 – Alternative hypothesis: Ha: p p 0 (2 -sided) – Ha+ : p > p 0 Ha- : p < p 0 (1 -sided, prior to data)

Significance Test for a Proportion (Large-Sample) • Test statistic: • P-value: – Ha: p p 0 P = 2 P(Z |zobs|) – Ha+ : p > p 0 P = P(Z zobs) – Ha- : p < p 0 P = P(Z zobs) • Conclusion: Similar to test for a mean

Decisions in Tests · a-level (aka significance level): Pre-specified “hurdle” for which one rejects H 0 if the P-value falls below it. (Typically. 05 or. 01) • Rejection Region: Values of the test statistic for which we reject the null hypothesis • For 2 -sided tests with a =. 05, we reject H 0 if |zobs| 1. 96

Error Types • Type I Error: Reject H 0 when it is true • Type II Error: Do not reject H 0 when it is false

Error Types • Probability of a Type I Error: a-Level (significance level) • Probability of a Type II Error: b - depends on the true level of the parameter (in the range of values under Ha ). • For a given sample size, and variability in data, the Type I and Type II error rates are inversely related • Conclusions wrt H 0 are the same whether a hypothesis test or CI is conducted (fixed a)

Miscellaneous Issues • Statistical vs Practical Significance: With very large sample sizes, we can often obtain very small P-values even when the sample quantity is very close to the parameter value under H 0. Always consider the estimate as well as P-value. • While hypothesis tests and confidence intervals give similar conclusions wrt H 0, the CI gives a credible set of parameter values, which can be more specific than test

Small-sample Inference for m • t Distribution: – Population distribution for a variable is normal – Mean m, Standard Deviation s – The t statistic has a sampling distribution that is called the t distribution with (n-1) degrees of freedom: • Symmetric, bell-shaped around 0 (like standard normal, z distribution) • Indexed by “degrees of freedom”, as they increase the distribution approaches z • Have heavier tails (more probability beyond same values) as z • Table B gives t. A where P(t > t. A) = A for degrees of freedom 1 -29 and various A

Small-Sample 95% CI for m • Random sample from a normal population distribution: • t. 025, n-1 is the critical value leaving an upper tail area of. 025 in the t distribution with n-1 degrees of freedom • For n 30, use z. 025 = 1. 96 as an approximation for t. 025, n-1

t test for a mean • Assumptions: Random sample for a quantitative variable with a normal probability distribution • Hypotheses: – H 0: m = m 0 Ha: m m 0 (2 -sided) • Test Statistic: • P-Value: 2 P(t > |tobs|) • Conclusions as before, as well as 1 -sided tests
 Ace different tests help iq still
 Test of significance
 Which is the false statement regarding rdas
 Which statement is true regarding squall lines?
 A qualitative variable
 What is the characteristic of hypothesis
 Hypothesis example
 Alternative hypothesis
 Null hypothesis examples
 Protoplanet hypothesis weakness
 Building a thesis statement
 Statement of the problem and hypothesis in research example
 Conditional statement
 Hypothesis statement
 Attributive hypothesis
 Example of a hypothesis
 What realization does cole have regarding his father?
 Hersay in court
 Radial circuits
 Sample of enquiry letter


