Sequence Quality Assessment Nano Plot Summarizing data Designed
- Slides: 34
Sequence Quality Assessment
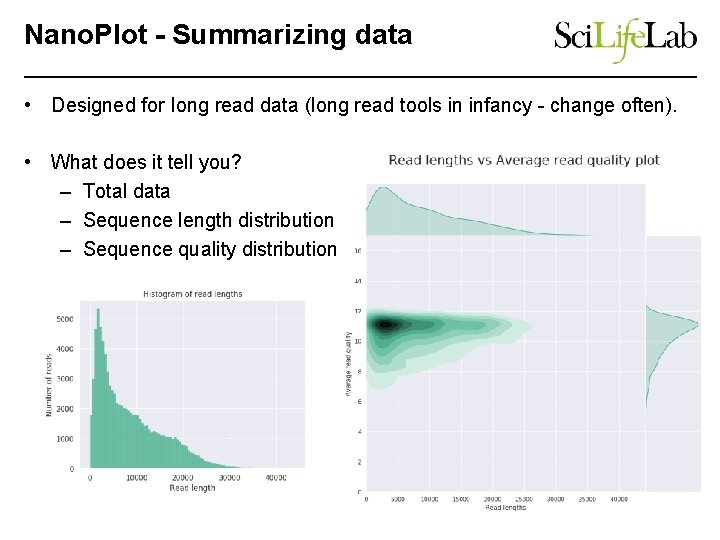
Nano. Plot - Summarizing data • Designed for Iong read data (long read tools in infancy - change often). • What does it tell you? – Total data – Sequence length distribution – Sequence quality distribution
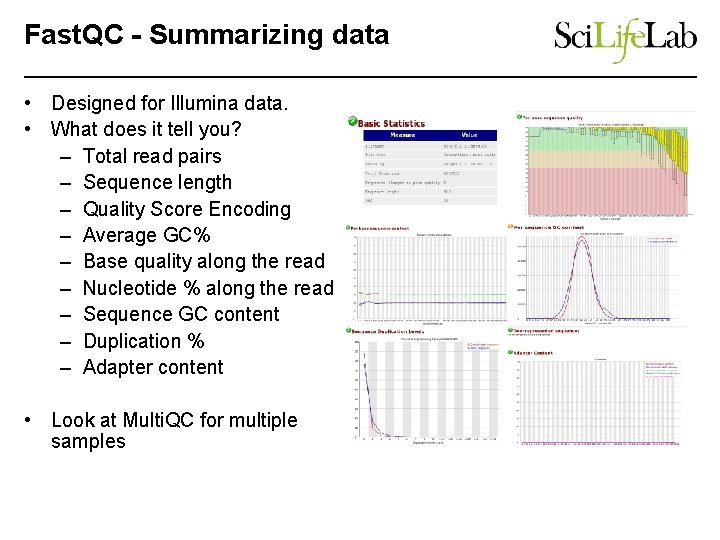
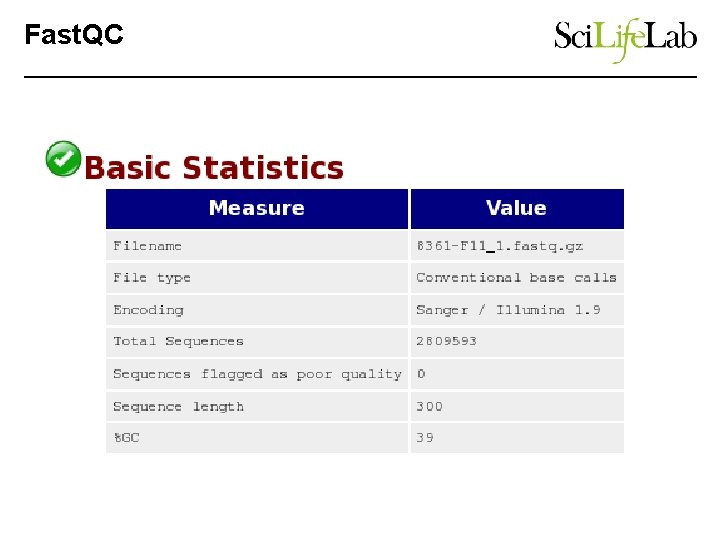
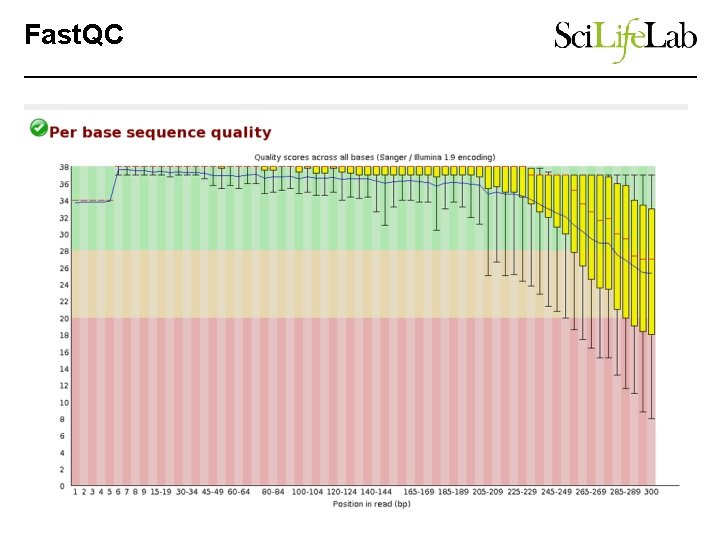
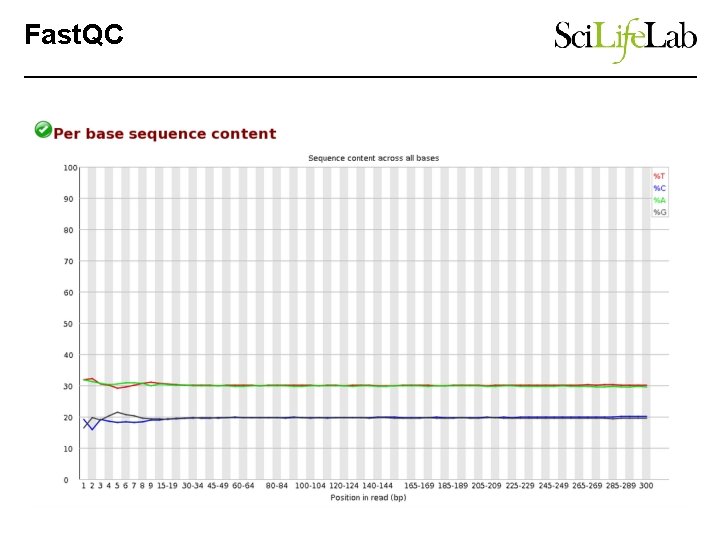
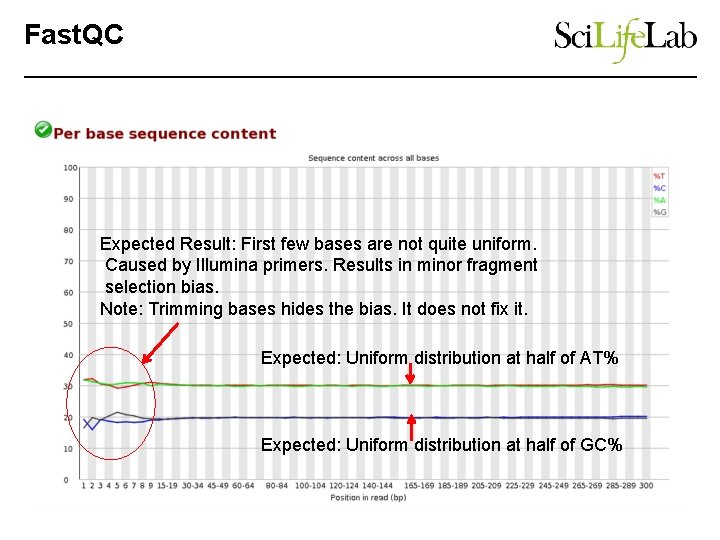
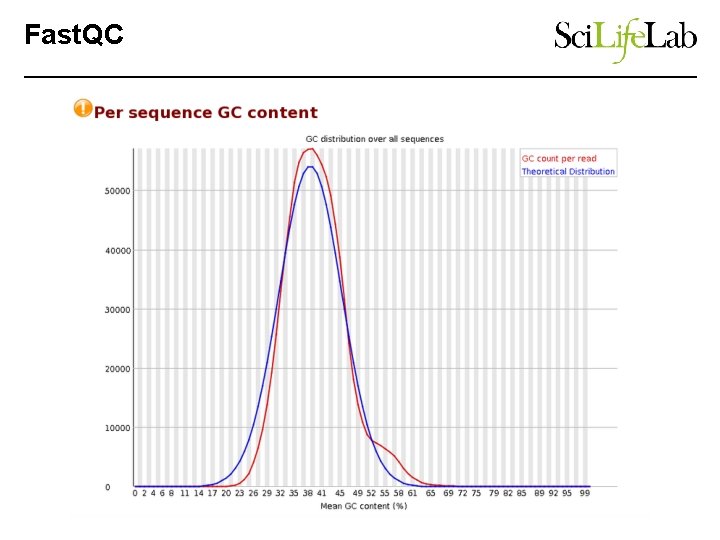
Fast. QC - Summarizing data • Designed for Illumina data. • What does it tell you? – Total read pairs – Sequence length – Quality Score Encoding – Average GC% – Base quality along the read – Nucleotide % along the read – Sequence GC content – Duplication % – Adapter content • Look at Multi. QC for multiple samples
Fast. QC
Fast. QC
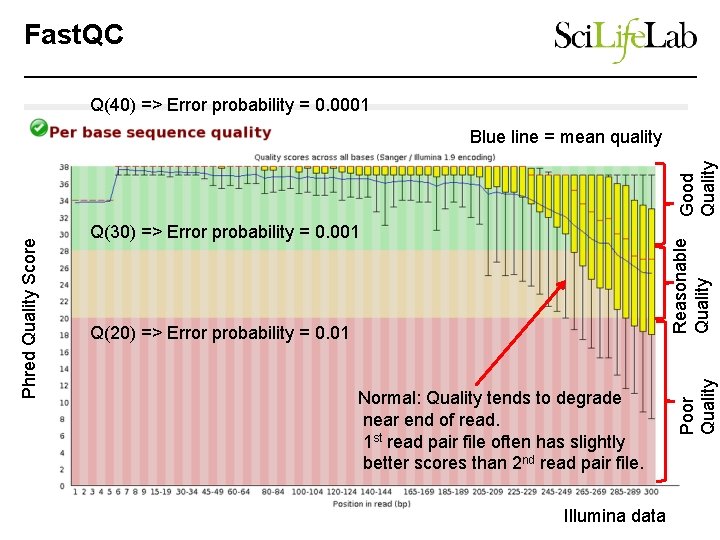
Fast. QC Q(40) => Error probability = 0. 0001 Reasonable Quality Q(30) => Error probability = 0. 001 Q(20) => Error probability = 0. 01 Normal: Quality tends to degrade near end of read. 1 st read pair file often has slightly better scores than 2 nd read pair file. Illumina data Poor Quality Phred Quality Score Good Quality Blue line = mean quality
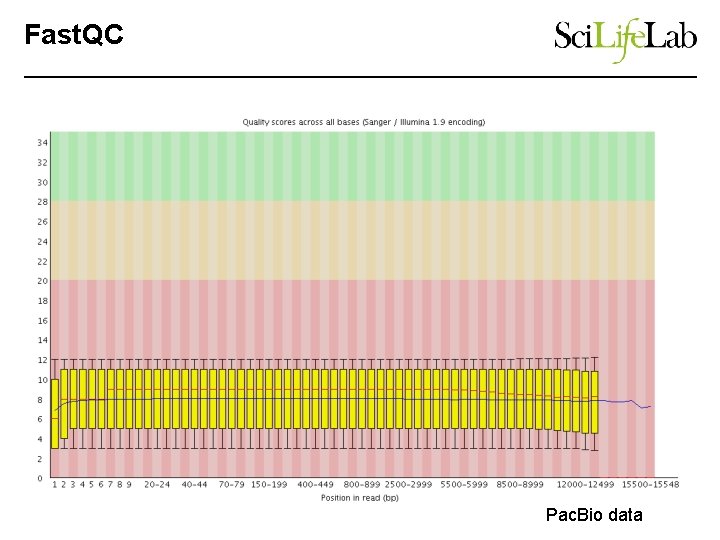
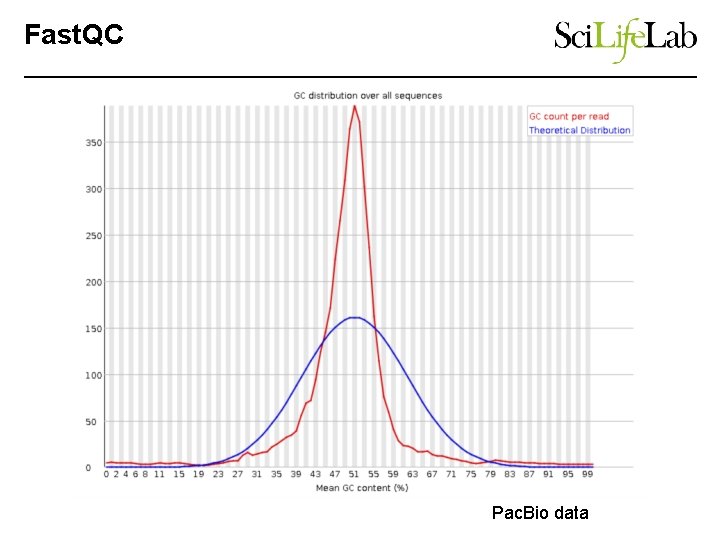
Fast. QC Pac. Bio data
Fast. QC
Fast. QC Expected Result: First few bases are not quite uniform. Caused by Illumina primers. Results in minor fragment selection bias. Note: Trimming bases hides the bias. It does not fix it. Expected: Uniform distribution at half of AT% Expected: Uniform distribution at half of GC%
Fast. QC
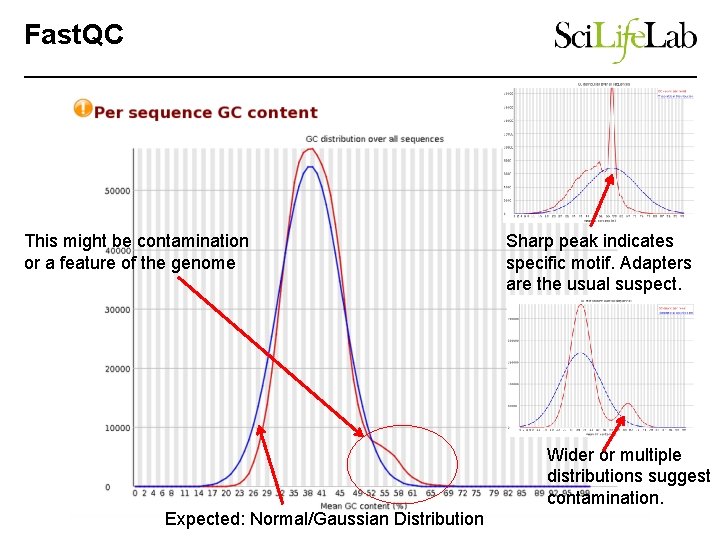
Fast. QC This might be contamination or a feature of the genome Sharp peak indicates specific motif. Adapters are the usual suspect. Wider or multiple distributions suggest contamination. Expected: Normal/Gaussian Distribution
Fast. QC Pac. Bio data
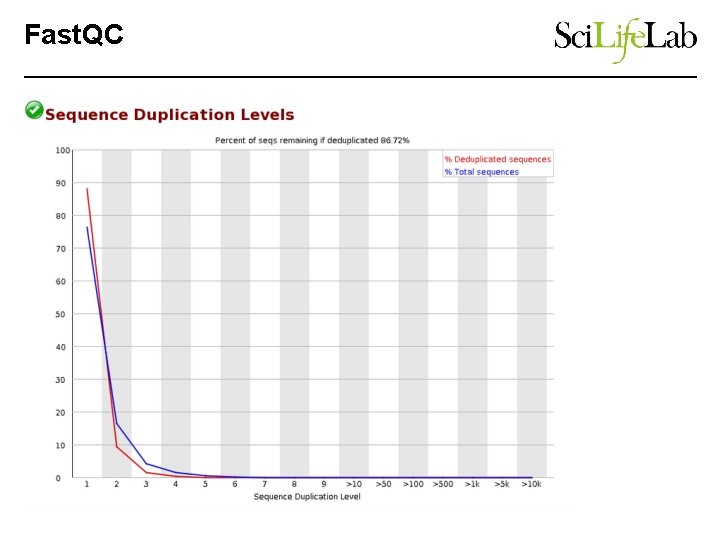
Fast. QC
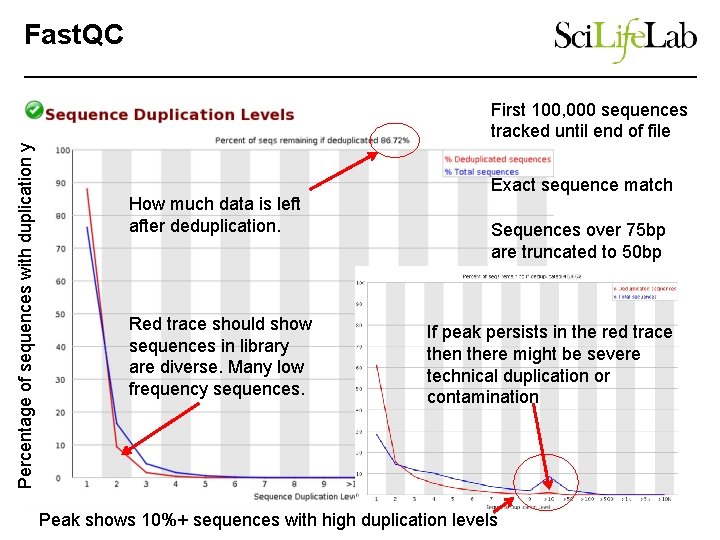
Fast. QC Percentage of sequences with duplication y First 100, 000 sequences tracked until end of file How much data is left after deduplication. Red trace should show sequences in library are diverse. Many low frequency sequences. Exact sequence match Sequences over 75 bp are truncated to 50 bp If peak persists in the red trace then there might be severe technical duplication or contamination Peak shows 10%+ sequences with high duplication levels
Fast. QC
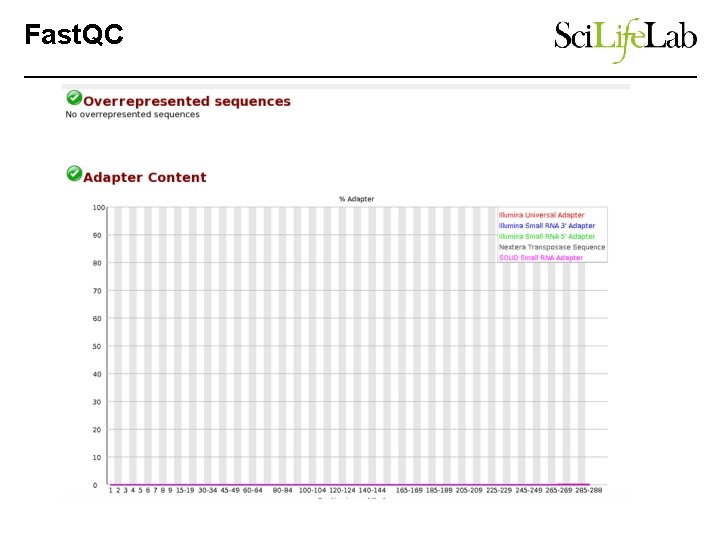
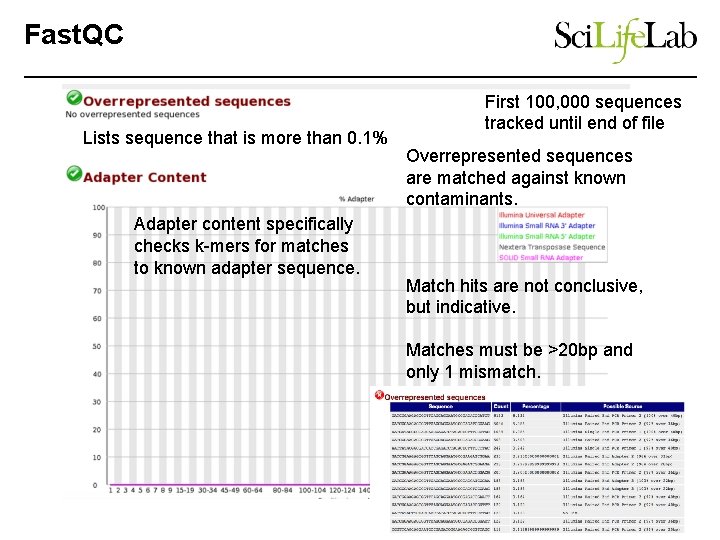
Fast. QC Lists sequence that is more than 0. 1% Adapter content specifically checks k-mers for matches to known adapter sequence. First 100, 000 sequences tracked until end of file Overrepresented sequences are matched against known contaminants. Match hits are not conclusive, but indicative. Matches must be >20 bp and only 1 mismatch.
Fast. QC
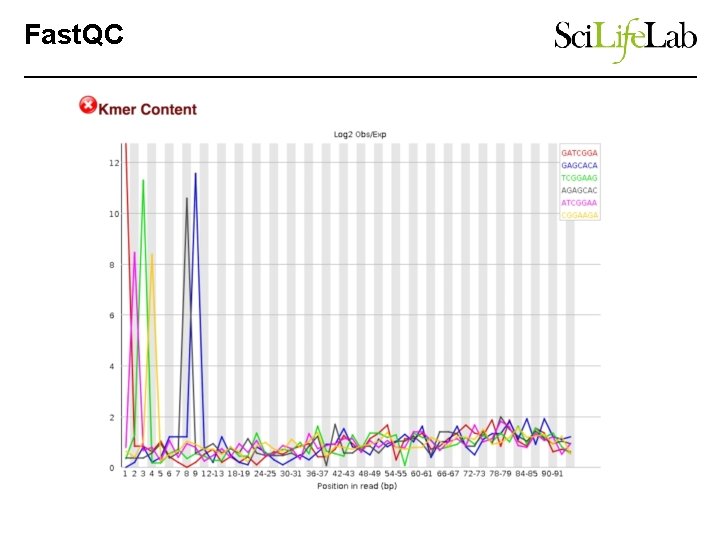
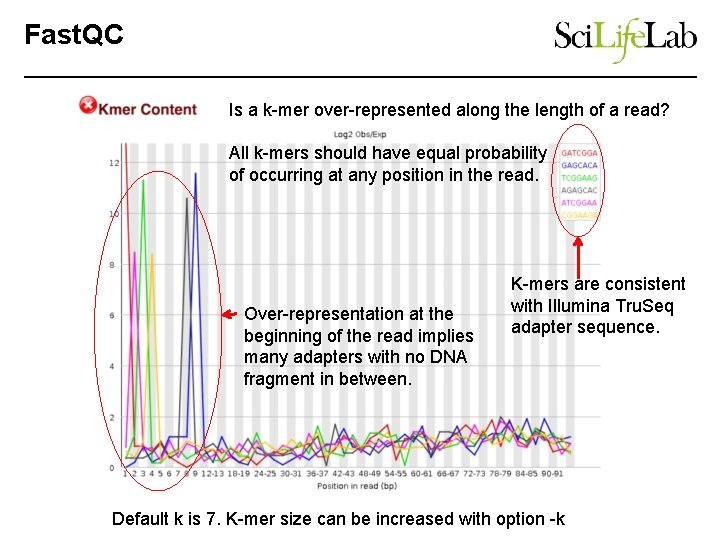
Fast. QC Is a k-mer over-represented along the length of a read? All k-mers should have equal probability of occurring at any position in the read. Over-representation at the beginning of the read implies many adapters with no DNA fragment in between. K-mers are consistent with Illumina Tru. Seq adapter sequence. Default k is 7. K-mer size can be increased with option -k
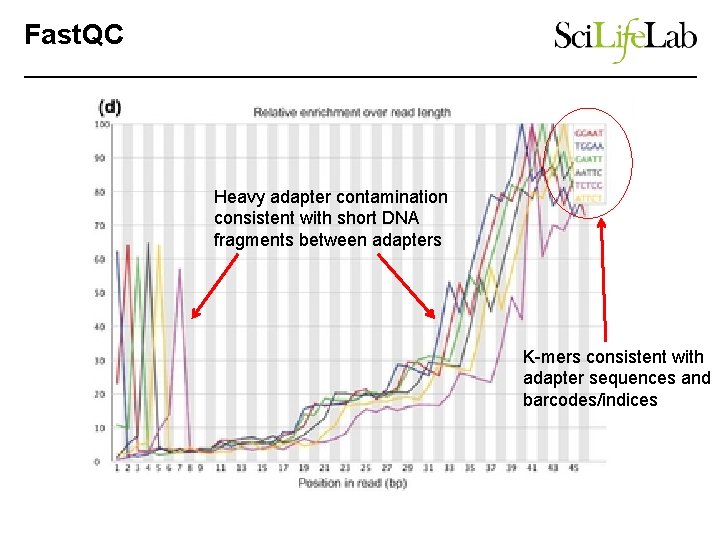
Fast. QC Heavy adapter contamination consistent with short DNA fragments between adapters K-mers consistent with adapter sequences and barcodes/indices
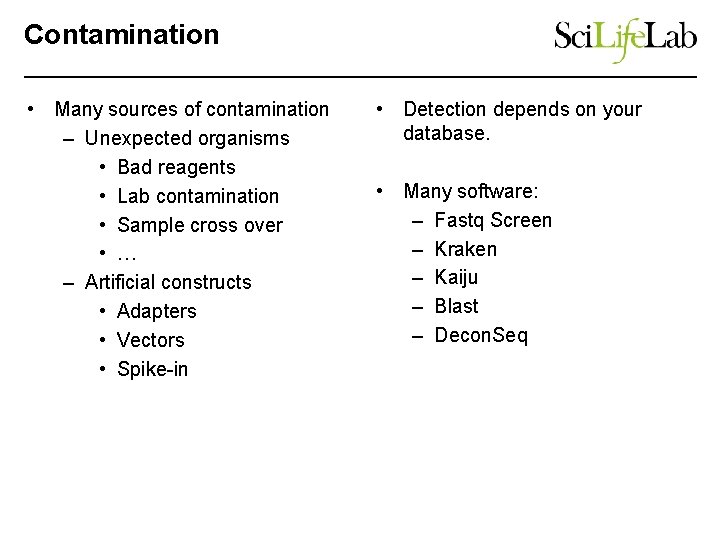
Contamination • Many sources of contamination – Unexpected organisms • Bad reagents • Lab contamination • Sample cross over • … – Artificial constructs • Adapters • Vectors • Spike-in • Detection depends on your database. • Many software: – Fastq Screen – Kraken – Kaiju – Blast – Decon. Seq
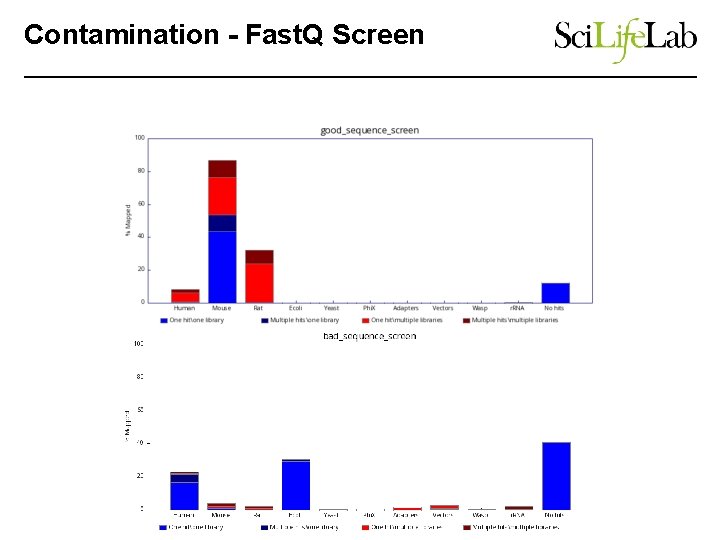
Contamination - Fast. Q Screen
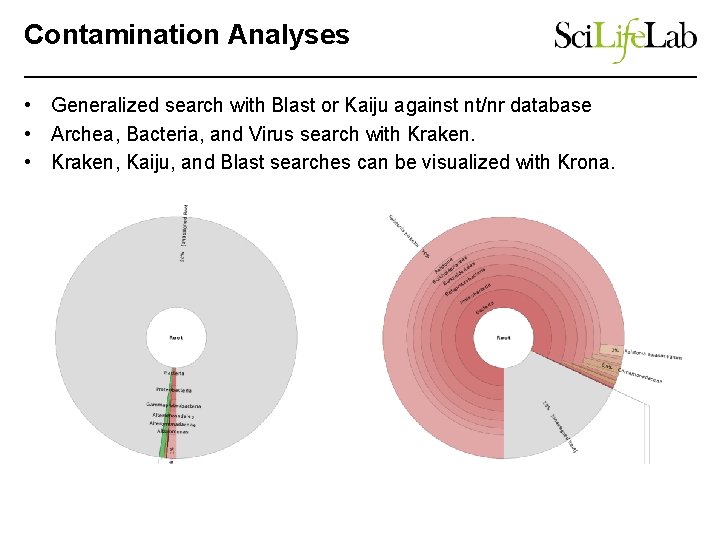
Contamination Analyses • Generalized search with Blast or Kaiju against nt/nr database • Archea, Bacteria, and Virus search with Kraken. • Kraken, Kaiju, and Blast searches can be visualized with Krona.
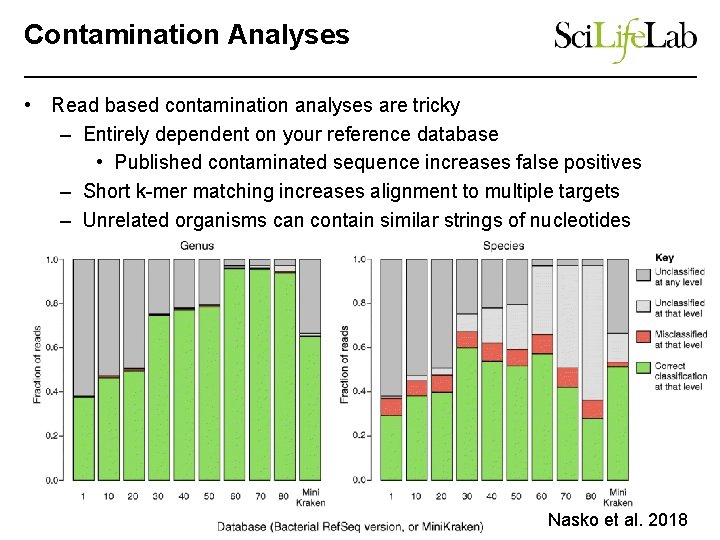
Contamination Analyses • Read based contamination analyses are tricky – Entirely dependent on your reference database • Published contaminated sequence increases false positives – Short k-mer matching increases alignment to multiple targets – Unrelated organisms can contain similar strings of nucleotides Nasko et al. 2018
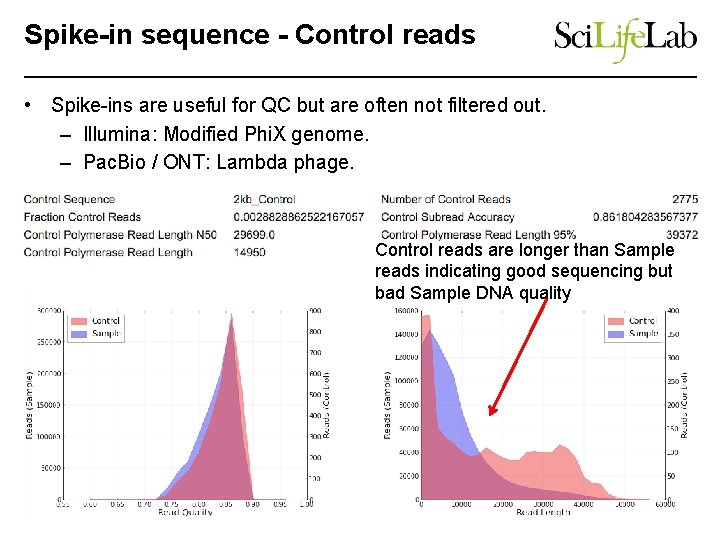
Spike-in sequence - Control reads • Spike-ins are useful for QC but are often not filtered out. – Illumina: Modified Phi. X genome. – Pac. Bio / ONT: Lambda phage. Control reads are longer than Sample reads indicating good sequencing but bad Sample DNA quality
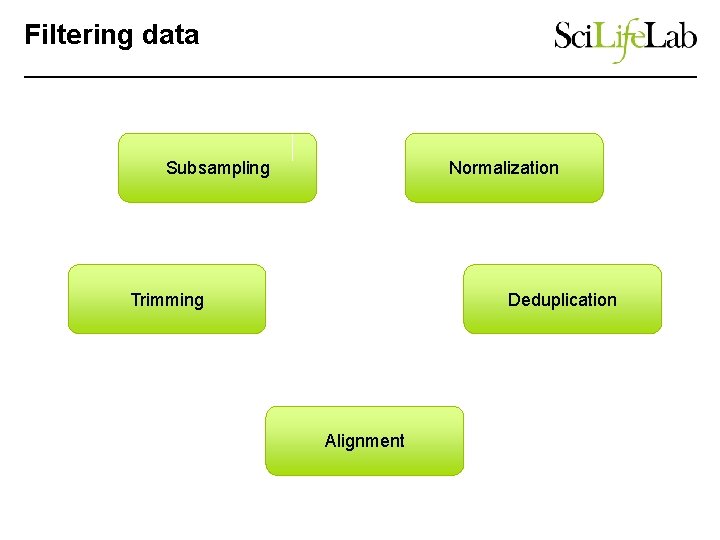
Filtering data Subsampling Normalization Trimming Deduplication Alignment
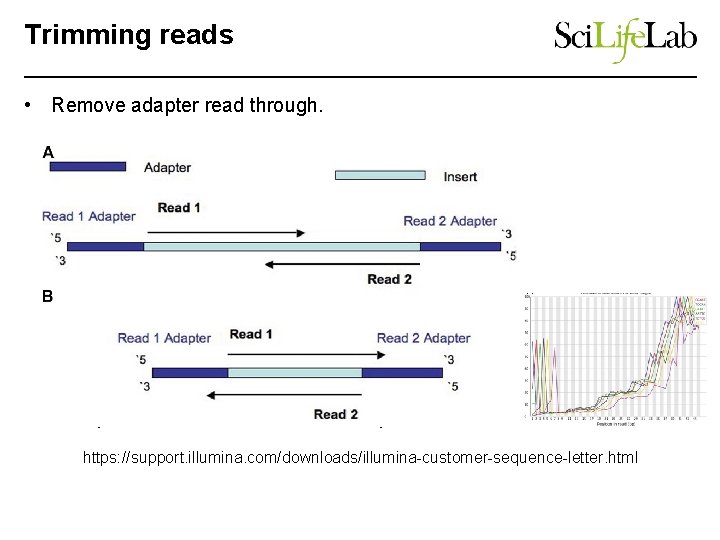
Trimming reads • Remove adapter read through. – Update to date list of Illumina adapters: https: //support. illumina. com/downloads/illumina-customer-sequence-letter. html
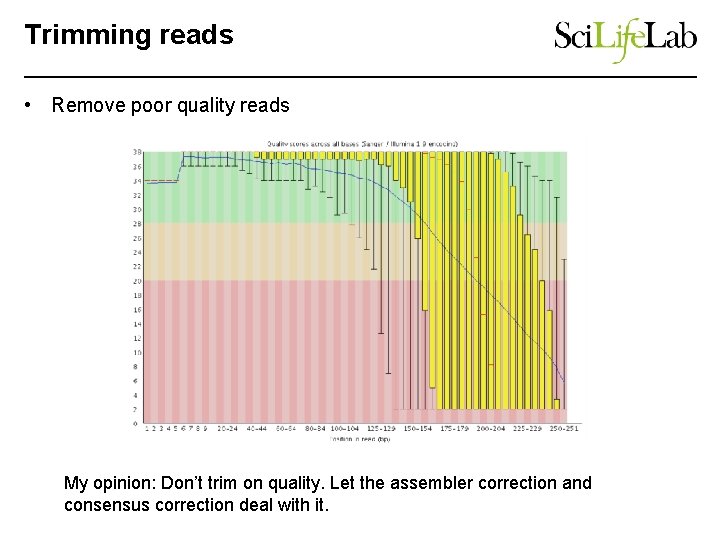
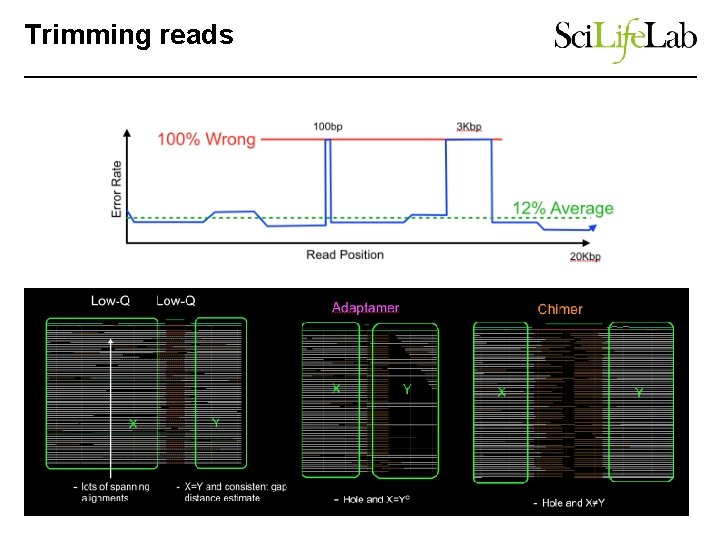
Trimming reads • Remove poor quality reads My opinion: Don’t trim on quality. Let the assembler correction and consensus correction deal with it.
Trimming reads
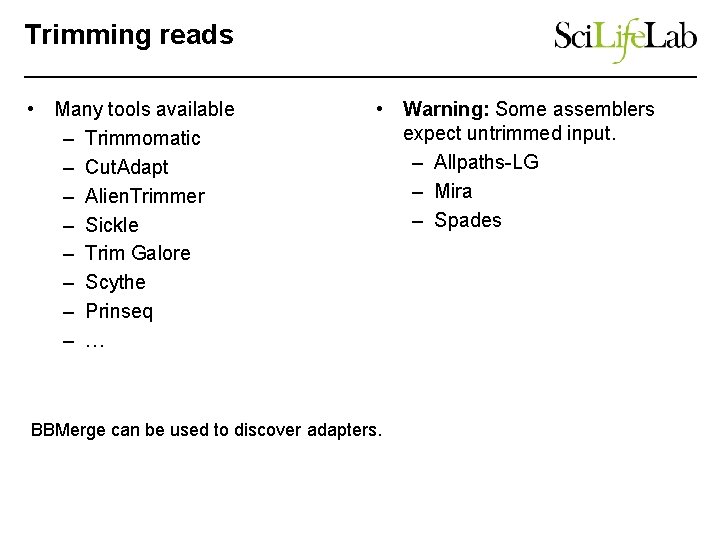
Trimming reads • Many tools available – Trimmomatic – Cut. Adapt – Alien. Trimmer – Sickle – Trim Galore – Scythe – Prinseq – … • Warning: Some assemblers expect untrimmed input. – Allpaths-LG – Mira – Spades BBMerge can be used to discover adapters.
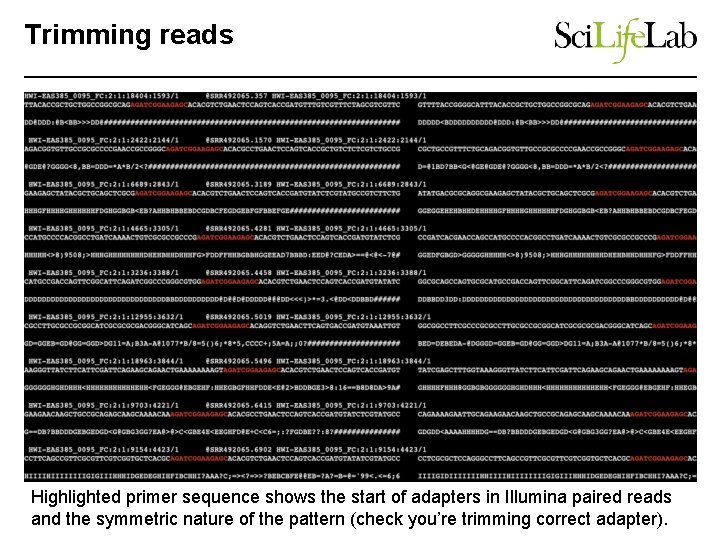
Trimming reads Highlighted primer sequence shows the start of adapters in Illumina paired reads and the symmetric nature of the pattern (check you’re trimming correct adapter).
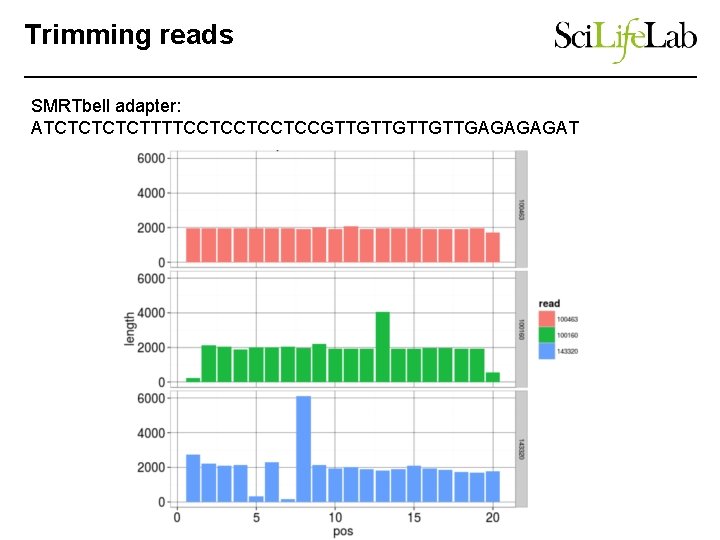
Trimming reads SMRTbell adapter: ATCTCTTTTCCTCCGTTGTTGAGAT
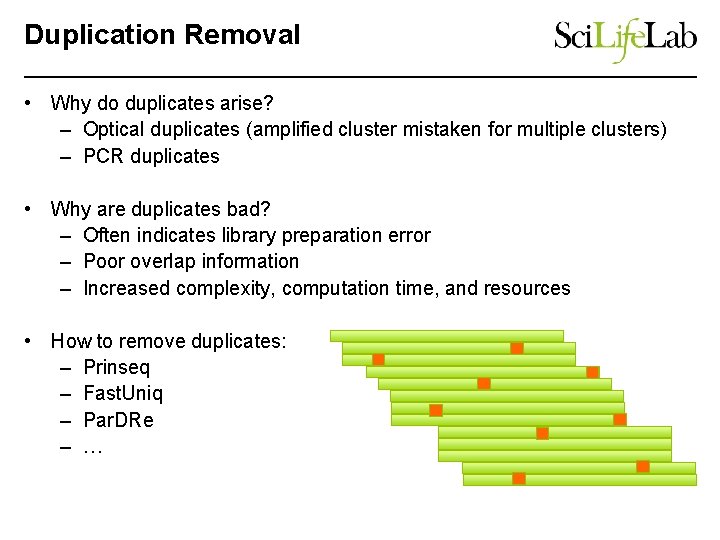
Duplication Removal • Why do duplicates arise? – Optical duplicates (amplified cluster mistaken for multiple clusters) – PCR duplicates • Why are duplicates bad? – Often indicates library preparation error – Poor overlap information – Increased complexity, computation time, and resources • How to remove duplicates: – Prinseq – Fast. Uniq – Par. DRe – …
Reference based filtering • Contaminants identified from Blast, Kraken, Kaiju, etc imply available references. • Reads can be aligned to these sequences. • Filter out reads that align uniquely to those sequences. – This can still over-filter. • Alternatively, filter contaminants after assembly.
Summary • Fast. QC / Nano. Plot – Diagnostic plots • Trim adapter sequence. • Remove duplicates from heavily duplicated data. • Treat early contamination analyses as suggestive. • Remove heavy contamination.