Rate of Change and Slope I can and


- Slides: 14


Rate of Change and Slope I can and I will find rates of change and slopes.

What We Already Know: Finding Slope Graph y = 2 x - 3 x -3 -2 -1 0 1 2 3 y -9 -7 -5 -3 -1 1 3 y x y = 2 x - 3

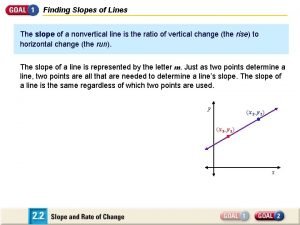
Find the slope of a line given two points. Slope of a line y vertical change Slope (m) = horizontal change Slope (m) = y x Slope (m) = rise run Slope (m) = +2 = +1 m=2 +1 +2 x y-intercept = -3 y = 2 x - 3

Find the slope of the line below. y Slope (m) = rise run Slope (m) = +1 +3 +3 +1 x m= 1 3

Find the slope of the line below. y Slope (m) = rise run Slope (m) = x -4 -4 +2 m = -2 +2

Algebraic Method to Find Slope Given Two Points y y 2 - y 1 Slope (m) = x 2 - x 1 2 (1, 2) 1 (-2, -3)

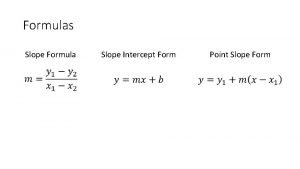
FORMULA for finding slope of a line if you know two points. y 2 - y 1 Slope (m) = x 2 - x 1

Ex. 1) Find the slope between (-1, 3) and (4, 7).

Ex. 2) Find the slope between (6, 5) and (-1, 7).

Slope of Horizontal and Vertical Lines Horizontal Lines Vertical lines Ex. 3) (-2, 2) (1, 2) Ex. 4) (-3, 2) y (-2, 2) (-3, -1) y (1, 2) (-3, 2) x (-3, -1) x

What is rate of change? • Rate: A ratio that compares two quantities. • Rate of Change: A ratio of the change in one quantity to a corresponding unit change in another quantity. • y 2 – y 1 x 2 – x 1

Ex. 5) The table shows the average temperature for five months in Dickson. Find the rate of change in the temperature between month 2 and month 7. Month 2 3 5 7 8 Temp 56 56 63 71 72

Find: Rate of Change Point A to B
 Slope vocabulary
 Practice a rate of change and slope
 Rise and run
 3-3 rate of change and slope
 Rate of change and slope quick check
 3-3 rate of change and slope
 Unit 6 lesson 1 rate of change and slope
 5-3 interpreting rate of change and slope
 Constant rate
 Categorize the slope of the line
 Constant rate of change example
 Slope decline theory
 Converting point slope to slope intercept
 Slope review classifying slope
 Slope review classifying slope


