Rate of Change and Slope Chapter 3 3


- Slides: 12

+ Rate of Change and Slope Chapter 3 -3: Rate of Change and Slope

+ Lesson Objectives n. To determine the slope of a line when given the equation of the line. n. To determine the slope of a line when given a graph. n. To determine the slope of a line when given two points on the line. n. To determine whether the slope is positive, negative, zero or undefined.

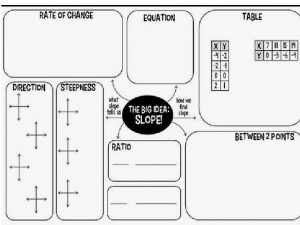
+ What is slope? n The slope of a line can be described as or . n The slope represents a constant rate of change in the dependent variable when the independent variable changes by a fixed amount. n The slope of a line determines its relative steepness.

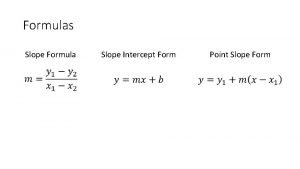
+ How can I determine the slope of a line? n From the graph of a line n From the equation of a line n y = -6 x + 4 n From two points n (2, 1) and (0, 6)

+ How can I determine the slope from the graph of a line? n Use to determine the slope. § Use to determine the slope.

+ How can I determine the slope from the equation of a line? n y = mx + b m = slope b = y-intercept n When the equation is in the form y=mx + b, the coefficient of the x is the slope. n y = -6 x + 4 n y = -2/5 x +3 n 3 x + 2 y = 24

+ How can I determine the slope from two points? n The formula § (2, 1) and (0, 6) can be expanded to § (4, -2) and (4, 5) n Plug in the values of x and y for each point. n Evaluate § (-4, 3) and (2, -2)

+ How can I categorize slopes? Positive Slope Negative Slope Zero Slope Undefined Slope

+ Slope as a Rate of Change n. The graph shows the altitude of an airplane as it comes in for a landing. Find the rate of change. Explain what this rate of change means.

+ Slope as a Rate of Change n The graph shows how much it costs to rent carousel equipment. n Estimate the rate of change of the line. What does that number mean? n Customers pay $2 for a ride. What is the average number of customers needed to cover the rental costs?

+ A Little Song Let’s say you got a job and you’re earnin’ your pay, You start with 50 bucks and get 9 every day, If you wanna know over a year how much you’ll get, Calculatin’ that graph might be your best bet. On the x, you’re measurin’ one day at a time, And your money gets tracked on the vertical y. Now you got some, and you ain’t even worked yet, 50 bucks, put it up, that’s your y-intercept.

+ A Little Song After day one you got 59, Now you got two points, you can start drawin’ a line. The slope of the line, remember rise over run, It’s dollars over days and you got 9/1.
 Rate of change and slope lesson 3-2
 How to find rate of change on a graph
 5-1 rate of change and slope
 3-3 practice rate of change and slope
 5-1 practice rate of change and slope
 3-3 rate of change and slope
 Unit 6 lesson 1 rate of change and slope
 5-3 interpreting rate of change and slope
 Constant rate of change
 3-3 rate of change and slope
 Rate of change and slope lesson 3-2
 Difference between slope decline and slope retreat
 Converting point slope to slope intercept


