Poverty Amidst Plenty 2015 HUMMING AT A HIGHER


- Slides: 38
Poverty Amidst Plenty, 2015 HUMMING AT A HIGHER LEVEL OF STRESS ge a hu und s i n o tatio t get ar s r o p ’ bu n ns Tra , we ca e is no len r e issu hen the lis to G and a o e it. W Annap es thre re, it is k m fro ie it ta get the n o Bur hours t f l ha y. craz Afford a Arund ble housing el Cou i nty is n Anne for a 2 h 1 a little t year old w rd to find ho has o no w ork ex and m pe ay is mak be works in rience in a job th minim g a little m o um wa re tha at ge. n so mal is 0 r o n 1 ew The n t than even n e differe o. Kids liv g a s year s. c stres wntime, i x o t in o ’s no d lug. e r e h T p ver un you ne Pamela M. Brown. Ph. D. Executive Director Anne Arundel County Partnership for Children, Youth and Families
The State of the County Anne Arundel County population is 556, 348; a growth of 11. 2% since 2000 Senior population (over 65) increasing from 99, 086 (2013) to 140, 000 by 2030 The Hispanic population is now at 6. 4% or 34, 854 residents. There are 33, 352 residents (6. 3%) living below poverty, a slight dip from 2011 Anne Arundel County is one of most expensive places to live in the state The gap between rich and poor has widened since 2010. The majority of negative social/ health indicators polarized Northern and South All of our rivers are “impaired” under the Clean Water Act Anne Arundel was given an F by the American Lung Association for an average of 23 unhealthy, high ozone days every year between 2011 and 2013.
Ethnic/ Racial Composition Anne Arundel County, 1990 -2013 Ethnic/ Racial Composition Anne Arundel County, 2000 -2013 Total Population Non-Hispanic Whites Percent Change, 2000 2013 2000 -2013 Amount % % 489, 656 100. 0 537, 656 100. 0 544, 426 100. 0 11. 2 390, 519 79. 8 405, 456 75. 4 408, 715 75. 1 4. 6 99, 137 20. 2 132, 200 24. 6 135, 711 25. 0 37. 0 Hispanic or Latino 12, 902 2. 6 32, 902 6. 1 34, 854 6. 4 170. 0 Black or African. American 65, 755 13. 4 83, 484 15. 5 84, 230 15. 5 28. 0 Other* 20, 480 4. 2 15, 814 3. 0 16, 627 3. 1 18. 0 Other Races: U. S. Census Bureau, American Community Survey, 2013 “Other” here includes “American Indian and Alaskan Native”, “Asian”, “Native Hawaiian or other Pacific Islander”, “Some other race”, or “Two or more races”. Therefore, the “White” and “Black” figures are those who were counted as “White alone” or “Black alone. ”
Hispanic Population by Census Tract
Poverty, Anne Arundel County, US Census 2013 Estimates Below poverty level Population below poverty level Percent below poverty level 33, 352 6. 3% Under 18 years 9, 966 8. 0% 18 to 64 years 19, 765 5. 8% 3, 621 5. 5% Male 14, 860 5. 8% Female 18, 492 6. 8% 16, 701 4. 4% Black or African American 9, 997 12. 7% Asian 2, 092 11. 0% Hispanic (of any race) 3, 172 9. 4% Age 65 years and over Sex Race and Ethnicity White, not Hispanic or Latino
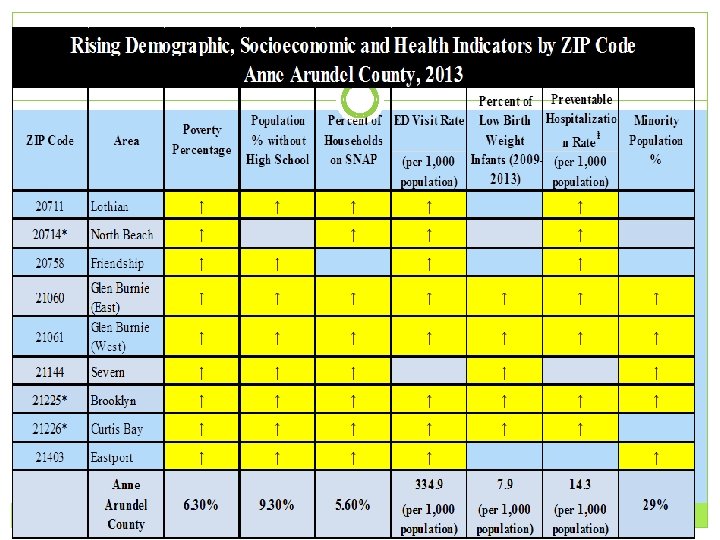
Top 7 Areas of Poverty, 2013 Selected Poverty Percentages by ZIP Code Anne Arundel County, 2013 ZIP Code Area Poverty Percentage 21225 Brooklyn 26. 5% 21077 Harmans 16. 8% 21226 Curtis Bay 16. 5% 21060 Glen Burnie (East) 11. 2% 21061 Glen Burnie (West) 10. 8% 20714 North Beach 9. 9% 20751 Deale 9. 2% Anne Arundel County 6. 3%
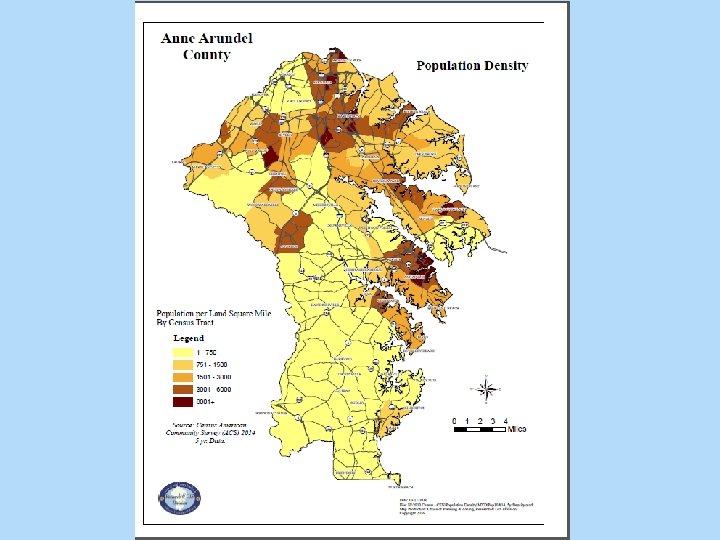
The Geography of Poverty
Income - the gap between rich and poor is growing Estimated Annual Household Income Numbers 2010 and 2013 Total Number of Households 2010: 195, 999 Per household Number 2013: 199, 904 % Number % Percent Change Less than $25, 000 20, 819 10. 62 21, 890 10. 95 5. 14% 25, 000 -34, 999 12, 201 6. 23 11, 584 5. 79 -5. 06% 35, 000 -49, 999 19, 077 9. 73 18, 623 9. 32 -2. 38% 50, 000 -74, 999 34, 853 17. 78 32, 962 16. 49 -4. 69% 75, 000 -99, 999 29, 982 15. 30 29, 086 14. 55 -2. 99% 100, 000 -199, 999 61, 569 31. 41 64, 274 32. 15 4. 39% 200, 000 and above 17, 498 8. 93 21, 485 10. 75 22. 79% 195, 999 100. 00 199, 904 100. 00 TOTAL
Living Wage Calculation for Anne Arundel County
Housing and Homelessness • The median price for a house is 4 th highest in the state at $320, 000. Average rent $1, 300 • Lack of affordable housing – defined by HUD as less than 30% of household income. County homeowners spent 34. 3% and renters spent a staggering 49. 5% of their income on housing. • Most county property reserved for residential use is zoned for single-family • 9, 000 families on the waiting list for public housing and 10, 000 families on the waiting list for Housing Choice (Section 8) vouchers. • The numbers of single adult homeless residents in shelter or on the street has decreased to approximately 300 in 2015. • The fastest growing homeless population is homeless families and youth who are staying with friends or living temporarily in motels. There are over 250 families living in a shelter or transitional housing. • Anne Arundel County Public School System estimates suggest there are over 925 county students who do not sleep in their own homes on any given night.
Percentage of Families spending over 30% of Income on Housing “Affordable housing in Anne Arundel County is hard to find for a 21 -year-old who has little to no work experience and maybe works in a job that is making a little more than minimum wage. ” 60% 50% 49, 50% 40% 30% 2006 34, 30% 2010 2013 20% 10% 0% Homeowners Renters “My ideal house would have hot water and a working toilet, have a washer and dryer. I don’t like walking to go wash my clothes, it is really far away. Little things like having a basketball rim that isn’t bent, being able to have a lawn and see trees would be ideal. ”
Numbers of Homeless Served in Anne Arundel County 2013 -2014 “I can’t imagine that anyone would say a county where six people froze to death over the winter is a safe place. ”
Public Mental Health Services, 2012 -2014 Number of People Served by a Public Mental Health Service in Anne Arundel County Early Child (0 -5) Child (6 -12) Adolescent (13 -17) Transitional (18 -21) Adult (22 to 64) Elderly (65 and over) TOTAL 2012 2013 Percent of Change (12 -13) 2014 Percent of Change (13 -14) 392 394 0. 5% 473 20. 1% 1, 821 1, 880 3. 2% 2, 152 14. 5% 1, 388 1, 476 6. 3% 1, 617 9. 6% 586 584 -0. 3% 610 4. 5% 5, 351 5, 762 7. 7% 6, 396 11. 0% 59 70 18. 6% 73 4. 3% 9, 597 10, 166 5. 9% 11, 321 11. 4%
Heroin Emergency Room Visits A survey of 9, 000 patients at treatment centers around the country found that 90 percent of heroin users were white men and women. Most were relatively young, with an average of 23, and 75 percent of users said they first became addicted with prescription opioids like Oxy. Contin
Heroin Overdoses January – April 2016
Youth Development Almost 127, 000 children under the age of 18 living in Anne Arundel County 21% (25, 569) are considered low income and 8%, or nearly 10, 000 children, are living below the Federal poverty level Academic achievement is higher than the state The number of youth with no high school diploma has decreased High school graduation numbers have increased. Achievement gaps related to race and income have shrunk a little BUT Only 43% of Anne Arundel County’s children enter kindergarten ready to learn Last year an average of 200 county children per month were abused or neglected Unemployment rate in the county for youth is 16. 9% or one in four youth. Soft skills are lacking
Hungry Children • Fifth in the state for the highest number of hungry children. • In 2014, school system personnel served 2, 839, 421 breakfasts, 4, 987, 885, lunches, 89, 855 dinners and 85, 091 summer meals, for a grand total of 6, 002, 252 meals.
Food Environment, 2015
New Child Readiness Data, 2015 Child Readiness in Anne Arundel County 50% 45% 43% 40% 35% 27% 30% 25% 20% 15% 17% 15% 10% 5% 0% Total Children Ready in County Children with Disability English Language Learners Children from Low-Income Households
Unaccompanied Youth AACPS Unaccompanied Youth Numbers by School Feeder, 2015 School Feeder Number of Youth Annapolis Arundel Broadneck Chesapeake Glen Burnie Meade Northeast North County Old Mill Severna Park Southern South River TOTAL 79 21 17 5 50 47 6 25 21 6 6 10 293
Disconnected Youth q q q 8, 175 in Anne Arundel County More in North County Disconnected Youth live in disconnected communities 4, 499 youth were unemployed, giving an unemployment rate in the county of 16. 9% or one in four youth. Unemployment is much higher among disconnected youth than the population at large, mainly because many are also dropouts.
Employment Rate by Race and Ethnicity 16 -24 Years Unemployment rate for AA County is 4. 7%
Homeless Youth
Homeless Youth
Needs and Gaps in Youth Services Mentoring programs, especially for financial literacy and soft skills Parenting programs More after school for low-income children Growing mental health needs of youth, especially “We need to teach them how to show up to work on time, how to dress, have a good email address. They’re not just lacking employable skills but how to communicate…We have people who’ve cycled through job after job because they can’t get along with other people. ” those who have suffered through trauma and poverty More truancy programs Lack of career education and soft skills training in the school system Job center satellites inside neighborhoods One stop-shops for all services “We need community centers in low income communities, not just public housing. Some place where there adults and always someone to watch them. ”
Seniors Lack of affordable housing causes adult children to move in with seniors and seniors to move in with their children. More seniors seeking food help or help with their electricity. Almost 5, 000 grandparents have primary responsibility for their grandchildren The number of county residents 65 and over seeking mental health services has increased 22% since 2012. The 65 and over population accounts for 40% of county hospital admissions and 46% of readmissions (admitted three times or more in a year. ) Lack of transportation creates issues with isolation and general mobility Lack of communication and collaboration among private and public agencies
Senior Population Trends Senior Citizen Population Estimates for Anne Arundel County Number of People 160000 140000 120000 100000 80000 60000 40000 20000 0 2013 2020 Year 2030 2040
The Underlying Issue - Stress • The word for 2015 in Anne Arundel County is STRESS related to: • • Immediate electronic communication Violence in our own country and throughout the world Issues related to poverty Increased work hours at every pay grade As one participant commented: Kids are watching ISIS – there’s a base level of trauma that has jumped. Everyone is already elevated. . . we are humming at a higher level of stress. Now two parents working is not enough. The new normal is so different than even 10 years ago. Kids live in toxic stress. There’s no downtime, you never unplug.
The Three Big Needs -unchanged since 2012 Affordable Housing The median price for a house is still rising and is higher than the state; $320, 000 in 2015, a rise of 1. 5% from $315, 406 in 2014 – 4 th highest in state HUD defines affordable housing as ‘housing for which the occupant pays no more than 30 percent of his or her income for gross housing costs In 2013, Anne Arundel County homeowners spent 34. 3% and renters spent a staggering 49. 5% of their income on housing. Child Care Child care ranks third among other major household expenses at $21, 228 per year for a family with two children (20. 96% of median family income is spent on child care. ) Some low income families qualify for Federal child care vouchers but there is usually a gap between the amount of the voucher and the amount needed for child care. Transportation and land use policies designed to support and encourage automobile travel. City of Annapolis offers a circular route and fixed route services. County provides subsidy support for 3 bus routes (B, J and K) operating on one hour to ninety minute intervals covering Maryland City, Odenton, Severn, and North West Glen Burnie. 3 county routes No buses from Annapolis or South County to Glen Burnie; the area with the highest number of jobs.
Summary – Main Points Income gap is growing Mental health and substance abuse are major concerns across all populations Poverty and hunger are growing and geographic Unemployment among youth is high, especially for those in low income families Numbers of homeless children and families are growing
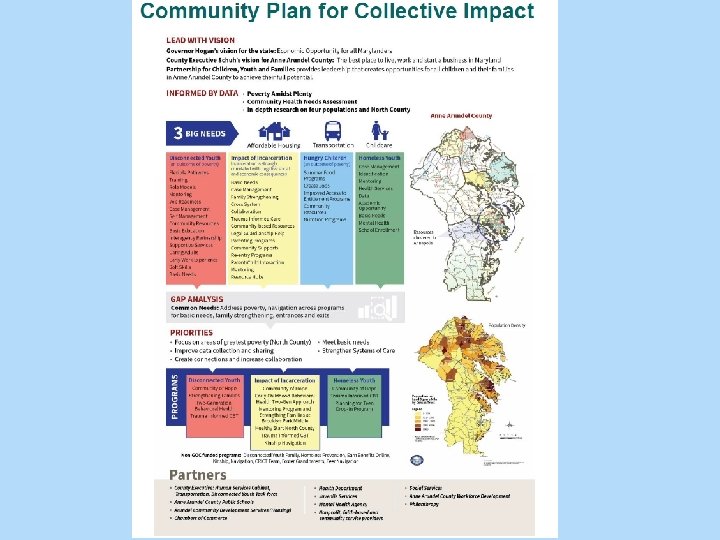
What can we do? Build Collective Impact: The commitment of a group of people from different community sectors to a common agenda for solving a specific social problem, using a structured form of collaboration.
What’s our Common Ground? 1. SOCIAL CONNECTIONS: Houses of Worship promote consistent weekly contact with members of their congregations in the context of family, friends and community “Forsake not the assemblying of yourselves together. ” 2. CONCRETE SUPPORTS IN TIMES OF NEED: Houses of Worship address the emergent and immediate needs of members of their congregation and the community through “benevolent funds” “tithe…(bless) the widow, the orphan, the stranger, the Levite. ” 3. KNOWLEDGE OF PARENTING & CHILD DEVELOPMENT: Houses of Worship promote parenting norms and principles. “Train-up a child in the way that s/he should go. ” 4. CHLDREN’S SOCIAL & EMOTIONAL DEVELOPMENT: Houses of Worship speak to the development of mind, body and soul. “As a person thinks in their heart, so is that person. ” 5. PARENTAL RESILIENCE: Houses of Worship promote “an overcoming” attitude and spirit. “Greater is the GOD within you than (he) that is within the world. ”
Standing in the Gap in North County Faith Into Action Community Lunch Program School system provided summer lunch program ended August 11 A group of churches and businesses pulled together to fill the gap 80 meals delivered to 2 apartment complexes in Glen Burnie every day until school started.
What does it take? To help a homeless family back on to their feet To improve the grades of a struggling student To feed a hungry child To build hope for a drug addict To fight, shoulder to shoulder, with someone suffering from mental illness It takes ALL OF US!