Polaris A System for Query Analysis Visualization of
- Slides: 26
Polaris: A System for Query, Analysis, & Visualization of Relational Databases Chris Stolte May 29 th, 2002
Motivation § Large multi-dimensional databases have become very common • corporate data warehouses • Amazon, Walmart, … • scientific projects: § • Human Genome Project • Sloan Digital Sky Survey Need effective tools for exploration and analysis of these databases
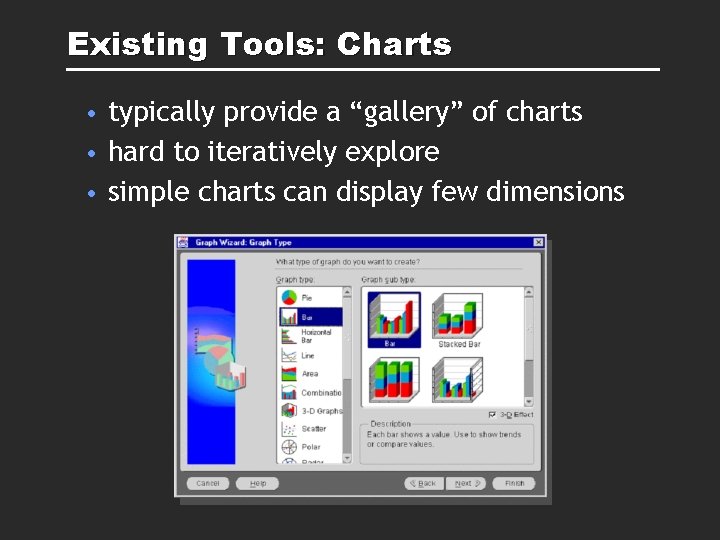
Existing Tools: Charts • typically provide a “gallery” of charts • hard to iteratively explore • simple charts can display few dimensions
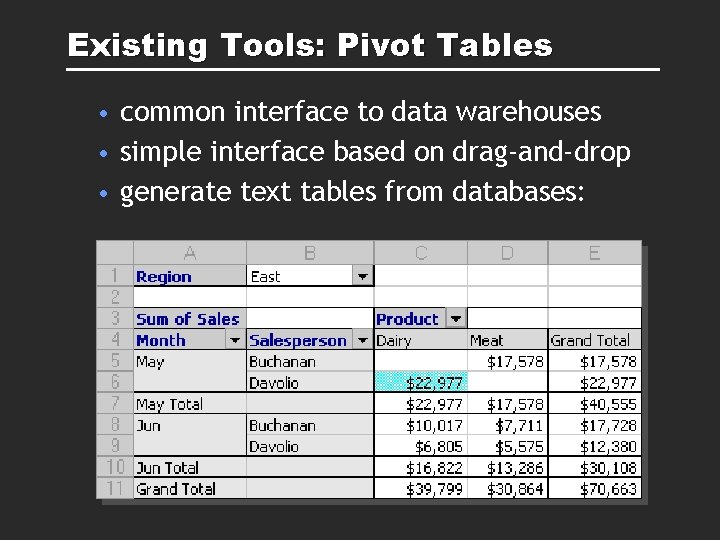
Existing Tools: Pivot Tables • common interface to data warehouses • simple interface based on drag-and-drop • generate text tables from databases:
Polaris: Extending Pivot Tables • generate rich table-based graphical displays rather than tables of text • single conceptual model for both graphs and tables • preserve ability to rapidly construct displays
Polaris Design Goals Two main design goals: § Interactive analysis and exploration versus static visualization § Simple, consistent interface
Design Goal: Analysis & Exploration § Want to extract meaning from data § Process of hypothesis, experiment, and discovery § Path of exploration is unpredictable
UI Requirements for Exploration § Data dense displays: display both many tuples & many dimensions § Multiple display types: different displays suited to different tasks § Exploratory interfaces: rapidly change data transformations and views
Design Goal: Simple, Consistent UI § Excel Pivot tables provide a simple interface for building text-based tables § Graphs require multiple steps: different interfaces and conceptual models § Want to unify tables, graphs, and database queries in one interface
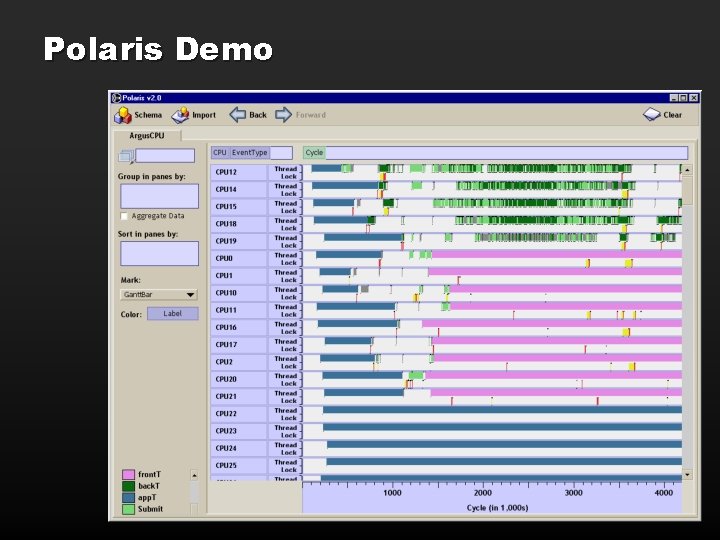
Polaris Demo
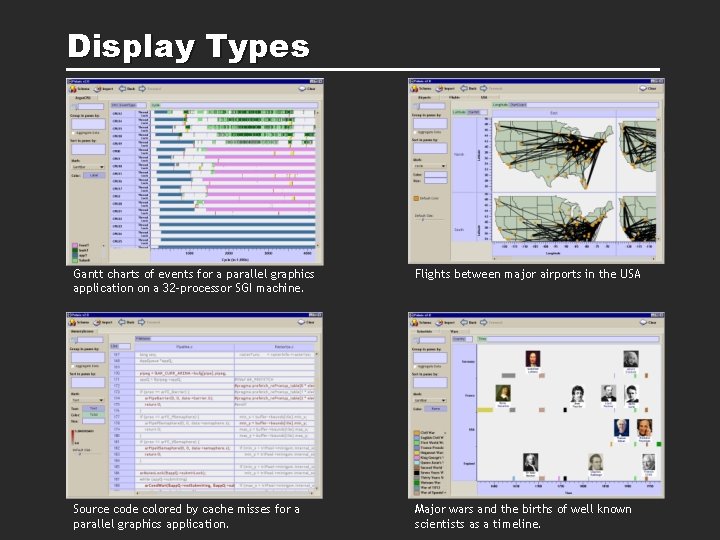
Display Types Gantt charts of events for a parallel graphics application on a 32 -processor SGI machine. Flights between major airports in the USA Source code colored by cache misses for a parallel graphics application. Major wars and the births of well known scientists as a timeline.
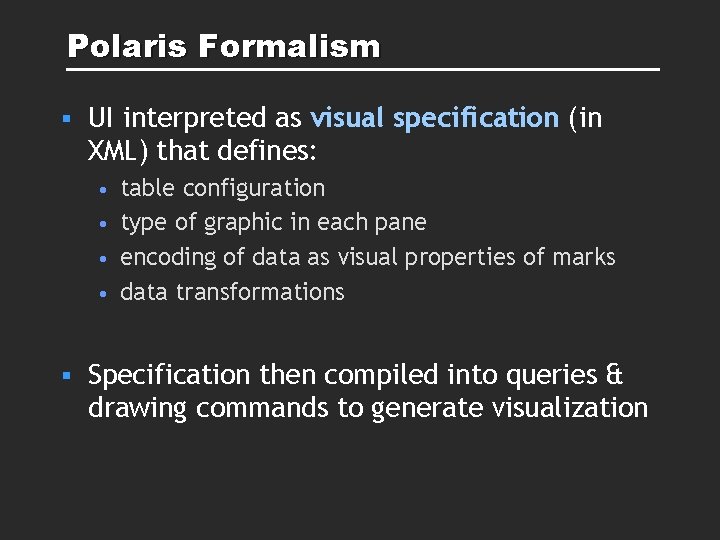
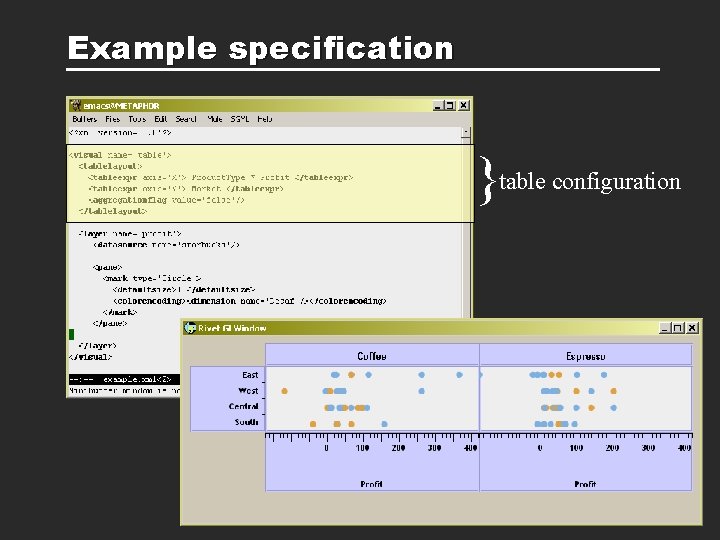
Polaris Formalism § UI interpreted as visual specification (in XML) that defines: • table configuration • type of graphic in each pane • encoding of data as visual properties of marks • data transformations § Specification then compiled into queries & drawing commands to generate visualization
Design Decision: Use a Formalism § Why a formalism? • unification: unify tables and graphs • expressiveness: build visualizations designers did not think of • interface simplicity: clearly defined semantics and operations • code simplicity: composable language versus monolithic objects • declarative: can state what, not how— allows for optimization, etc.
Example specification }table configuration
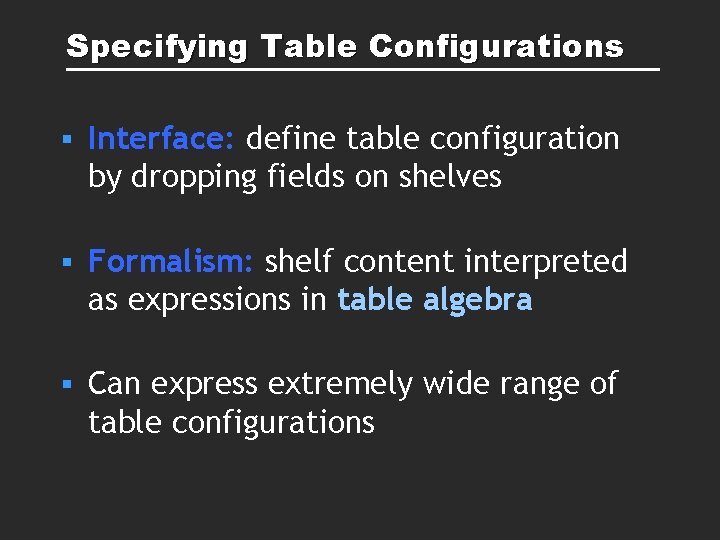
Specifying Table Configurations § Interface: define table configuration by dropping fields on shelves § Formalism: shelf content interpreted as expressions in table algebra § Can express extremely wide range of table configurations
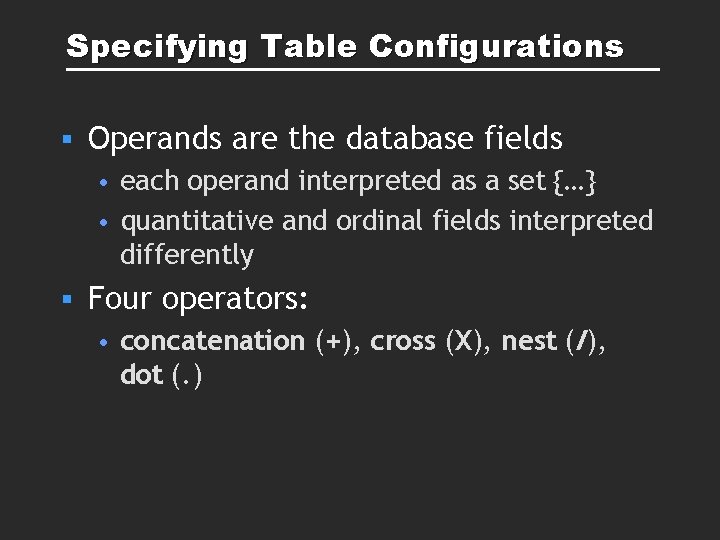
Specifying Table Configurations § Operands are the database fields • each operand interpreted as a set {…} • quantitative and ordinal fields interpreted differently § Four operators: • concatenation (+), cross (X), nest (/), dot (. )
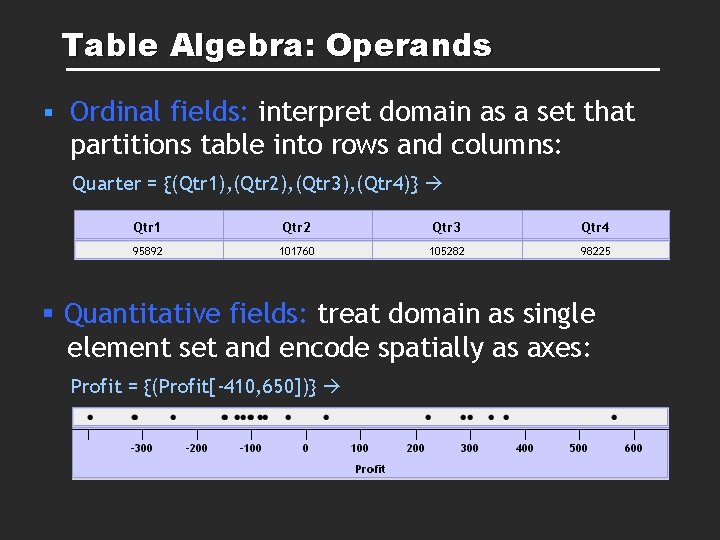
Table Algebra: Operands § Ordinal fields: interpret domain as a set that partitions table into rows and columns: Quarter = {(Qtr 1), (Qtr 2), (Qtr 3), (Qtr 4)} § Quantitative fields: treat domain as single element set and encode spatially as axes: Profit = {(Profit[-410, 650])}
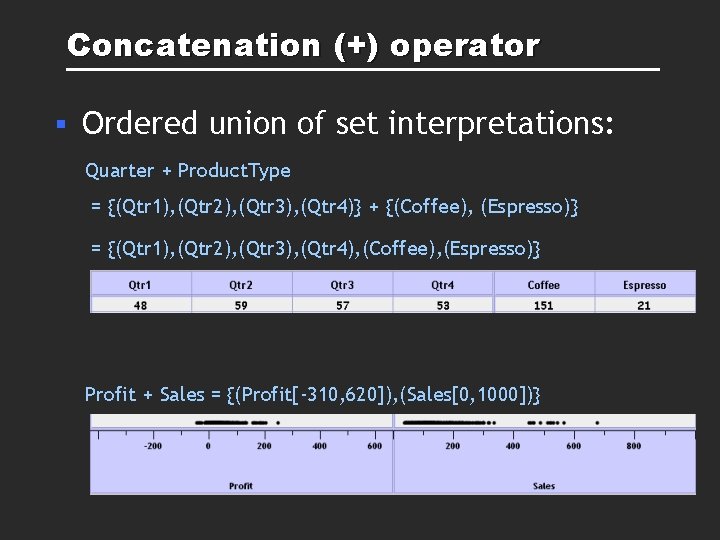
Concatenation (+) operator § Ordered union of set interpretations: Quarter + Product. Type = {(Qtr 1), (Qtr 2), (Qtr 3), (Qtr 4)} + {(Coffee), (Espresso)} = {(Qtr 1), (Qtr 2), (Qtr 3), (Qtr 4), (Coffee), (Espresso)} Profit + Sales = {(Profit[-310, 620]), (Sales[0, 1000])}
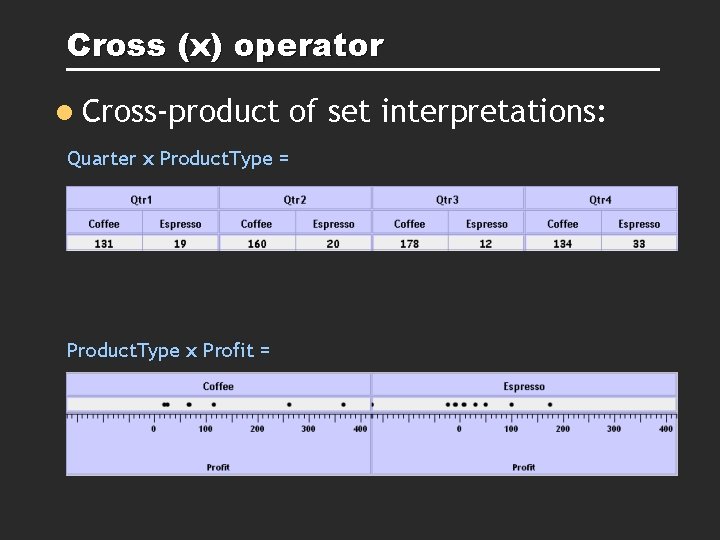
Cross (x) operator l Cross-product of set interpretations: Quarter x Product. Type = {(Qtr 1, Coffee), (Qtr 1, Tea), (Qtr 2, Coffee), (Qtr 2, Tea), (Qtr 3, Coffee), (Qtr 3, Tea), (Qtr 4, Coffee), (Qtr 4, Tea)} Product. Type x Profit =
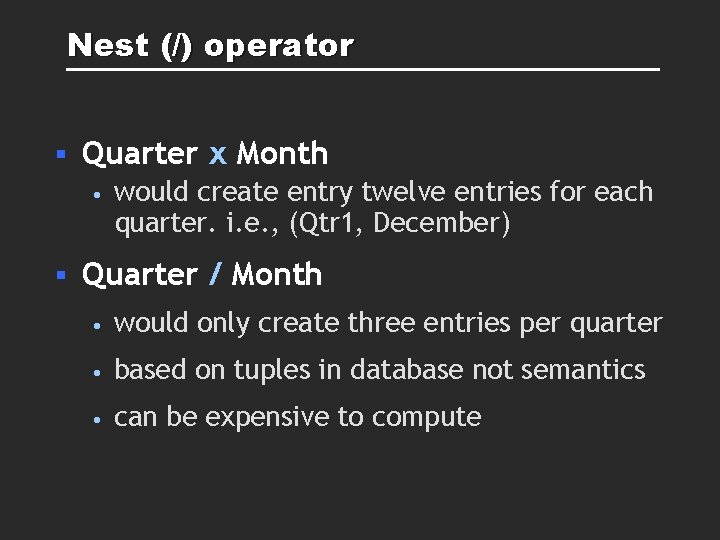
Nest (/) operator § Quarter x Month • § would create entry twelve entries for each quarter. i. e. , (Qtr 1, December) Quarter / Month • would only create three entries per quarter • based on tuples in database not semantics • can be expensive to compute
Dot (. ) operator: Hierarchies § Many data warehouses have hierarchical dimensions: • Time: Year, Month, Day • Location: Country, State, Region § Dot (. ) works like Nest (/) except it exploits the defined hierarchies • based on semantics not tuples in database § Demo
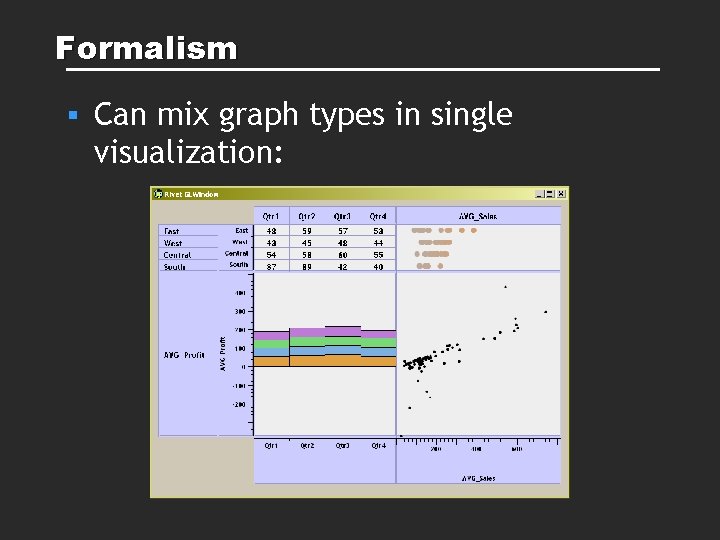
Formalism § Can mix graph types in single visualization:
Polaris Formalism § Remainder of formalism defined in papers*: • specification of different graph types • encoding of data as retinal properties of marks in graphs • data transformations • translation of visual specification into SQL queries * Relevant papers: Query, Analysis, and Visualization of Hierarchically Structured Data using Polaris Chris Stolte, Diane Tang and Pat Hanrahan Proceedings of the Eighth ACM SIGKDD International Conference on Knowledge Discovery and Data Mining, July 2002. Polaris: A System for Query, Analysis and Visualization of Multi-dimensional Relational Databases (extended paper) Chris Stolte, Diane Tang and Pat Hanrahan IEEE Transactions on Visualization and Computer Graphics, Vol. 8, No. 1, January 2002.
Generating Queries Database queries automatically generated from specification. § Multiple queries required if level-of-detail varies. § Algebraic manipulation can be used to determine minimal set of queries. § Current interpreters can generate SQL, MDX, or Rivet queries. §
Related Visualization Projects § Formalisms for Graphics • • • § Visual Exploration of Databases • § Wilkinson’s Grammar of Graphics Bertin’s Semiology of Graphics Mackinlay’s APT De. Vise, Visage, Data. Splash/Tioga-2 Table-based Visualizations • Table Lens, Spreadsheet for Visualization
Summary Exploratory visualization versus presentation § Multiple display types—different questions require different visualizations § Polaris: a novel interface for rapidly constructing table-based graphical displays from multi-dimensional relational databases § Formalisms: powerful declarative tool for specifying complex graphics and tables §