placeholder partner logo Energy Status quo of the


- Slides: 19

placeholder partner logo Energy Status quo of the South African wind energy sector A halting count-down to an imminent rocket launch Johan van den Berg SAWEA May 2012 www. german-renewable-energy. com

placeholder partner logo In summary: Wind in South Africa Wind power finally taking off First 10 MW took 14 years Next 634 MW will come in 12 months 9, 000 MW by 2030 Challenges remain but they seem manageable SAWEA co-ordinating and leading the industry

placeholder partner logo South Africa at a glance About 50 million people GDP USD 550 billion 2011 growing at 3%+ - JSE 18 th globally In top 30 economies world-wide “Two worlds” – 1 st and 3 rd – unemployment 20%+ “Gate” to sub-Saharan Africa Historically a country highly efficient at technological innovation

placeholder partner logo Legal system Constitutional democracy Extremely modern and progressive constitution – occasional tension with often conservative and diverse values of large parts of population Traditionally very strong and sophisticated, (common law) Roman-Dutch/English legal system Independent Constitutional Court English the lingua franca – in the same time zone as EU – easy to work with for Europeans

placeholder partner logo Renewable Energy – the long and winding road Date Event Significance 1960 - 1990 South Africa builds a fleet (35, 000 MW) of large, coal fired These are now all amortised (paid) and only maintenance needs to be paid, (fossil fuel based) electricity generation plants. making electricity cheap. They are however highly polluting and nearing end of life 1988 Concern about climate change gets momentum Fossil fuels are recognised to endanger human well-being in the long run 1990 IPCC brings out a sobering scientific report Negotiations start towards an international convention on Climate Change 1992 UNFCCC signed South Africa is a signatory and acquires international obligations including the limitation of fossil fuel use and promotion on renewable energy 1995 It becomes clear that new generation capacity is needed to keep The pattern of electricity shortfalls is set track with SA’s increased energy demand – response was slow 1995 IPCC’s second report indicates the climate news is worse than General recognition that a binding international convention (the KP) needed expected to follow UNFCCC 1997 KP signed (enters force in 2003) International community undertakes to take real steps towards addressing climate change 1985 - 2005 Eskom makes good profits and Government as its shareholder The pattern of Eskom’s increasingly burdened balance sheet is set pays it out in dividends without keeping a reserve for the new build programme 1998 Darling National Demonstration Wind Farm starts development First tentative steps towards IPP wind energy – however no system in place and by 2001 gets “demonstration” support from the erstwhile to make it competitive with fossil fuel energy which in Eskom’s case is Minister of Energy much cheaper Dec 1998 White Paper on Energy launched A break from the Eskom monopoly is envisioned with a mixed basket of energy sources and a mixed basket of energy suppliers (including Independent Power Producers)

placeholder partner logo Renewable Energy – some progression 2003 South Africa hosts the World Wind Energy Conference and the White Paper on Renewable Energy is launched Principles in Energy White Paper affirmed and target of 10, 000 GWh’s of RE production by 2013 is set (this will now be very difficult to achieve) 2003 -2007 Virtually no progress is made with the RE target as per the RE White Paper RE stalls in the county 2007 - 2011 Various competitive bid processes launched to procure electricity from private sector fail totally or partially – the PNCP, MTPPP, the Peaker programme and the base load IPP programme The energy investment community becomes very sceptical about South Africa. 2007 NERSA consultants publish inception report for a REFIT scheme Potential REFIT raises hope in the RE sector 2008 Darling National Demonstration Wind Farm is commissioned after 11 years of battling against the odds and two High Court approaches but fails to remove the barriers to RE energy The message is sent that doing business in the sector in SA is very difficult 2009 NERSA approves REFIT for certain RE technologies including Solar PV, Solar Thermal and Wind. Investment starts flowing very quickly, international companies invest in SA and employ local people. EIA’s start. Wikipedia mentions the SA REFIT as attractive The RE Industry spends ZAR 500 million + in the belief that the country will have a REFIT scheme Feb 2010 NERSA approves the budget (“MYPD 2”) that includes renewable energy Developers get comfort that REFIT procurement is imminent

placeholder partner logo Renewable Energy – to the present April 2010 NERSA publishes the draft selection criteria “scorecard” for REFIT and holds public hearings to discuss same Not all projects commissioned will get the REFIT. There will be tender process and only some will succeed. Developers gear their projects to fit with the draft selection criteria May 2011 IRP 2010 is approved as SA’s energy master plan 2010 – 2030 that will include a vast contribution from renewables costing ZAR 350 billion plus – wind about 9, 000 MW REFIT is replaced by “REBID” The large RE component (9, 000 MW wind) implies ensuring very large private sector investment and very rapid skills development Nov 2011 First bid round closes – over ZAR 100 million is posted in bid bonds. About 52 applications Lift-off in sight? Nov 2011 Preferred bidders announced for Round 1 – for wind 8 totalling 634 MW presumably in price ranges of 10 – 11 euro cents/k. Wh Critical mass finally seems possible – bid process ran smoothly which created investor confidence 21 May 2012 Preferred bidders announced for Round 2 – for wind perhaps another 600 MW System is becoming known and understood, procurement is starting to look like a rolling programme 30 June - 10 July 2012 Financial close Round 1 and soil turning “SA GW’s into action!” August 2011 A different procurement method than anticipated but with a much larger ambition

placeholder partner logo Wind resource SAWEP project – shows excellent wind resource (Andre Otto‘s presentation) Can easily support the IRP 2010 Large land mass leads to 25% + capacity credit

SA: ELECTRICITY SUPPLY AND DEMAND • The problems of 2008 have not gone away • Economic stagnation merely hid it • First unit at Medupi delayed until Oct 2013 • The open cycle gas turbines are running far over budget at exorbitant cost • Coal plants have not all received scheduled maintenance • In 2008 the cost of not having power was € 7/k. Wh

ESKOM ADEQUACY REPORT WEEK 41 (2011) Week start MW prediction MW available capacity less Operating reserve and unplanned outage 14 Nov 21 Nov 28 Nov 5 Dec 12 Dec 19 Dec 26 Dec 2 Jan 9 Jan 16 Jan 32, 880 32, 830 32, 588 32, 811 32, 073 30, 296 28, 391 29, 853 31, 121 31, 677 38, 651 37, 588 38, 565 37, 415 37, 680 36, 720 36, 344 34, 964 34, 934 35, 809 32, 251 31, 188 32, 165 31, 015 31, 280 30, 320 29, 944 28, 564 28, 534 29, 409 Capacity reserve margin (%) Operational surplus/defic it (MW) -1, 95 -5, 26 -1, 32 -4, 82 -2, 54 0, 08 5, 19 -4, 51 -9, 07 -7, 71 -629 -1642 -423 -1496 -795 24 1553 -1289 -2587 -2268

placeholder partner logo Structure of electricity sector in SA - 1 Eskom is a government owned and historically is a vertically integrated monopoly (generation, transmission, distribution) Prices controlled by independent National Energy Regulator (NERSA) – traditionally very low but rising (presently about € 5 -6 c/k. Wh wholesale) Minerals-energy complex” plays important role Municipalities funded through profits in electricity SA has highly carbon intensive economy

placeholder partner logo Structure of electricity sector in SA - 2 Journey to opening up the sector has been slow and painful Present proliferation of IPP‘s and ISMO will change this considerably

placeholder partner logo Regulatory framework: Some prominent issues EIA‘s (biodiversity, birds, bats, noise; visual impact; heritage; other animal life; tourism) Radar Agricultural land Water affairs Transport legislation and regulations The regime is converging to logic

THE IRP 2010 • Integrated Resource Plan 2010 (www. doeirp. co. za/content/IRP 2010_2030_Final_Report_20110325) • It is the 20 year blueprint/master plan for energy in the country • Extensively work-shopped and modelled • Adjusted from lowest cost model for various factors including policy • • Readjusted every 2 years due to changed circumstances

THE IRP 2010 cont

placeholder partner logo Procument framework Competitive bid system for allocated MW‘s 70% price 30% other - socio economic development - local ownership, local content, job creation, community development etcetera Process requires extensive documentation (7 x 5, 000 pages) and implies significant cost (€ 200 k – 400 k in bid preparation) Game for big and sophisticated players

RE “lift-off” • In ten years SA stumbled from 0 – 10 MW of wind power installed and from 0 – 0 MW of grid connected, IPP solar power PV installed • If all goes well, in 36 months we might have 2, 000 MW’s of wind and 1, 000 MW of solar PV installed plus some “other” • This would move SA into a significant position in the global order http: //en. wikipedia. org/wiki/Solar_power_by_country and http: //en. wikipedia. org/wiki/Wind_power_by_country • RE would then be a significant new sector in the SA economy

SA’S POSSIBLE PLACE IN 2015 RE GLOBAL PECKING ORDER

“COST OF RENEWABLES” VS EXTERNALITIES OF COAL POWER USE – HOW MUCH CAN IT BE PER KWH FOR KUSILE? (University Pretoria)
 Agenda placeholder
 Placeholder in icd 10
 Status quo analysis
 Status quo pricing objective
 Sales oriented pricing objectives
 Status quo
 Status quo analysis
 Judith hess wright
 Status quo skimming
 Resonate solutions
 Knx partner logo
 Azure partner logo
 Energy energy transfer and general energy analysis
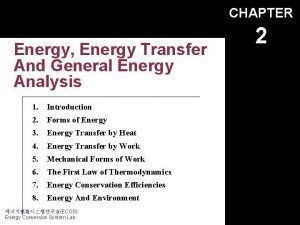
 Energy energy transfer and general energy analysis
 Hát kết hợp bộ gõ cơ thể
 Ng-html
 Bổ thể
 Tỉ lệ cơ thể trẻ em
 Voi kéo gỗ như thế nào
 Tư thế worm breton là gì


