Performance Lecture 17 Monitoring Tools Parallel Computer Architecture

- Slides: 48

Performance Lecture 17: Monitoring Tools Parallel Computer Architecture and Programming CMU 15 -418/15 -618, Spring 2019

Scenario ▪ Student walks into office hours and says, “My code is slow / uses lots of memory / is SIGKILLED. I implemented X, Y, and Z. Are those good? What should I do next? ” ▪ It depends. CMU 15 -418/618, Spring 2019

What is my program doing? ▪ Measurements are more valuable than insights - Insights are best formed from measurements! ▪ We’re Computer Scientists - We can write programs to analyze programs CMU 15 -418/618, Spring 2019

Note about Examples ▪ The example programs in today’s lecture are from Spring 2016 Assignment 3 - Open. MP-based graph processing workload (para. Graph) - Millions to tens of millions of nodes - Code written for the GHC machines and Xeon Phi CMU 15 -418/618, Spring 2019

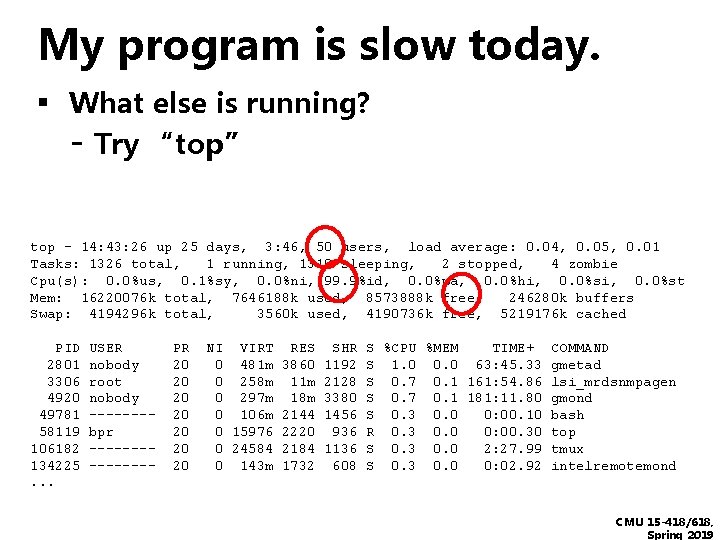
My program is slow today. ▪ What else is running? - Try “top” top - 14: 43: 26 up 25 days, 3: 46, 50 users, load average: 0. 04, 0. 05, 0. 01 Tasks: 1326 total, 1 running, 1319 sleeping, 2 stopped, 4 zombie Cpu(s): 0. 0%us, 0. 1%sy, 0. 0%ni, 99. 9%id, 0. 0%wa, 0. 0%hi, 0. 0%st Mem: 16220076 k total, 7646188 k used, 8573888 k free, 246280 k buffers Swap: 4194296 k total, 3560 k used, 4190736 k free, 5219176 k cached PID 2801 3306 4920 49781 58119 106182 134225. . . USER nobody root nobody -------bpr -------- PR 20 20 NI VIRT RES 0 481 m 3860 0 258 m 11 m 0 297 m 18 m 0 106 m 2144 0 15976 2220 0 24584 2184 0 143 m 1732 SHR 1192 2128 3380 1456 936 1136 608 S %CPU %MEM TIME+ COMMAND S 1. 0 0. 0 63: 45. 33 gmetad S 0. 7 0. 1 161: 54. 86 lsi_mrdsnmpagen S 0. 7 0. 1 181: 11. 80 gmond S 0. 3 0. 0 0: 00. 10 bash R 0. 3 0. 0 0: 00. 30 top S 0. 3 0. 0 2: 27. 99 tmux S 0. 3 0. 0 0: 02. 92 intelremotemond CMU 15 -418/618, Spring 2019

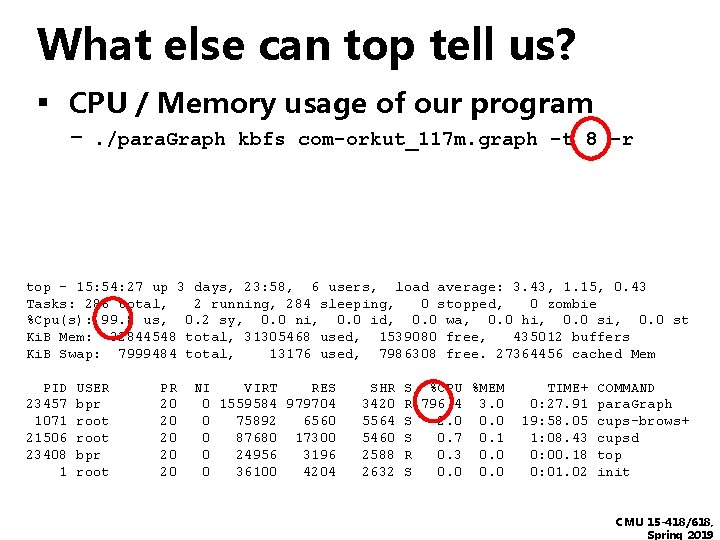
What else can top tell us? ▪ CPU / Memory usage of our program - . /para. Graph kbfs com-orkut_117 m. graph -t 8 -r top - 15: 54: 27 up 3 days, 23: 58, 6 users, load average: 3. 43, 1. 15, 0. 43 Tasks: 286 total, 2 running, 284 sleeping, 0 stopped, 0 zombie %Cpu(s): 99. 8 us, 0. 2 sy, 0. 0 ni, 0. 0 id, 0. 0 wa, 0. 0 hi, 0. 0 st Ki. B Mem: 32844548 total, 31305468 used, 1539080 free, 435012 buffers Ki. B Swap: 7999484 total, 13176 used, 7986308 free. 27364456 cached Mem PID 23457 1071 21506 23408 1 USER bpr root PR 20 20 20 NI VIRT RES 0 1559584 979704 0 75892 6560 0 87680 17300 0 24956 3196 0 36100 4204 SHR 3420 5564 5460 2588 2632 S %CPU %MEM R 796. 4 3. 0 S 2. 0 0. 0 S 0. 7 0. 1 R 0. 3 0. 0 S 0. 0 TIME+ 0: 27. 91 19: 58. 05 1: 08. 43 0: 00. 18 0: 01. 02 COMMAND para. Graph cups-brows+ cupsd top init CMU 15 -418/618, Spring 2019

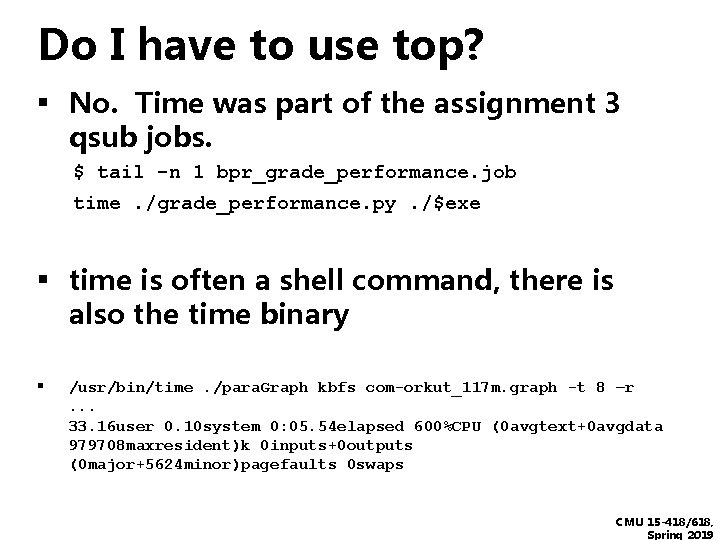
Do I have to use top? ▪ No. Time was part of the assignment 3 qsub jobs. $ tail -n 1 bpr_grade_performance. job time. /grade_performance. py. /$exe ▪ time is often a shell command, there is also the time binary ▪ /usr/bin/time. /para. Graph kbfs com-orkut_117 m. graph -t 8 –r. . . 33. 16 user 0. 10 system 0: 05. 54 elapsed 600%CPU (0 avgtext+0 avgdata 979708 maxresident)k 0 inputs+0 outputs (0 major+5624 minor)pagefaults 0 swaps CMU 15 -418/618, Spring 2019

But why is it slow? ▪ Where is the time spent? - Put timing statements around probable - issues Print results ▪ OR - Use a tool to insert timing statements CMU 15 -418/618, Spring 2019

Program Instrumentation ▪ When to inject the instrumentation? - When the program is compiled. - When the program is run. CMU 15 -418/618, Spring 2019

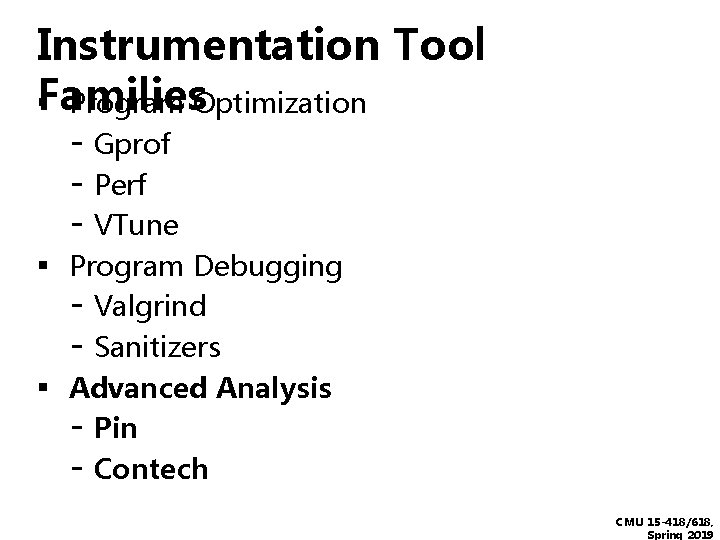
Instrumentation Tool Families ▪ Program Optimization - Gprof - Perf - VTune ▪ Program Debugging - Valgrind - Sanitizers ▪ Advanced Analysis - Pin - Contech CMU 15 -418/618, Spring 2019

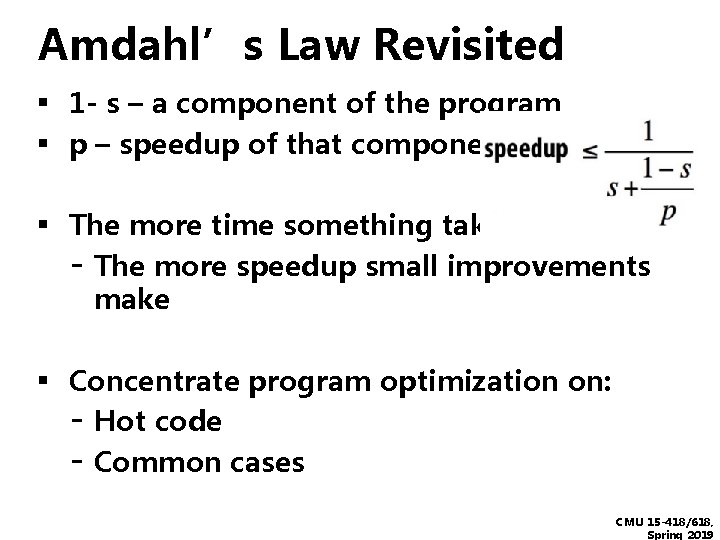
Amdahl’s Law Revisited ▪ 1 - s – a component of the program ▪ p – speedup of that component ▪ The more time something takes - The more speedup small improvements make ▪ Concentrate program optimization on: - Hot code - Common cases CMU 15 -418/618, Spring 2019

GProf ▪ Enabled with “-pg” compiler flag ▪ Places a call into every function - Calls record the call graph - Calls record time elapsed ▪ Run the program. ▪ Run gprof <prog name> CMU 15 -418/618, Spring 2019

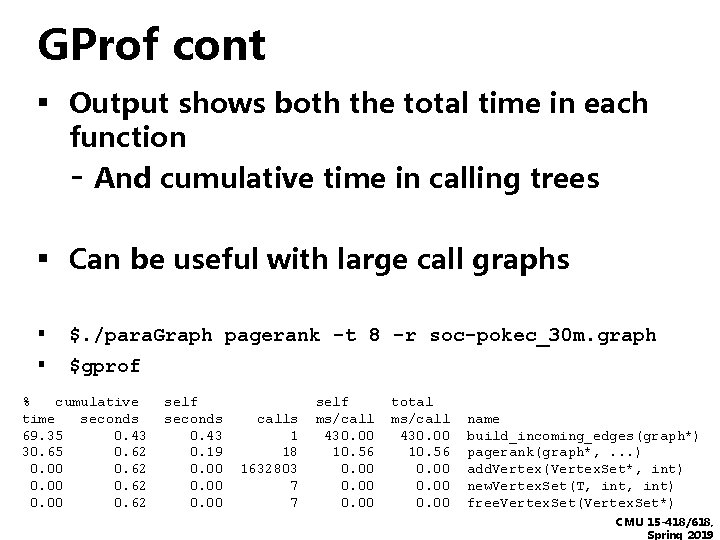
GProf cont ▪ Output shows both the total time in each function - And cumulative time in calling trees ▪ Can be useful with large call graphs ▪ $. /para. Graph pagerank -t 8 -r soc-pokec_30 m. graph ▪ $gprof % cumulative time seconds 69. 35 0. 43 30. 65 0. 62 0. 00 0. 62 self seconds 0. 43 0. 19 0. 00 calls 1 18 1632803 7 7 self ms/call 430. 00 10. 56 0. 00 total ms/call 430. 00 10. 56 0. 00 name build_incoming_edges(graph*) pagerank(graph*, . . . ) add. Vertex(Vertex. Set*, int) new. Vertex. Set(T, int) free. Vertex. Set(Vertex. Set*) CMU 15 -418/618, Spring 2019

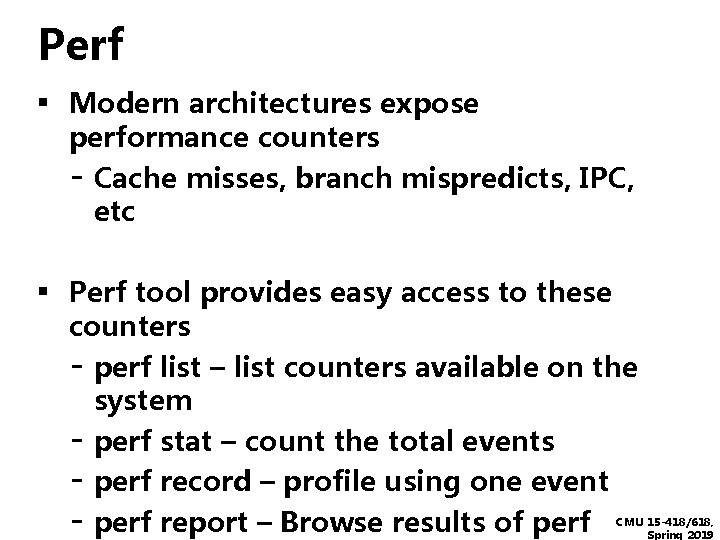
Perf ▪ Modern architectures expose performance counters - Cache misses, branch mispredicts, IPC, etc ▪ Perf tool provides easy access to these counters - perf list – list counters available on the system - perf stat – count the total events - perf record – profile using one event - perf report – Browse results of perf CMU 15 -418/618, Spring 2019

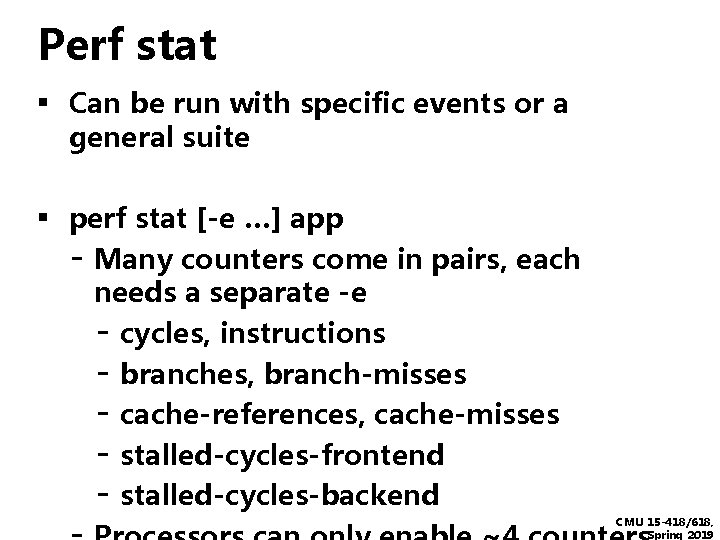
Perf stat ▪ Can be run with specific events or a general suite ▪ perf stat [-e …] app - Many counters come in pairs, each needs a separate -e - cycles, instructions - branches, branch-misses - cache-references, cache-misses - stalled-cycles-frontend - stalled-cycles-backend CMU 15 -418/618, Spring 2019

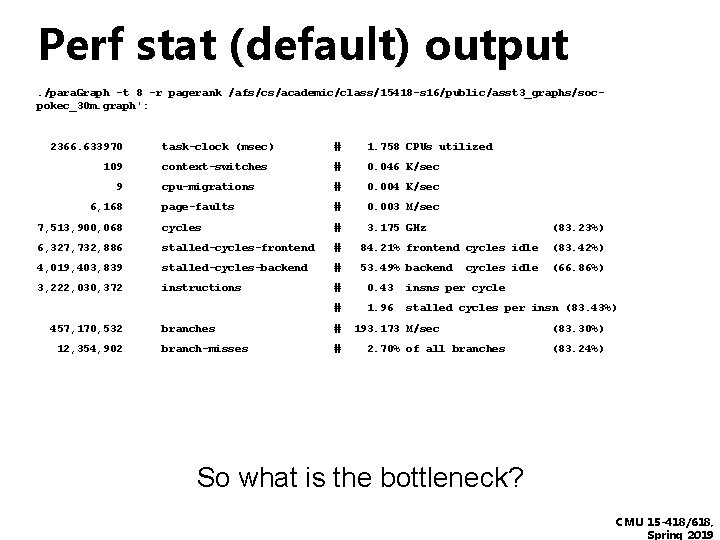
Perf stat (default) output. /para. Graph -t 8 -r pagerank /afs/cs/academic/class/15418 -s 16/public/asst 3_graphs/socpokec_30 m. graph': 2366. 633970 task-clock (msec) # 1. 758 CPUs utilized context-switches # 0. 046 K/sec cpu-migrations # 0. 004 K/sec page-faults # 0. 003 M/sec 7, 513, 900, 068 cycles # 3. 175 GHz 6, 327, 732, 886 stalled-cycles-frontend # 84. 21% frontend cycles idle (83. 42%) 4, 019, 403, 839 stalled-cycles-backend # 53. 49% backend (66. 86%) 3, 222, 030, 372 instructions # 0. 43 insns per cycle # 1. 96 stalled cycles per insn (83. 43%) 109 9 6, 168 457, 170, 532 12, 354, 902 branches # branch-misses # (83. 23%) cycles idle 193. 173 M/sec 2. 70% of all branches (83. 30%) (83. 24%) So what is the bottleneck? CMU 15 -418/618, Spring 2019

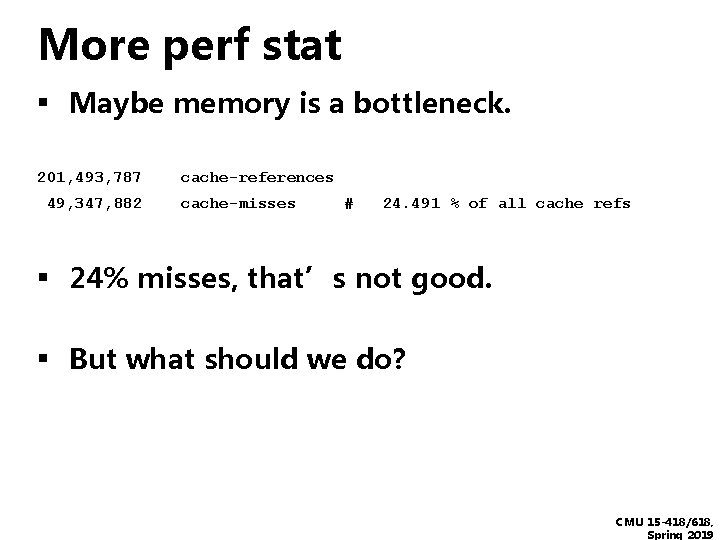
More perf stat ▪ Maybe memory is a bottleneck. 201, 493, 787 49, 347, 882 cache-references cache-misses # 24. 491 % of all cache refs ▪ 24% misses, that’s not good. ▪ But what should we do? CMU 15 -418/618, Spring 2019

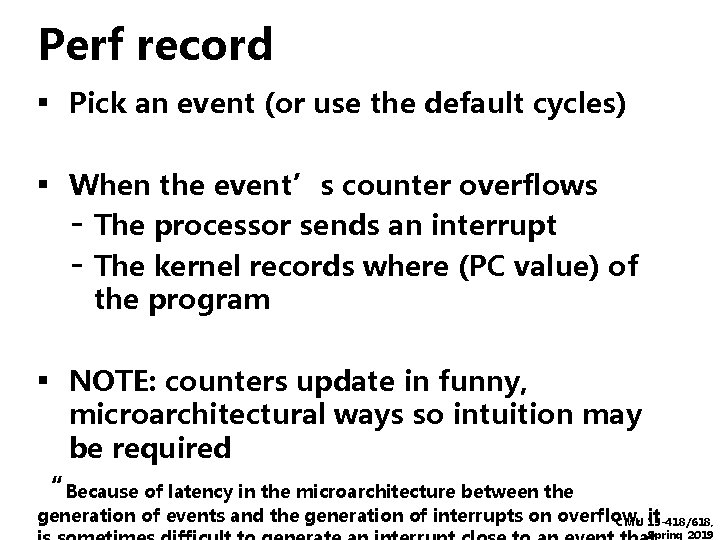
Perf record ▪ Pick an event (or use the default cycles) ▪ When the event’s counter overflows - The processor sends an interrupt - The kernel records where (PC value) of the program ▪ NOTE: counters update in funny, microarchitectural ways so intuition may be required “Because of latency in the microarchitecture between the generation of events and the generation of interrupts on overflow, it CMU 15 -418/618, Spring 2019

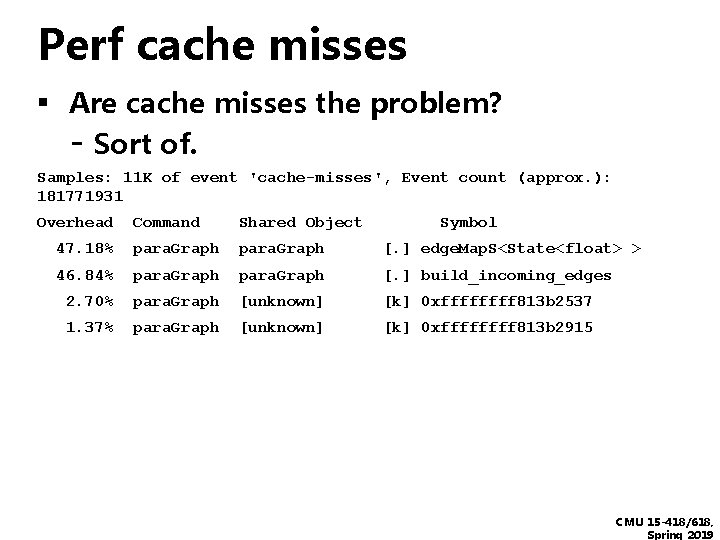
Perf cache misses ▪ Are cache misses the problem? - Sort of. Samples: 11 K of event 'cache-misses', Event count (approx. ): 181771931 Overhead Command Shared Object Symbol 47. 18% para. Graph [. ] edge. Map. S<State<float> > 46. 84% para. Graph [. ] build_incoming_edges 2. 70% para. Graph [unknown] [k] 0 xffff 813 b 2537 1. 37% para. Graph [unknown] [k] 0 xffff 813 b 2915 CMU 15 -418/618, Spring 2019

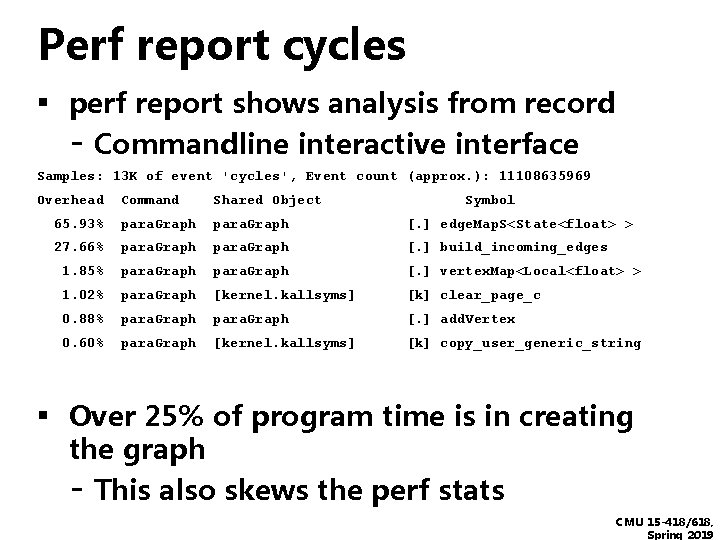
Perf report cycles ▪ perf report shows analysis from record - Commandline interactive interface Samples: 13 K of event 'cycles', Event count (approx. ): 11108635969 Overhead Command Shared Object Symbol 65. 93% para. Graph [. ] edge. Map. S<State<float> > 27. 66% para. Graph [. ] build_incoming_edges 1. 85% para. Graph [. ] vertex. Map<Local<float> > 1. 02% para. Graph [kernel. kallsyms] [k] clear_page_c 0. 88% para. Graph [. ] add. Vertex 0. 60% para. Graph [kernel. kallsyms] [k] copy_user_generic_string ▪ Over 25% of program time is in creating the graph - This also skews the perf stats CMU 15 -418/618, Spring 2019

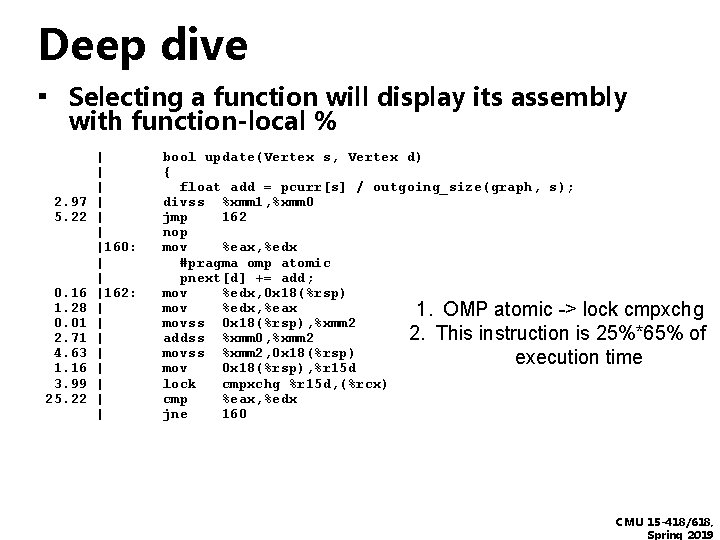
Deep dive ▪ Selecting a function will display its assembly with function-local % 2. 97 5. 22 0. 16 1. 28 0. 01 2. 71 4. 63 1. 16 3. 99 25. 22 | | | |160: | | |162: | | | | bool update(Vertex s, Vertex d) { float add = pcurr[s] / outgoing_size(graph, s); divss %xmm 1, %xmm 0 jmp 162 nop mov %eax, %edx #pragma omp atomic pnext[d] += add; mov %edx, 0 x 18(%rsp) mov %edx, %eax 1. OMP atomic -> lock cmpxchg movss 0 x 18(%rsp), %xmm 2 2. This instruction is 25%*65% of addss %xmm 0, %xmm 2 movss %xmm 2, 0 x 18(%rsp) execution time mov 0 x 18(%rsp), %r 15 d lock cmpxchg %r 15 d, (%rcx) cmp %eax, %edx jne 160 CMU 15 -418/618, Spring 2019

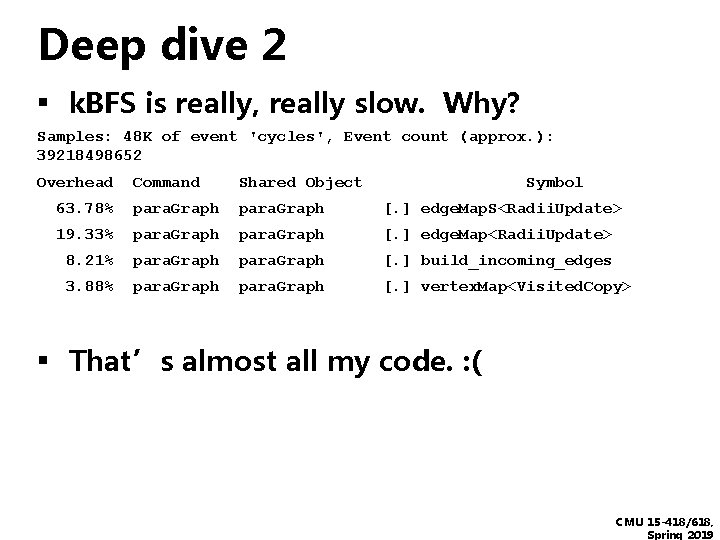
Deep dive 2 ▪ k. BFS is really, really slow. Why? Samples: 48 K of event 'cycles', Event count (approx. ): 39218498652 Overhead Command Shared Object Symbol 63. 78% para. Graph [. ] edge. Map. S<Radii. Update> 19. 33% para. Graph [. ] edge. Map<Radii. Update> 8. 21% para. Graph [. ] build_incoming_edges 3. 88% para. Graph [. ] vertex. Map<Visited. Copy> ▪ That’s almost all my code. : ( CMU 15 -418/618, Spring 2019

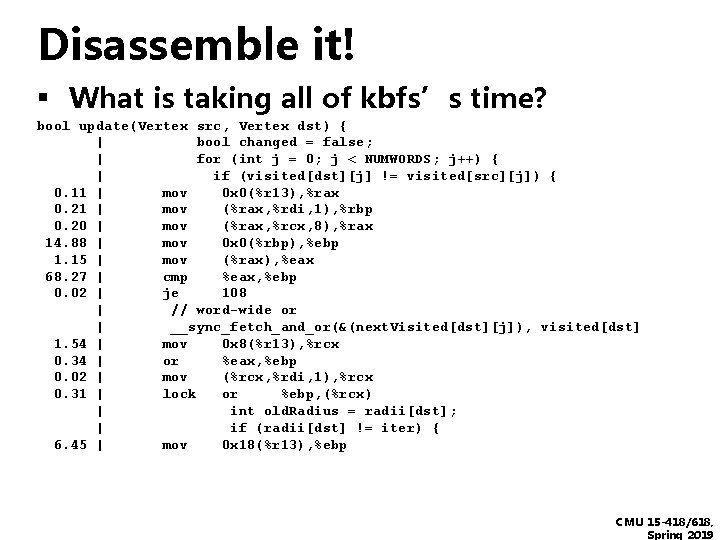
Disassemble it! ▪ What is taking all of kbfs’s time? bool update(Vertex src, Vertex dst) { | bool changed = false; | for (int j = 0; j < NUMWORDS; j++) { | if (visited[dst][j] != visited[src][j]) { 0. 11 | mov 0 x 0(%r 13), %rax 0. 21 | mov (%rax, %rdi, 1), %rbp 0. 20 | mov (%rax, %rcx, 8), %rax 14. 88 | mov 0 x 0(%rbp), %ebp 1. 15 | mov (%rax), %eax 68. 27 | cmp %eax, %ebp 0. 02 | je 108 | // word-wide or | __sync_fetch_and_or(&(next. Visited[dst][j]), visited[dst] 1. 54 | mov 0 x 8(%r 13), %rcx 0. 34 | or %eax, %ebp 0. 02 | mov (%rcx, %rdi, 1), %rcx 0. 31 | lock or %ebp, (%rcx) | int old. Radius = radii[dst]; | if (radii[dst] != iter) { 6. 45 | mov 0 x 18(%r 13), %ebp CMU 15 -418/618, Spring 2019

VTune ▪ Part of Intel’s Parallel Studio XE - Requires (free student) license from Intel ▪ Similar to perf - Also includes analysis across related counters CMU 15 -418/618, Spring 2019

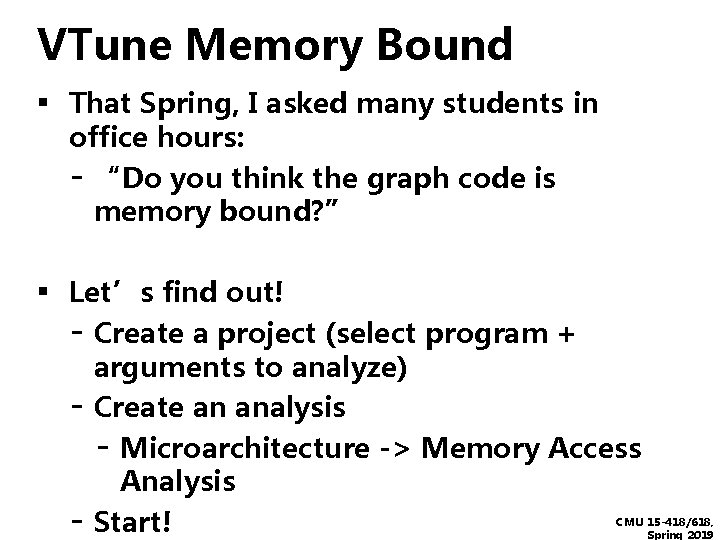
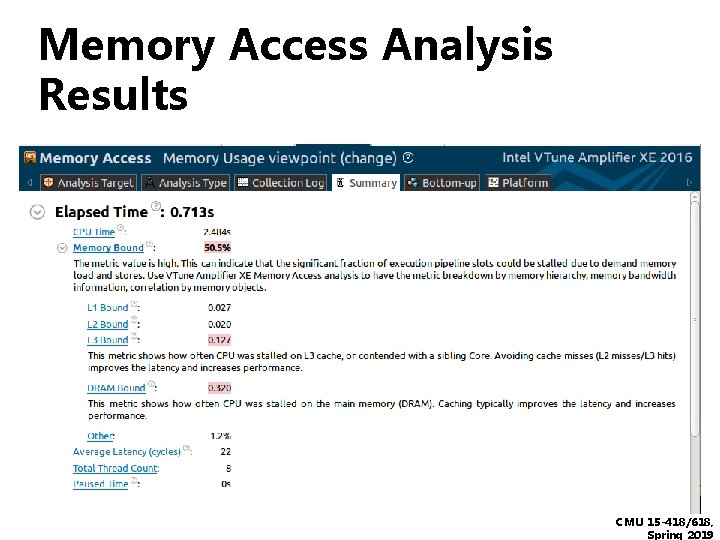
VTune Memory Bound ▪ That Spring, I asked many students in office hours: - “Do you think the graph code is memory bound? ” ▪ Let’s find out! - Create a project (select program + - arguments to analyze) Create an analysis - Microarchitecture -> Memory Access Analysis Start! CMU 15 -418/618, Spring 2019

Memory Access Analysis Results CMU 15 -418/618, Spring 2019

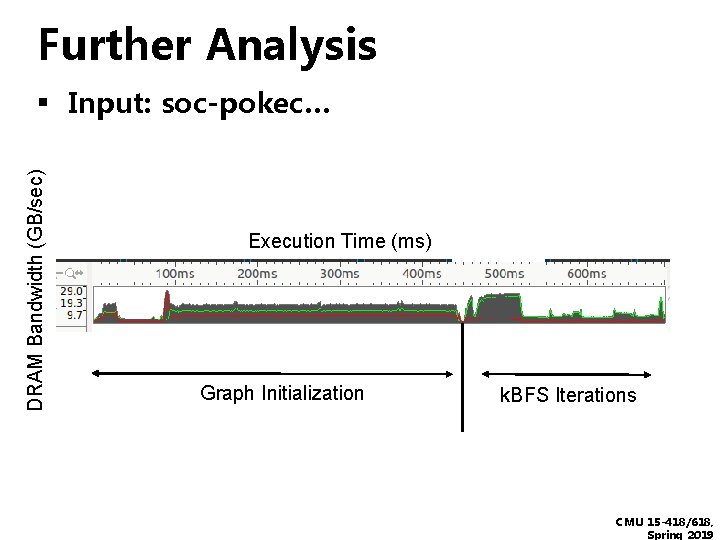
Further Analysis DRAM Bandwidth (GB/sec) ▪ Input: soc-pokec… Execution Time (ms) Graph Initialization k. BFS Iterations CMU 15 -418/618, Spring 2019

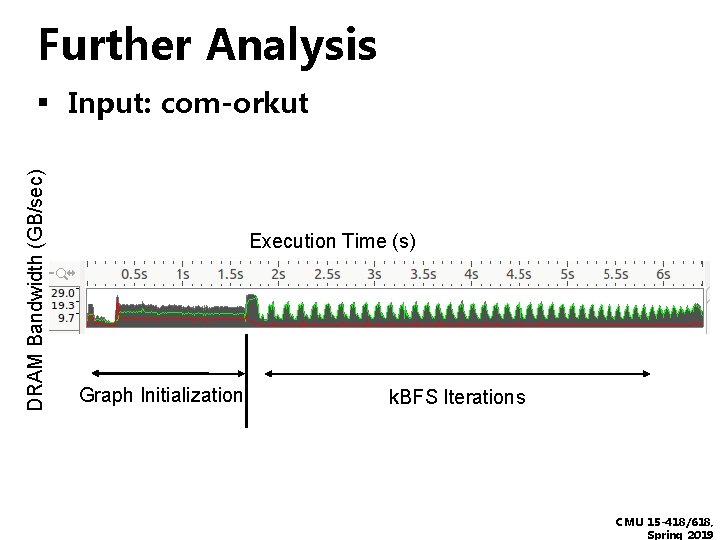
Further Analysis DRAM Bandwidth (GB/sec) ▪ Input: com-orkut Execution Time (s) Graph Initialization k. BFS Iterations CMU 15 -418/618, Spring 2019

Instrumentation Tool Families ▪ Program Optimization - Gprof - Perf - VTune ▪ Program Debugging - Valgrind - Sanitizers ▪ Advanced Analysis - Pin - Contech CMU 15 -418/618, Spring 2019

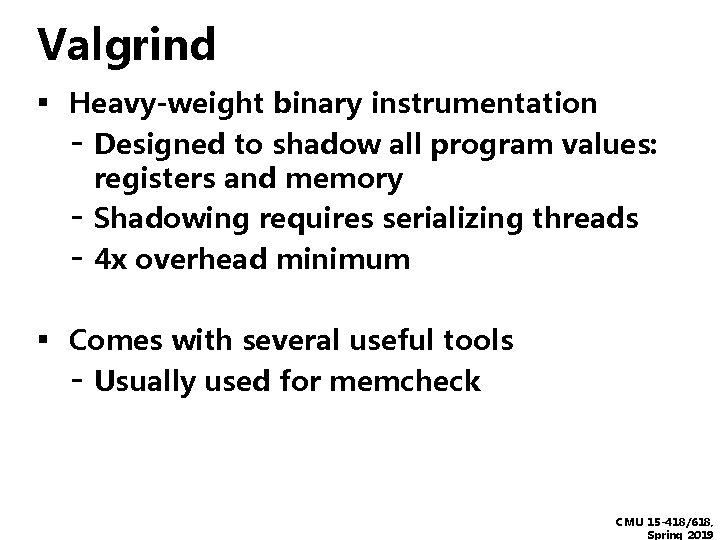
Valgrind ▪ Heavy-weight binary instrumentation - Designed to shadow all program values: - registers and memory Shadowing requires serializing threads 4 x overhead minimum ▪ Comes with several useful tools - Usually used for memcheck CMU 15 -418/618, Spring 2019

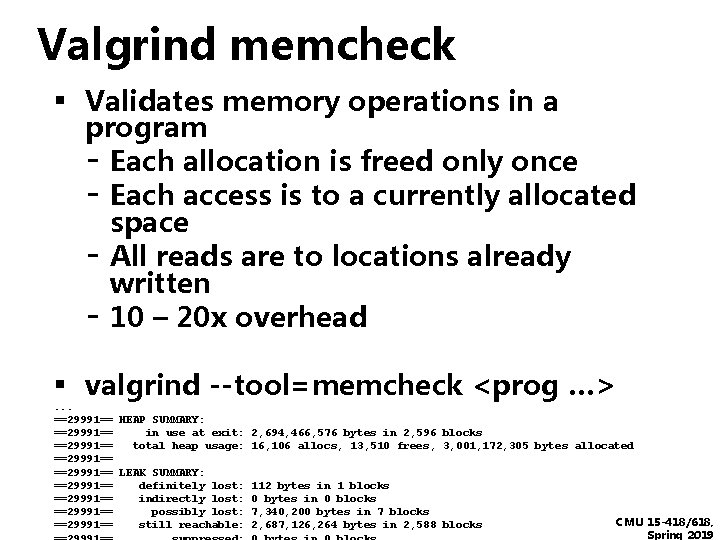
Valgrind memcheck ▪ Validates memory operations in a program - Each allocation is freed only once - Each access is to a currently allocated space - All reads are to locations already written - 10 – 20 x overhead ▪ valgrind --tool=memcheck <prog …>. . . ==29991== HEAP SUMMARY: ==29991== in use at exit: ==29991== total heap usage: ==29991== LEAK SUMMARY: ==29991== definitely lost: ==29991== indirectly lost: ==29991== possibly lost: ==29991== still reachable: 2, 694, 466, 576 bytes in 2, 596 blocks 16, 106 allocs, 13, 510 frees, 3, 001, 172, 305 bytes allocated 112 bytes in 1 blocks 0 bytes in 0 blocks 7, 340, 200 bytes in 7 blocks 2, 687, 126, 264 bytes in 2, 588 blocks CMU 15 -418/618, Spring 2019

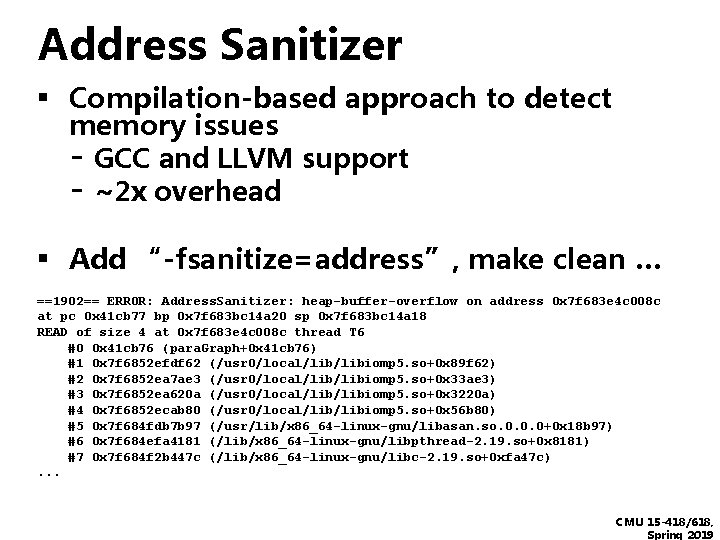
Address Sanitizer ▪ Compilation-based approach to detect memory issues - GCC and LLVM support - ~2 x overhead ▪ Add “-fsanitize=address”, make clean … ==1902== ERROR: Address. Sanitizer: heap-buffer-overflow on address 0 x 7 f 683 e 4 c 008 c at pc 0 x 41 cb 77 bp 0 x 7 f 683 bc 14 a 20 sp 0 x 7 f 683 bc 14 a 18 READ of size 4 at 0 x 7 f 683 e 4 c 008 c thread T 6 #0 0 x 41 cb 76 (para. Graph+0 x 41 cb 76) #1 0 x 7 f 6852 efdf 62 (/usr 0/local/libiomp 5. so+0 x 89 f 62) #2 0 x 7 f 6852 ea 7 ae 3 (/usr 0/local/libiomp 5. so+0 x 33 ae 3) #3 0 x 7 f 6852 ea 620 a (/usr 0/local/libiomp 5. so+0 x 3220 a) #4 0 x 7 f 6852 ecab 80 (/usr 0/local/libiomp 5. so+0 x 56 b 80) #5 0 x 7 f 684 fdb 7 b 97 (/usr/lib/x 86_64 -linux-gnu/libasan. so. 0. 0. 0+0 x 18 b 97) #6 0 x 7 f 684 efa 4181 (/lib/x 86_64 -linux-gnu/libpthread-2. 19. so+0 x 8181) #7 0 x 7 f 684 f 2 b 447 c (/lib/x 86_64 -linux-gnu/libc-2. 19. so+0 xfa 47 c). . . CMU 15 -418/618, Spring 2019

Instrumentation Tool Families ▪ Program Optimization - Gprof - Perf - VTune ▪ Program Debugging - Valgrind - Sanitizers ▪ Advanced Analysis - Pin - Contech CMU 15 -418/618, Spring 2019

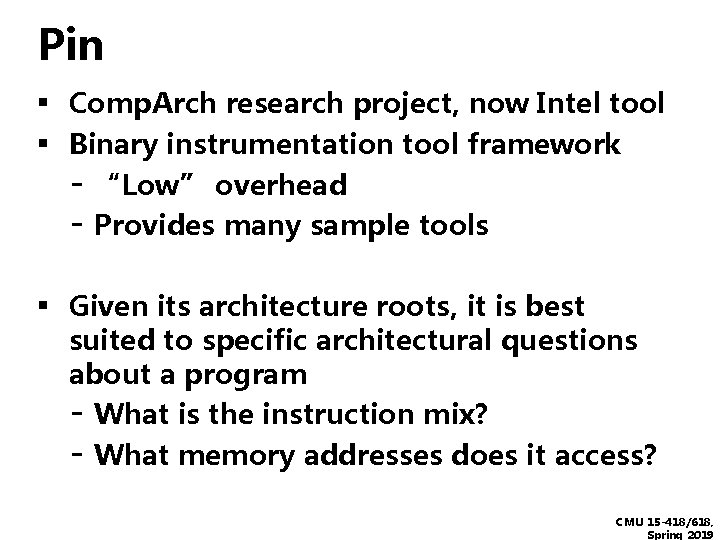
Pin ▪ Comp. Arch research project, now Intel tool ▪ Binary instrumentation tool framework - “Low” overhead - Provides many sample tools ▪ Given its architecture roots, it is best suited to specific architectural questions about a program - What is the instruction mix? - What memory addresses does it access? CMU 15 -418/618, Spring 2019

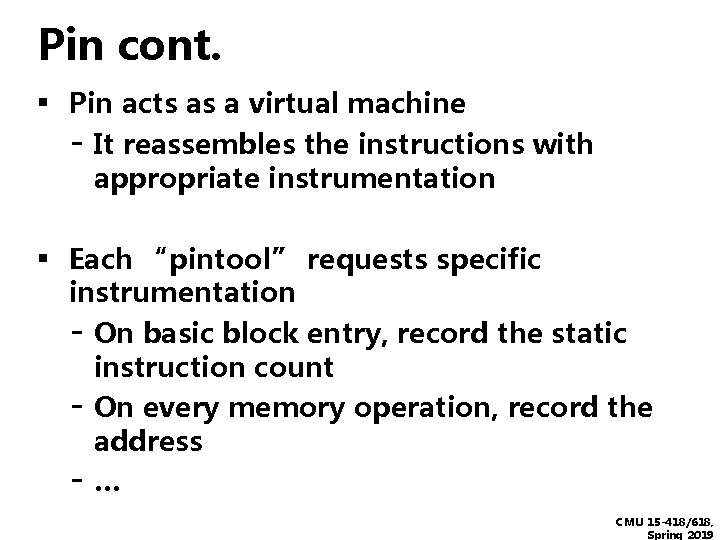
Pin cont. ▪ Pin acts as a virtual machine - It reassembles the instructions with appropriate instrumentation ▪ Each “pintool” requests specific instrumentation - On basic block entry, record the static instruction count - On every memory operation, record the address -… CMU 15 -418/618, Spring 2019

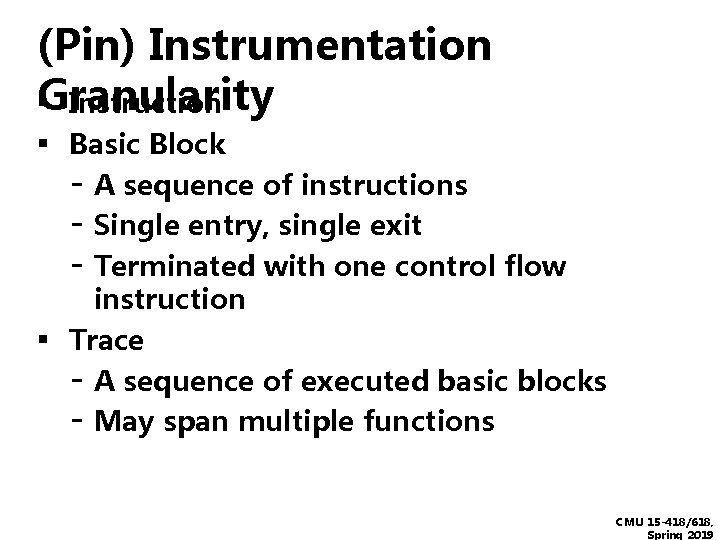
(Pin) Instrumentation Granularity ▪ Instruction ▪ Basic Block - A sequence of instructions - Single entry, single exit - Terminated with one control flow ▪ instruction Trace - A sequence of executed basic blocks - May span multiple functions CMU 15 -418/618, Spring 2019

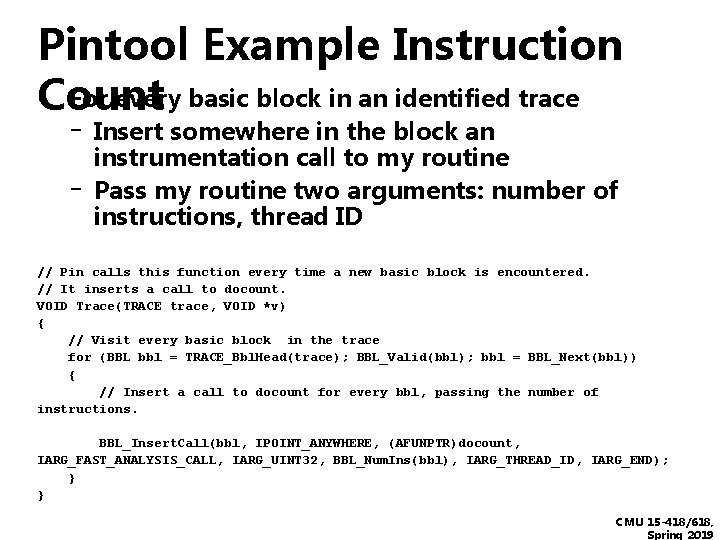
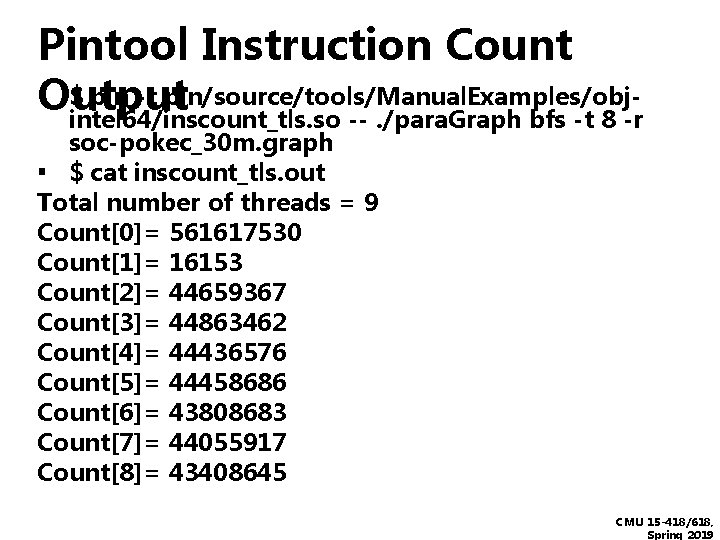
Pintool Example Instruction ▪Count For every basic block in an identified trace - Insert somewhere in the block an instrumentation call to my routine Pass my routine two arguments: number of instructions, thread ID // Pin calls this function every time a new basic block is encountered. // It inserts a call to docount. VOID Trace(TRACE trace, VOID *v) { // Visit every basic block in the trace for (BBL bbl = TRACE_Bbl. Head(trace); BBL_Valid(bbl); bbl = BBL_Next(bbl)) { // Insert a call to docount for every bbl, passing the number of instructions. BBL_Insert. Call(bbl, IPOINT_ANYWHERE, (AFUNPTR)docount, IARG_FAST_ANALYSIS_CALL, IARG_UINT 32, BBL_Num. Ins(bbl), IARG_THREAD_ID, IARG_END); } } CMU 15 -418/618, Spring 2019

Pintool Instruction Count ▪Output $ pin -t pin/source/tools/Manual. Examples/objintel 64/inscount_tls. so --. /para. Graph bfs -t 8 -r soc-pokec_30 m. graph ▪ $ cat inscount_tls. out Total number of threads = 9 Count[0]= 561617530 Count[1]= 16153 Count[2]= 44659367 Count[3]= 44863462 Count[4]= 44436576 Count[5]= 44458686 Count[6]= 43808683 Count[7]= 44055917 Count[8]= 43408645 CMU 15 -418/618, Spring 2019

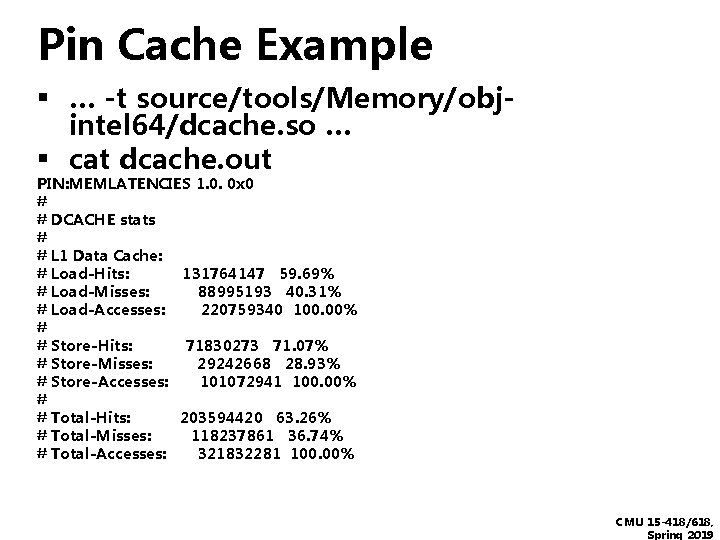
Pin Cache Example ▪ … -t source/tools/Memory/obj▪ intel 64/dcache. so … cat dcache. out PIN: MEMLATENCIES 1. 0. 0 x 0 # # DCACHE stats # # L 1 Data Cache: # Load-Hits: 131764147 59. 69% # Load-Misses: 88995193 40. 31% # Load-Accesses: 220759340 100. 00% # # Store-Hits: 71830273 71. 07% # Store-Misses: 29242668 28. 93% # Store-Accesses: 101072941 100. 00% # # Total-Hits: 203594420 63. 26% # Total-Misses: 118237861 36. 74% # Total-Accesses: 321832281 100. 00% CMU 15 -418/618, Spring 2019

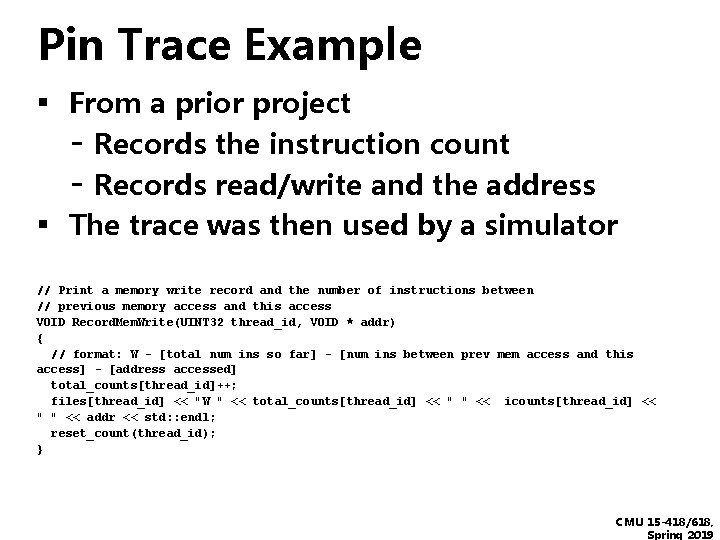
Pin Trace Example ▪ From a prior project - Records the instruction count - Records read/write and the address ▪ The trace was then used by a simulator // Print a memory write record and the number of instructions between // previous memory access and this access VOID Record. Mem. Write(UINT 32 thread_id, VOID * addr) { // format: W - [total num ins so far] - [num ins between prev mem access and this access] - [address accessed] total_counts[thread_id]++; files[thread_id] << "W " << total_counts[thread_id] << " " << icounts[thread_id] << " " << addr << std: : endl; reset_count(thread_id); } CMU 15 -418/618, Spring 2019

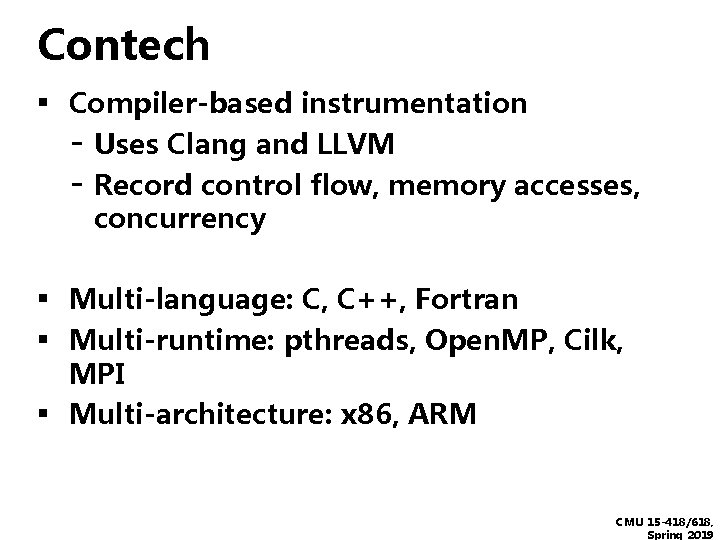
Contech ▪ Compiler-based instrumentation - Uses Clang and LLVM - Record control flow, memory accesses, concurrency ▪ Multi-language: C, C++, Fortran ▪ Multi-runtime: pthreads, Open. MP, Cilk, ▪ MPI Multi-architecture: x 86, ARM CMU 15 -418/618, Spring 2019

Contech continued ▪ Designed around writing analysis not instrumentation - All instrumentation is always used - Assumes the program is correct - Traces are analyzed after collection, not during ▪ Sample backends (i. e. , analysis tools) are available - Cache Model - Data race detection - Memory usage CMU 15 -418/618, Spring 2019

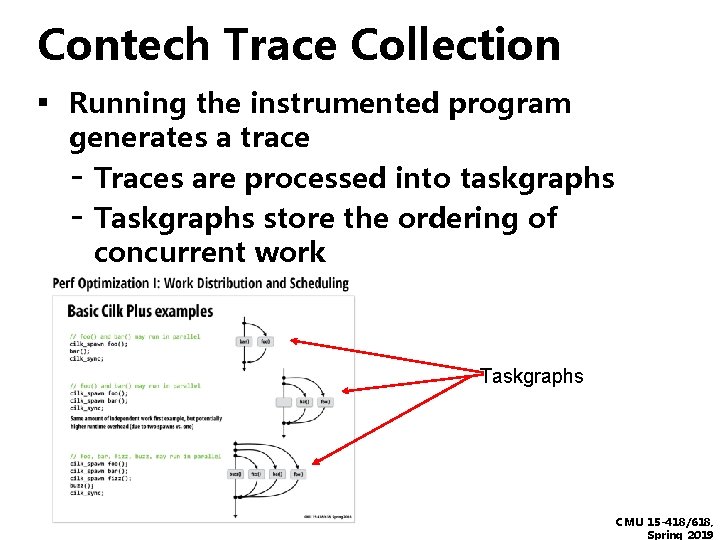
Contech Trace Collection ▪ Running the instrumented program generates a trace - Traces are processed into taskgraphs - Taskgraphs store the ordering of concurrent work Taskgraphs CMU 15 -418/618, Spring 2019

Contech Trace Collection ▪Example. /para. Graph bfs -t 8 -r socpokec_30 m. graph - BFS Time: 0. 0215 s - -> 0. 2108 s (9. 8 x slowdown) 1855 MB trace -> 1388 MB taskgraph - 91 million basic blocks 321 million memory accesses 3 million synchronization operations CMU 15 -418/618, Spring 2019

Summary Questions ▪ If you may have a performance issue: - Is the issue reproducible? - Do you have a workload? - Is the system stable? - Is the workload at full CPU? - If not, are there other users / - time / top processes running? - Or does the workload rely heavily on IO? gprof / perf Is the CPU time confined to a small number of functions? - What is the most time consuming CMU 15 -418/618, Spring 2019

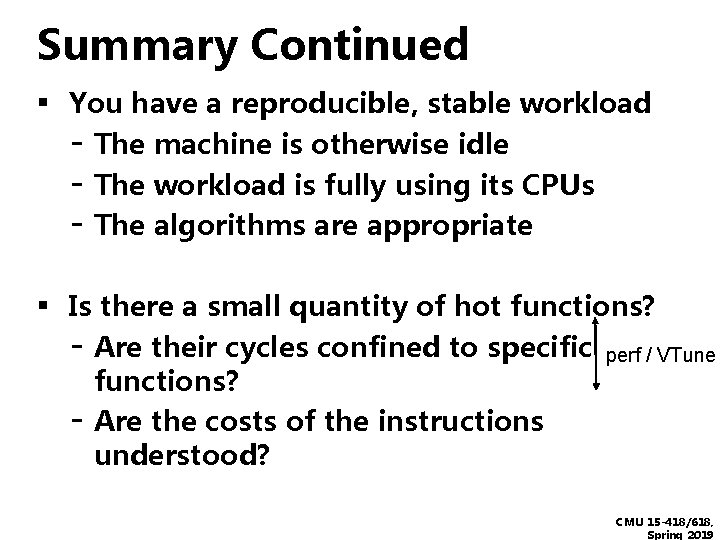
Summary Continued ▪ You have a reproducible, stable workload - The machine is otherwise idle - The workload is fully using its CPUs - The algorithms are appropriate ▪ Is there a small quantity of hot functions? - Are their cycles confined to specific - functions? Are the costs of the instructions understood? perf / VTune CMU 15 -418/618, Spring 2019

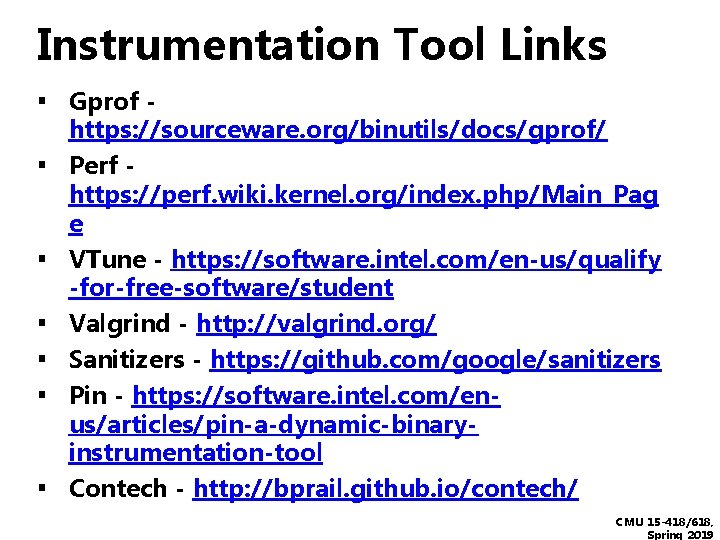
Instrumentation Tool Links ▪ Gprof ▪ ▪ ▪ https: //sourceware. org/binutils/docs/gprof/ Perf https: //perf. wiki. kernel. org/index. php/Main_Pag e VTune - https: //software. intel. com/en-us/qualify -for-free-software/student Valgrind - http: //valgrind. org/ Sanitizers - https: //github. com/google/sanitizers Pin - https: //software. intel. com/enus/articles/pin-a-dynamic-binaryinstrumentation-tool Contech - http: //bprail. github. io/contech/ CMU 15 -418/618, Spring 2019

Other links ▪ Performance Anti-patterns: http: //queue. acm. org/detail. cfm? id=1117 403 CMU 15 -418/618, Spring 2019