Operations as a Competitive Weapon Year Expected Demand

- Slides: 29
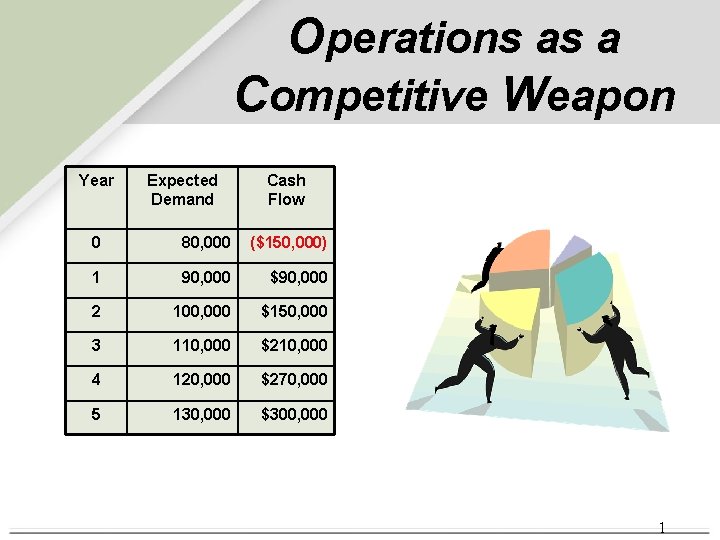
Operations as a Competitive Weapon Year Expected Demand Cash Flow 0 80, 000 ($150, 000) 1 90, 000 $90, 000 2 100, 000 $150, 000 3 110, 000 $210, 000 4 120, 000 $270, 000 5 130, 000 $300, 000 1
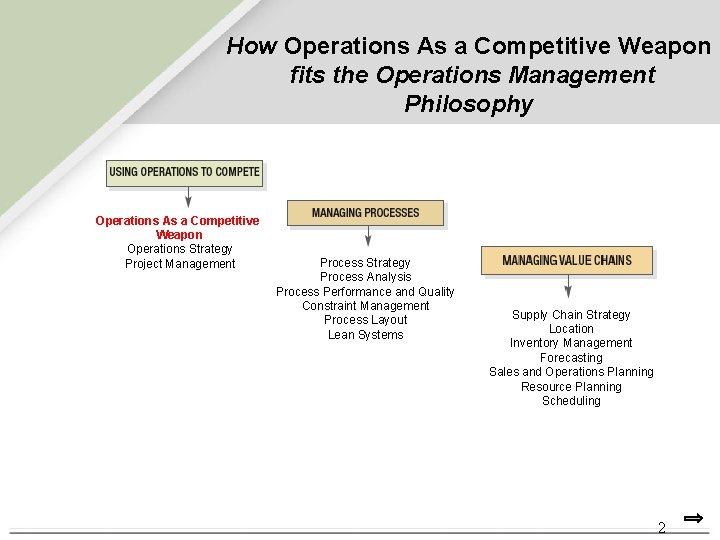
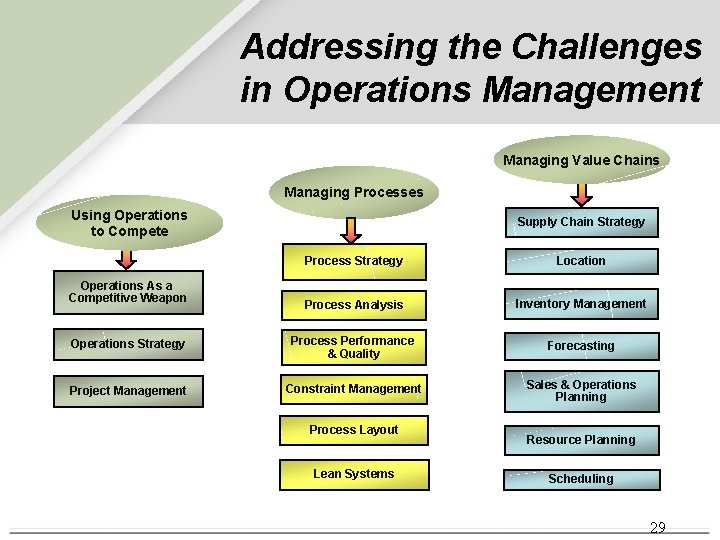
How Operations As a Competitive Weapon fits the Operations Management Philosophy Operations As a Competitive Weapon Operations Strategy Project Management Process Strategy Process Analysis Process Performance and Quality Constraint Management Process Layout Lean Systems Supply Chain Strategy Location Inventory Management Forecasting Sales and Operations Planning Resource Planning Scheduling 2
Outline • Fed. Ex • Operations Management as a Function • What is process? • Value Chain • Operations as a Set of Decisions • Challenges in Operations Management 3
Fed. Ex Ø Why are they successful? ØFast ØOn-time deliveries ØRelatively low cost ØTechnology in shipment tracking 4
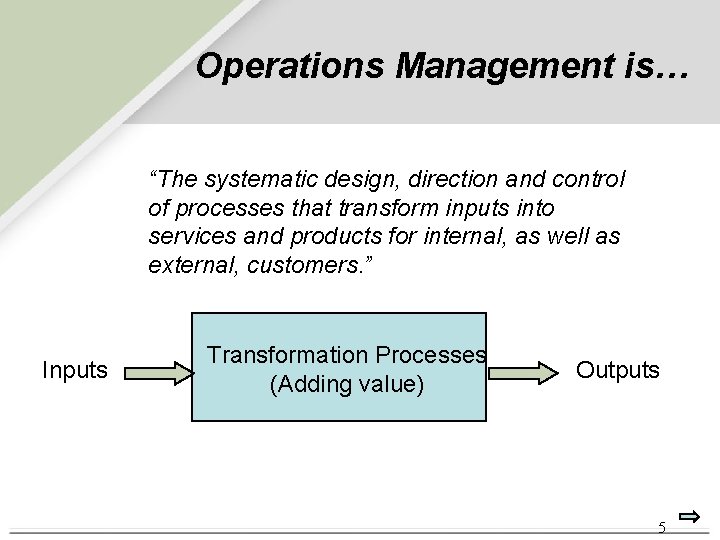
Operations Management is… “The systematic design, direction and control of processes that transform inputs into services and products for internal, as well as external, customers. ” Inputs Transformation Processes (Adding value) Outputs 5
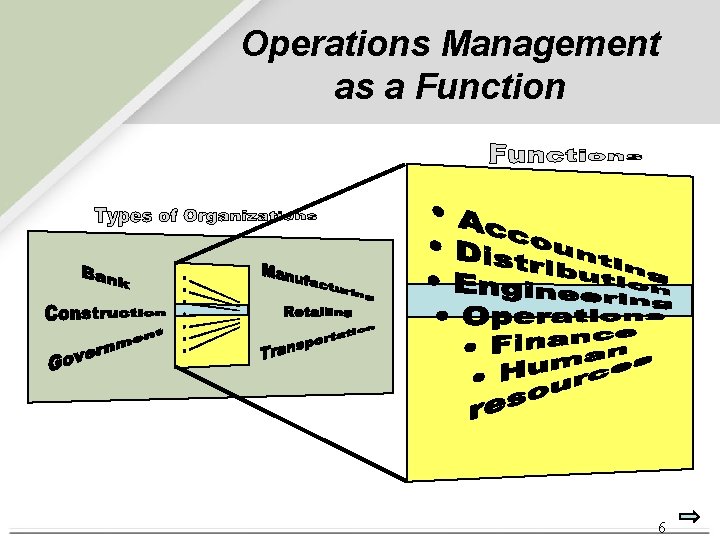
Operations Management as a Function 6
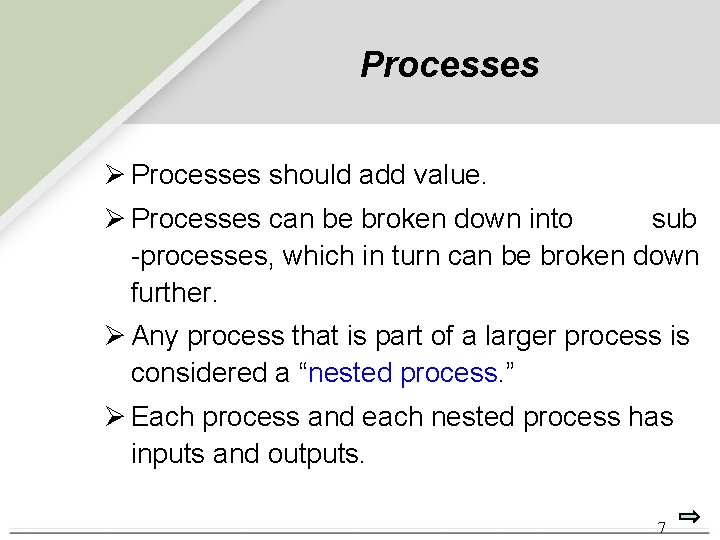
Processes Ø Processes should add value. Ø Processes can be broken down into sub -processes, which in turn can be broken down further. Ø Any process that is part of a larger process is considered a “nested process. ” Ø Each process and each nested process has inputs and outputs. 7
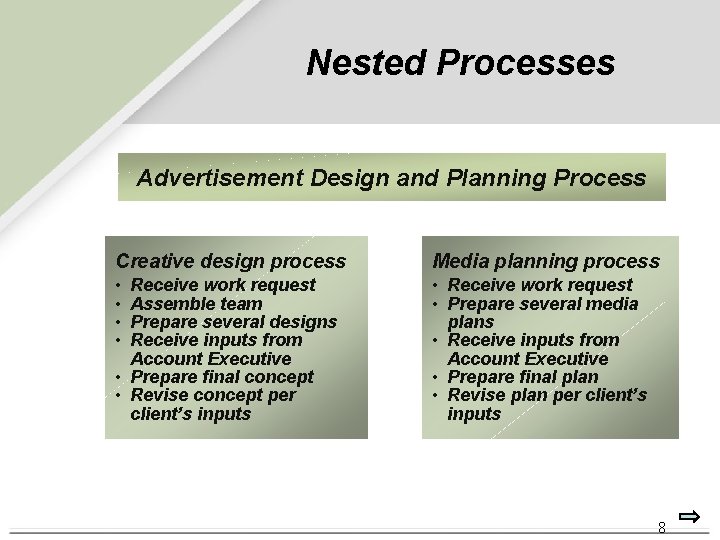
Nested Processes Advertisement Design and Planning Process Creative design process Media planning process • • • Receive work request • Prepare several media plans • Receive inputs from Account Executive • Prepare final plan • Revise plan per client’s inputs Receive work request Assemble team Prepare several designs Receive inputs from Account Executive • Prepare final concept • Revise concept per client’s inputs 8
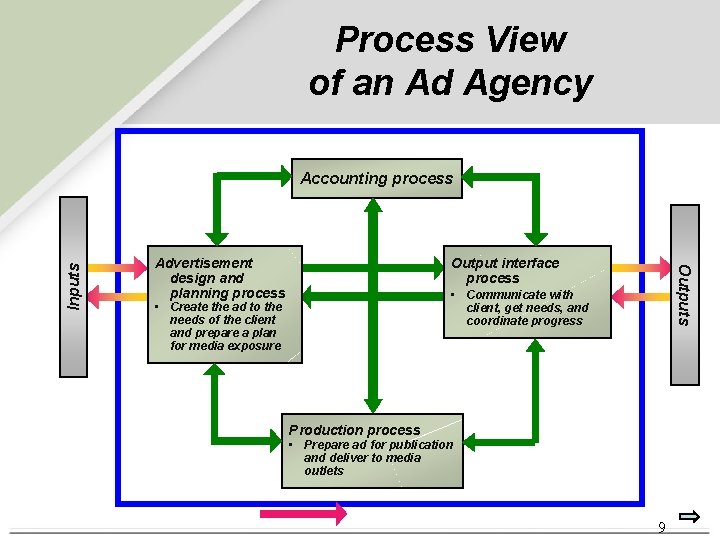
Process View of an Ad Agency Advertisement design and planning process Output interface process Outputs Inputs Accounting process • Communicate with client, get needs, and coordinate progress • Create the ad to the needs of the client and prepare a plan for media exposure Production process • Prepare ad for publication and deliver to media outlets 9
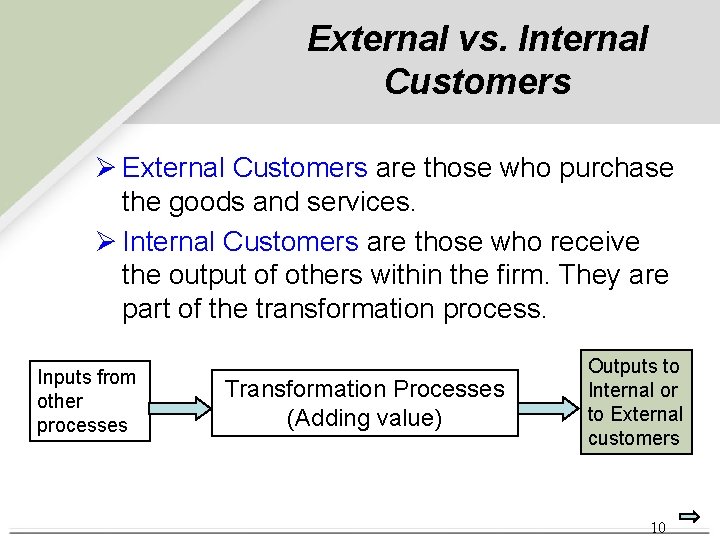
External vs. Internal Customers Ø External Customers are those who purchase the goods and services. Ø Internal Customers are those who receive the output of others within the firm. They are part of the transformation process. Inputs from other processes Transformation Processes (Adding value) Outputs to Internal or to External customers 10
Service Processes and Manufacturing Processes Manufacturing processes change materials in one or more of the following dimensions: Ø Physical properties Ø Shape Ø Fixed dimensions Ø Surface finish Ø Joining parts and materials If a process isn’t doing at least one of these, then it is a service (non-manufacturing) process. 11
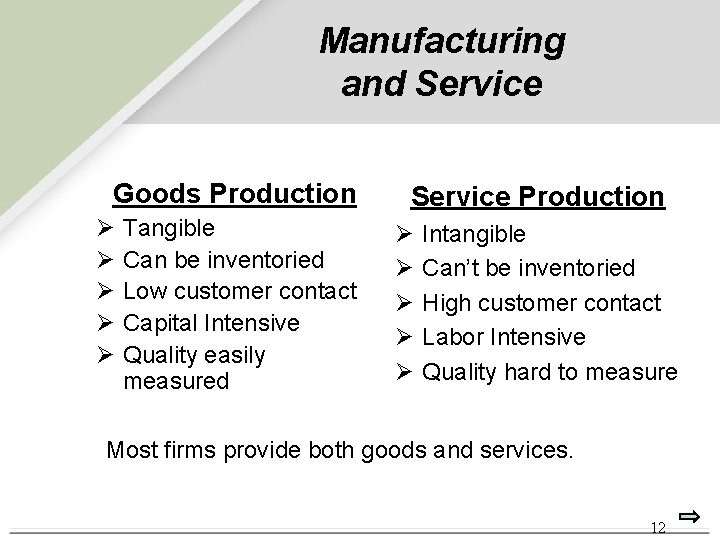
Manufacturing and Service Goods Production Ø Ø Ø Tangible Can be inventoried Low customer contact Capital Intensive Quality easily measured Service Production Ø Ø Ø Intangible Can’t be inventoried High customer contact Labor Intensive Quality hard to measure Most firms provide both goods and services. 12
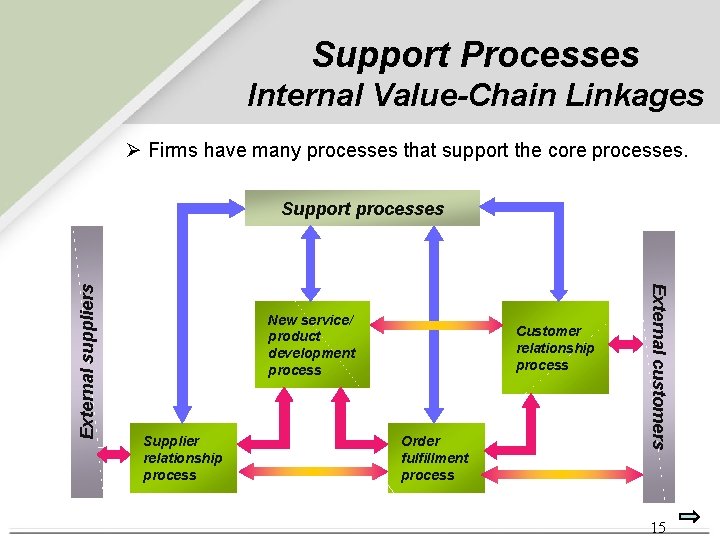
Value Chains Ø Value chains are an interrelated series of processes that produce a service or product to the satisfaction of customers. Ø Value chains may have core processes or support processes. Ø Core processes deliver value to external customers. Ø Support processes provide vital inputs for the core processes. 13
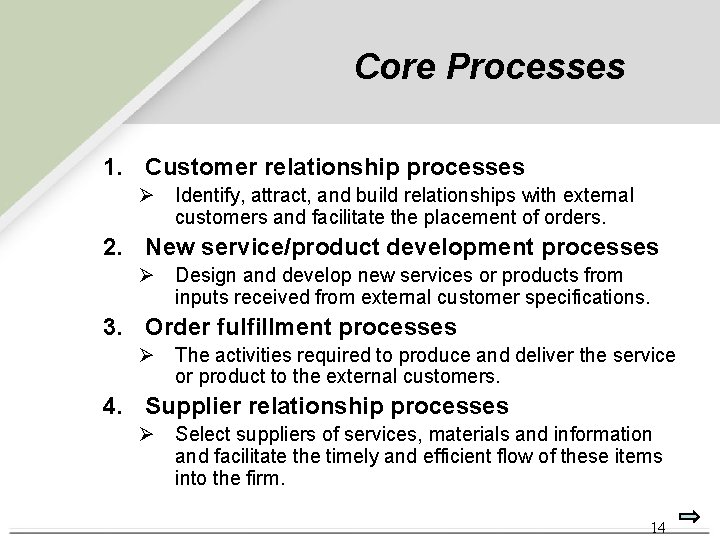
Core Processes 1. Customer relationship processes Ø Identify, attract, and build relationships with external customers and facilitate the placement of orders. 2. New service/product development processes Ø Design and develop new services or products from inputs received from external customer specifications. 3. Order fulfillment processes Ø The activities required to produce and deliver the service or product to the external customers. 4. Supplier relationship processes Ø Select suppliers of services, materials and information and facilitate the timely and efficient flow of these items into the firm. 14
Support Processes Internal Value-Chain Linkages Ø Firms have many processes that support the core processes. New service/ product development process Supplier relationship process Customer relationship process Order fulfillment process External customers External suppliers Support processes 15
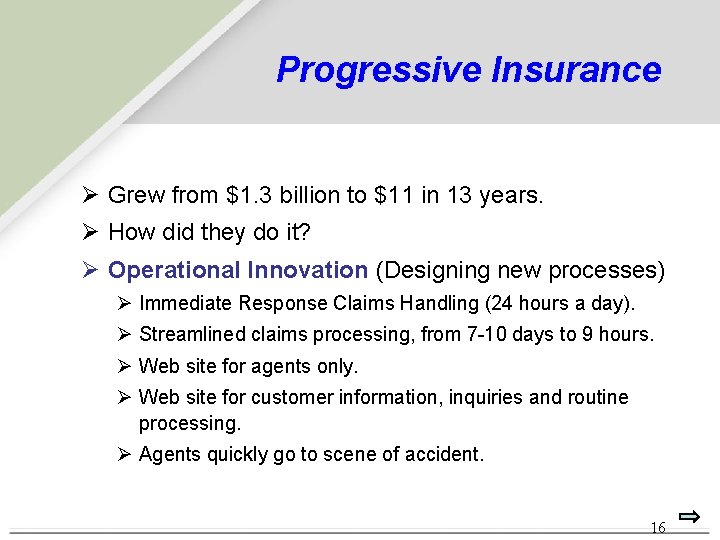
Progressive Insurance Ø Grew from $1. 3 billion to $11 in 13 years. Ø How did they do it? Ø Operational Innovation (Designing new processes) Ø Immediate Response Claims Handling (24 hours a day). Ø Streamlined claims processing, from 7 -10 days to 9 hours. Ø Web site for agents only. Ø Web site for customer information, inquiries and routine processing. Ø Agents quickly go to scene of accident. 16
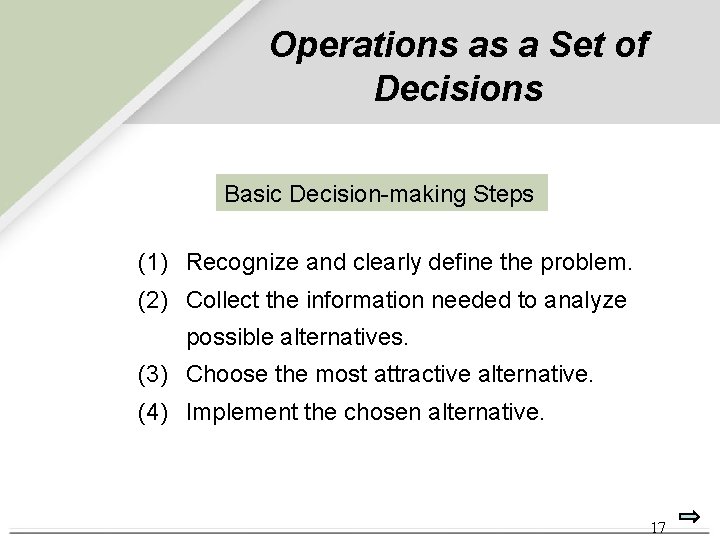
Operations as a Set of Decisions Basic Decision-making Steps (1) Recognize and clearly define the problem. (2) Collect the information needed to analyze possible alternatives. (3) Choose the most attractive alternative. (4) Implement the chosen alternative. 17
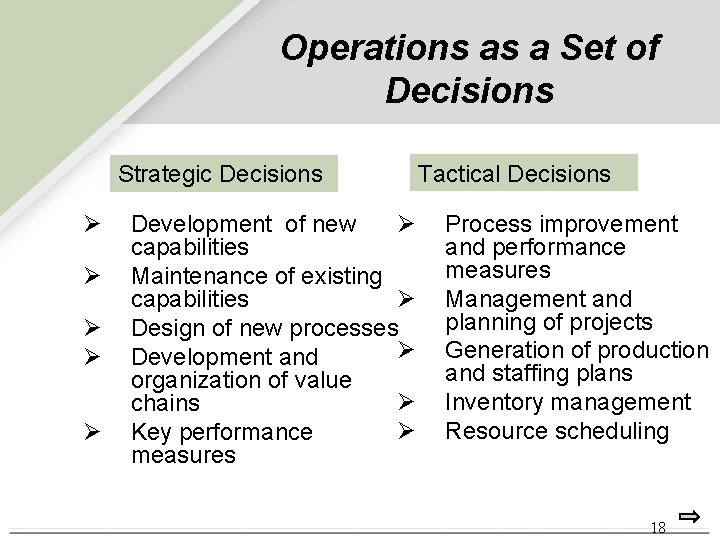
Operations as a Set of Decisions Strategic Decisions Ø Ø Ø Development of new capabilities Maintenance of existing Ø capabilities Design of new processes Ø Development and organization of value Ø chains Ø Key performance measures Tactical Decisions Process improvement and performance measures Management and planning of projects Generation of production and staffing plans Inventory management Resource scheduling 18
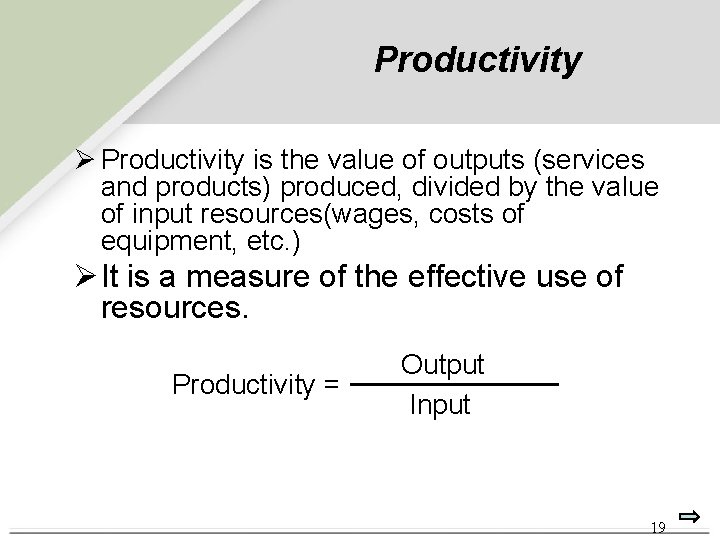
Productivity Ø Productivity is the value of outputs (services and products) produced, divided by the value of input resources(wages, costs of equipment, etc. ) Ø It is a measure of the effective use of resources. Productivity = Output Input 19
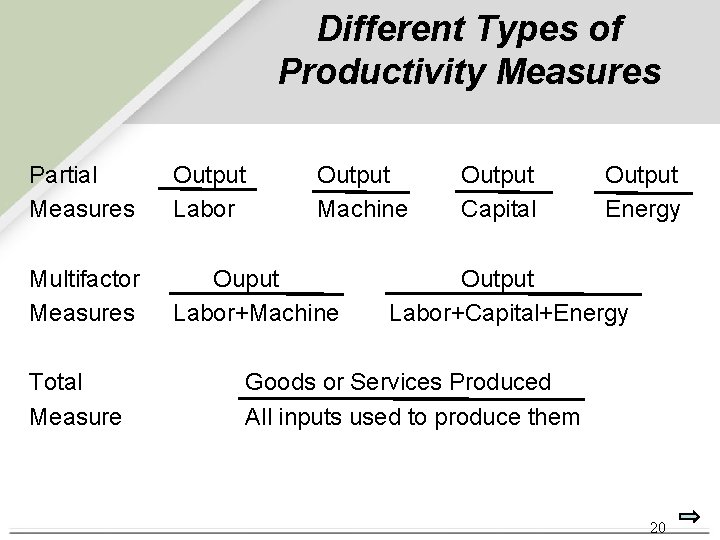
Different Types of Productivity Measures Partial Measures Output Labor Multifactor Measures Ouput Labor+Machine Total Measure Output Machine Output Capital Output Energy Output Labor+Capital+Energy Goods or Services Produced All inputs used to produce them 20
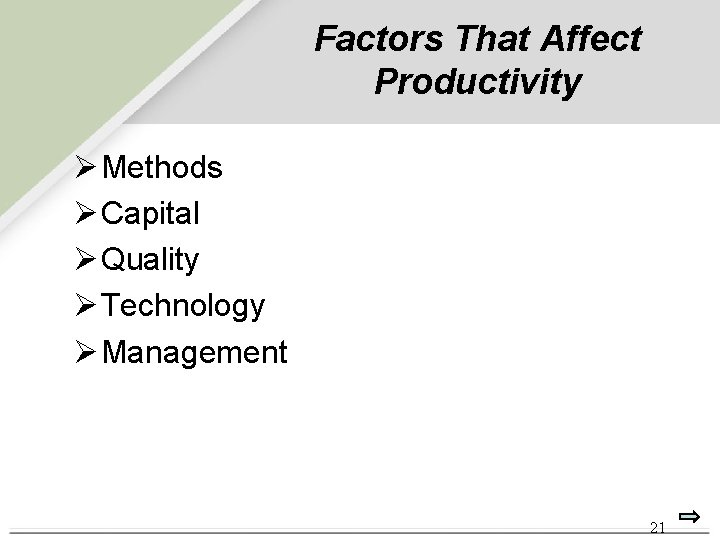
Factors That Affect Productivity Ø Methods Ø Capital Ø Quality Ø Technology Ø Management 21
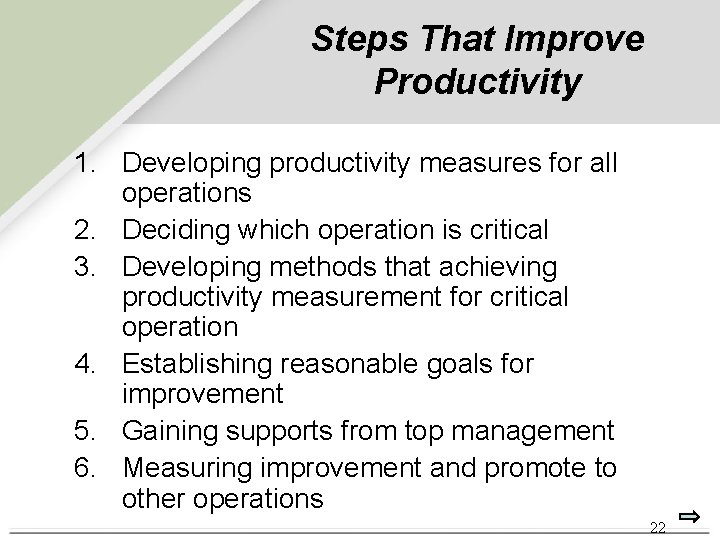
Steps That Improve Productivity 1. Developing productivity measures for all operations 2. Deciding which operation is critical 3. Developing methods that achieving productivity measurement for critical operation 4. Establishing reasonable goals for improvement 5. Gaining supports from top management 6. Measuring improvement and promote to other operations 22
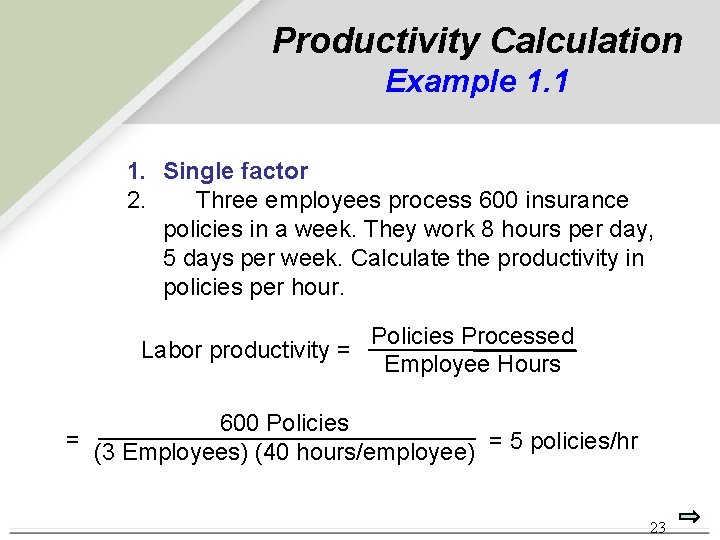
Productivity Calculation Example 1. 1 1. Single factor 2. Three employees process 600 insurance policies in a week. They work 8 hours per day, 5 days per week. Calculate the productivity in policies per hour. Policies Processed Labor productivity = Employee Hours 600 Policies = (3 Employees) (40 hours/employee) = 5 policies/hr 23
Productivity Calculation Example 1. 1 continued 2. Multifactor A team of workers makes 400 units of a product, valued by its standard cost of $10 each (before markups for other expenses and profit). The accounting department reports that the actual costs are $400 for labor, $1, 000 for materials, and $300 for overhead. Calculate the productivity. Quality at standard cost Multifactor productivity = Labor cost + Materials Cost + Overhead cost = (400 units) ($10/unit) $4, 000 = $400 + $1000 + $300 1, 700 = 2. 35 Ø These figures must be compared with performance levels in prior periods and with future goals. 24
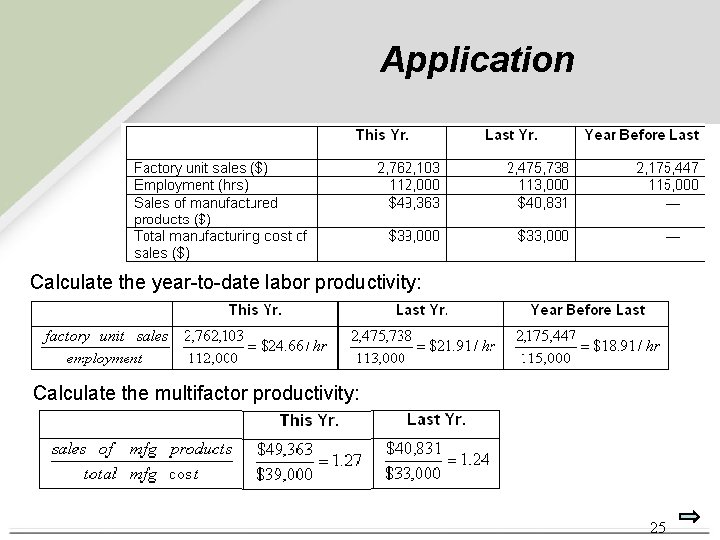
Application Calculate the year-to-date labor productivity: Calculate the multifactor productivity: 25
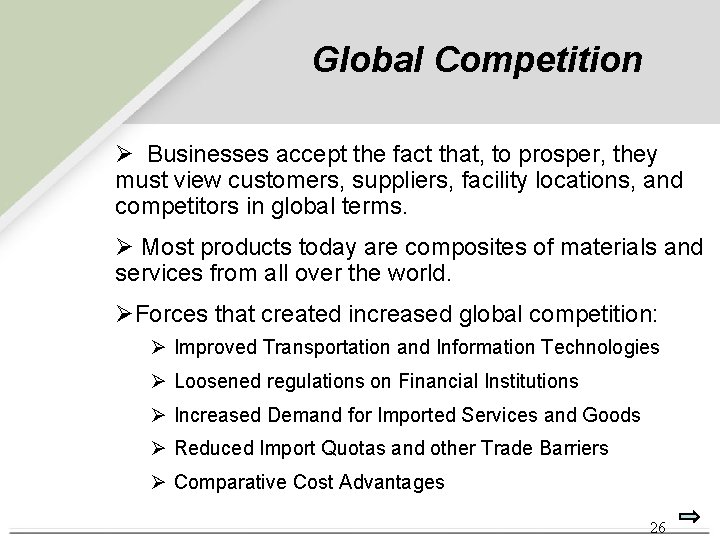
Global Competition Ø Businesses accept the fact that, to prosper, they must view customers, suppliers, facility locations, and competitors in global terms. Ø Most products today are composites of materials and services from all over the world. ØForces that created increased global competition: Ø Improved Transportation and Information Technologies Ø Loosened regulations on Financial Institutions Ø Increased Demand for Imported Services and Goods Ø Reduced Import Quotas and other Trade Barriers Ø Comparative Cost Advantages 26
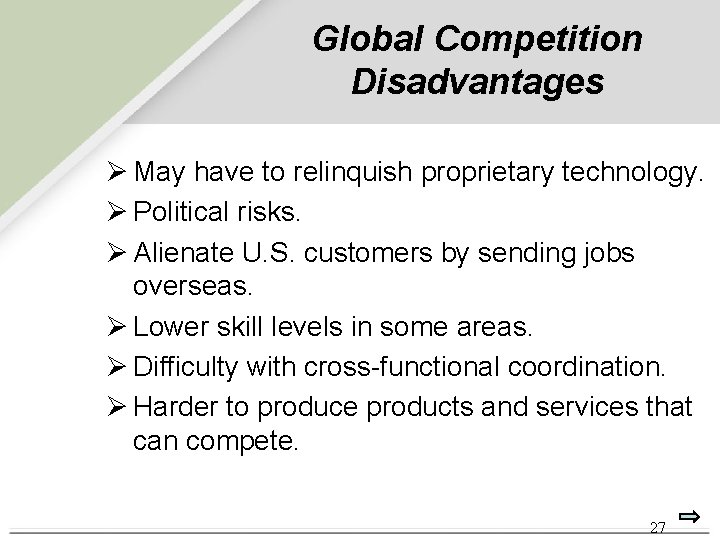
Global Competition Disadvantages Ø May have to relinquish proprietary technology. Ø Political risks. Ø Alienate U. S. customers by sending jobs overseas. Ø Lower skill levels in some areas. Ø Difficulty with cross-functional coordination. Ø Harder to produce products and services that can compete. 27
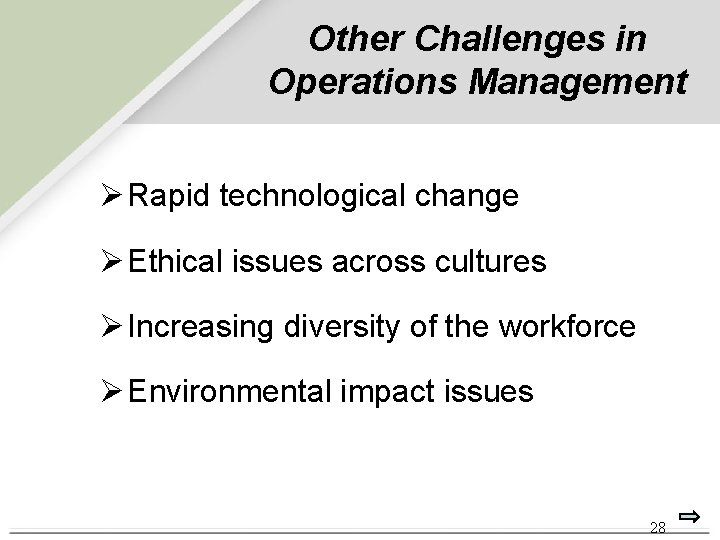
Other Challenges in Operations Management Ø Rapid technological change Ø Ethical issues across cultures Ø Increasing diversity of the workforce Ø Environmental impact issues 28
Addressing the Challenges in Operations Management Managing Value Chains Managing Processes Using Operations to Compete Supply Chain Strategy Process Strategy Location Process Analysis Inventory Management Operations Strategy Process Performance & Quality Forecasting Project Management Constraint Management Sales & Operations Planning Operations As a Competitive Weapon Process Layout Lean Systems Resource Planning Scheduling 29