NUCAPS Status and summary of evaluations from recent


- Slides: 35

NUCAPS Status and summary of evaluations from recent field campaigns Presented by: Chris Barnet Science and Technology Corporation With contributions from: Lori Borg (SSEC), Nick Nalli (STAR), Mitch Goldberg (JPSS), Antonia Gambacorta, Nadia Smith, Jonathan Smith, Jim Davies (SSEC), Tom King (STAR), Bill Sjoberg (JPSS), and many more NOAA Satellite Proving Ground / User Readiness Meeting Wednesday, May 11, 2016 (Session 6, 16: 15) 1

What is NUCAPS? • NOAA-Unique Combined Atmospheric Sounding System (NUCAPS) uses both infrared and microwave sounders • We wrote original project plan in Sep. 2003 for Aqua, Metop, NPP/JPSS, (and GOES-R/HES processing) • Selected NASA AIRS ST algorithm as the most robust • NUCAPS is a distribution of both radiance and geophysical products • NUCAPS-Metop algorithm: Operational since 8/2008 – Metop-A started with IASI/AMSU/MHS, AVHRR CCR (8/2012) – Metop-B operational on 11/2015 with AVHRR – Will continue to run both operationally (orbits interleaved) • NUCAPS-NPP algorithm: Operational since 4/2014 – High resolution Cr. IS scheduled for fall 2016 • Operational maintenance budget is very small – All upgrades have to be justified, prioritized, and scheduled 2

Availability of NUCAPS-NPP (with latency) • Apr. 18, 2014 NUCAPS operational at OSPO – Via DDS subscription in near real time ( 3 h) – Via CLASS interactive webpage (~ 6 h) – On-line/downloadable TAR files via CLASS ftp site (~48 h) • Sep. 2014 AWIPS-II implementation begins at NWS/WFO’s – NUCAPS T(p) and H 2 O(p) products can be displayed as skew-T and manipulated within AWIPS ( 3 h) – May 2016 testing of cross-section (plan view and volume browser) – May 2016 testing of NUCAPS-Metop (soundings 4 x/day) • Feb. 24, 2015 NUCAPS operational at CSPP direct broadcast stations – CSPP = Community Satellite Processing Package – Support field campaigns and science evaluations – Network of DB will be used to reduce latency to NWP • Reprocessing of full mission Cr. IS+ATMS SDRs and NUCAPS at Univ. Wisconsin (JPSS funded) – V 1. 0 (2014 operational system) completed in Aug. 2015 3

S-NPP EDR Validation: ARM Sites North Slope Alaska (NSA) • Dedicated S-NPP Launches occurring once every ~4 days ENA TWP OP-45 min & -5 min Single Launch OP-15 min overpass time Dual Launch overpass time Southern Great Plains (SGP) • Dual & Single Dedicated Launch Strategies • Combined w/ancillary data -> Best Estimate (BE) Slide courtesy of Lori Borg

S-NPP EDR Validation: T & WV Profile Distributions • profiles consist of highly accurate measurements of wide range of conditions • Part of analysis is to measure the variability within dual-sonde ascent • 0. 75 K in T(p) and 5 -30% in H 2 O(p) is seen within 40 minutes NSA NSA Temperature (K) SGP SGP Temperature (K) NSA • coastal site • cold & dry • variable surface (ocean, sea ice, tundra) • low contrast between clouds and surface H 2 O (g/kg) SGP • continental site • wide fluctuations in WV • complex sfc emission H 2 O (g/kg) Slide courtesy of Lori Borg

S-NPP EDR Validation: Comparisons of NUCAPS & Best. Estimate (BE) • 1 km layer differences shown for ALLSky conditions • mean (dashed) & RMS (solid) differences shown GDAS-BE NUCAPS-BE NSA Temperature Difference (K) SGP Temperature Difference (K) • preliminary comparison of NUCAPS & BE look good • further effort is ongoing to assess what is happening near the surface Slide courtesy of Lori Borg

Validation of NUCAPS by NOAA/STAR (Nick Nalli) • Compared T(p) and q(p) to dedicated RS-92 launches – ARM SGP, NSA, ENA – Howard Univ. Beltsville USA (urban site) – R. H. Brown field campaigns (AEROSE and Cal. Water) • Compared to ozonesondes – AEROSE + Cal. Water – SHADOZ (not shown on map) – WOUDC (not shown on map) Selected radiosondes within 50 km radius and -75 δ to 0 minutes δt = t(RAOB)-t(NNP) Selected ozonesondes within 125 km and -250 δt +120 minutes 7

Results (AMS Paper #352, 2016 Annual meeting) • NUCAPS meets JPSS requirements for both ATMSonly (magenta) and Cr. IS+ATMS (blue) retrievals – Cr. IS+ATMS AVMP exceeds 100 -300 RMS • Believed to be caused by a bias in the RAOBS T(p) AVTP (K) RMS BIAS q(p) AVMP (%) RMS BIAS O 3(p) AVMP (%) RMS BIAS 8

The JPSS initiatives: a recipe for validation and R 2 O • Put yourself in the user’s environment – Listen to exactly how they interpret the data • This requires institutional knowledge of their application – e. g. , words we use many not convey the same meaning – Tailor product to their syntax and visualization • Utilize the user’s metric of success • If you never leave your “cubicle”, you’ll have difficulty establishing your relevance These concepts are adapted from Kloos 2016 Esri Arcuser newsletter “The ROI mindset for GIS Managers” 9

But … you need to ask the right questions • A question such as “Do you want high spatial resolution” will always be answered “yes” – Better to ask “Which is more important, spatial resolution or boundary layer sensitivity” • The answer will depend on application • The sounding community assumes retrievals would be useful for global or regional models – But are we listening to what they really need? • We do not have a stable a-priori. – Radiance assimilation has Gaussian shaped impact, with a mean slightly above zero. • We need to efficiently convey our vertical co-variance and minimize our biases 10

My focus: application dependent characterization of NUCAPS • NOAA is investing in a number of JPSS Sounding Initiatives – Goal is to demonstrate new applications with S-NPP • Focus is on applications with high societal value • These are not the “easy” applications – Secondary goal is to encourage interaction between developers and users to tailor soundings to applications • We currently have a number of active initiatives for sounding 1. 2. 3. 4. NUCAPS in AWIPS-II: training module & improvements Hazardous Weather Testbed (HWT): Convective Initiation Hydrometeorology Testbed (HMT): Atmospheric Rivers and El Nino Rapid Response field campaigns See Bill Sjoberg’s Session #4 (4: 20 pm) for list/discussion of other initiatives • I will speak to item #3 today – Bill Line and Dan Nietfeld are speaking to items #1 and #2 in Sessions 4 11 (11: 35 am), 6 (3: 10 pm), and 8 (2: 50 pm and 3: 05 pm)

Hydrometeorology Testbed: El Nino Rapid* Response Field Campaign * Campaign went from white paper proposal to implementation in less than 2 months POCs: Chris Barnet (JPSS) & Ryan Spackman (NOAA/ESRL/PSD) 12

Planned Implementation Strategy • G-IV: Divergent outflow and jet extension processes in central and eastern tropical Pacific • GH: Coupling to midlatitude weather with surveys in eastern Pacific mid-latitudes to evaluate impacts on US West Coast • R. H. Brown: Survey of atmosphere and ocean conditions in eastern tropical Pacific 13

Meridional Perspective on Flight Strategies • G-IV: Divergent flow aloft in central/eastern tropical Pacific should mostly be reachable by G-IV at altitude of 1214 km and captured by dropsonde measurements • GH: Survey the subtropical jet and deep tropics where convection may extend above G-IV altitude. 14

Campaign ran from Jan. 19 th through Mar. 10 th, 2016 • NOAA G-IV deployed from Honolulu International Airport – Twenty-two 8 -hour flights, Jan. 21 through March 10 th – 41 -45, 000’, ~25 -35 dropsondes/flight • Global Hawk (GH), part of SHOUT, deployed from NASA/AMES – Three 24 -hour flights (2/15, 2/16 and 2/21) – 55 -63, 000’, ~65 dropsondes/flight • radiosonde launches at Kiritimati Isl. , Kiribati (2 N, 157 W) – first radiosonde 1/26, 2 pm HT, will continued though mid-March – Close to S-NPP overpass time (0, 12 Z), 1340 miles south of Honolulu • NOAA Ron Brown departed Ford Island Tue. 2/16 – 6 to 8 RS-92 sonde launches per day, continued through mid-March • Two C-130’s, one at each end of AR (Hickam HI and Travis CA) – Two flights made (2/18 and 2/21) Field campaign website: http: //www. esrl. noaa. gov/psd/enso/rapid_response/ 15

G-IV Flight Module Deep Tropics • Measure thermodynamics and wind field north of the ITCZ – sample organized tropical convection – poleward convective outflow • Box module is 450 nmi square with 75 nmi dropsonde spacing • G-IV performs box module in 4 hour at cruise altitude (41 -45 kft) • Expected total flight duration for pattern shown in ~8 hour (3500 nmi) 16

What we provided • We performed the same kind of analysis we did for Cal. Water-2015 and Cal. Water-2014 – Provided an overview document on satellite soundings and visualization methods to the campaign scientists • Selected pages (e. g. , skew-T description) is at end of this document – Use both Honolulu HI & Corvallis OR direct broadcast sites – Process 1: 30 am overpass (~12: 30 UT, 2: 30 HST, 7: 30 EST) • Provide analysis to flight forecasters during the planning telecon – Process 1: 30 pm overpass (~0: 30 UT, 14: 30 HST, 19: 30 EST) • Provide scientists an in-flight quick look at proposed dropsonde locations • Use archive data (~24 hours later) to process entire Pacific domain and provide comparison between retrievals (MWonly and IR+MW), co-located GFS, and dropsondes – 1 st comparison of dropsondes and satellite to capture meta data for campaign archive 17

Example of DB coverage • Feb. 21, 2016 pm coverage from both Corvallis and Hawaii – Periodic problems with “antenna shadowing” on NPP – Also see missing granules due to ATMS GEO problems 18

Fetch of DB antenna was a problem for this campaign • On most days the Hawaii antenna did not “see” far enough south to be useful for flight planning – Because Cr. IS requires data before/after for calibration • On most days Corvallis antenna didn’t “see” far enough west for Global Hawk 19

Some lessons learned for flight planning • We could routinely process direct broadcast NPP data with a total latency (satellite obs to skew-T plots) of 45 minutes • But for flight planning there is already a plethora of data – Real time T(p), q(p) can complement the other data • Mostly used to help to decide which forecast model was most representative of current conditions. • Towards the end of the mission, DB skew-T plots did help guide flight plan – But we need to be able to answer questions like “do you believe that dry layer aloft” on a case by case basis • Individual skew-T’s were more valuable than cross-section visualization • Morning orbit gave them a preview of the planned dropsonde data acquistion • Valuable insight into forecaster opinions of satellite soundings – They are aware and concerned with our a-priori assumptions – They assume we cannot handle outliers (stick to prior) • At the “grass roots” level, forecasters became aware of satellite capabilities and limitations. 20

Post-processing from archive: Jan. 21 through Feb. 2 21

Feb. 3 through Feb. 17 post-processing 22

Feb. 18 through Mar. 1 post-processing 23

Mar. 3 through Mar. 10 post-processing 24

Summary of acquired datasets for validation flight number 1 2 3 4 5 6 7 8 9 10 11 12 13 14 15 16 17 18 19 20 21 22 total acquired total analysed DB sites HI HI + CO HI HI HI + CO HI HI + CO Thu Mon Tue Fri Sat Tue Wed Fri Sun Mon Tue Wed Thu Sun Fri Sat Mon Tue Thu Sun Tue Thu flight date 1/21/2016 1/25/2016 1/26/2016 1/29/2016 1/30/2016 2/2/2016 2/3/2016 2/12/2016 2/14/2016 2/15/2016 2/16/2016 2/17/2016 2/18/2016 2/21/2016 2/26/2016 2/27/2016 2/29/2016 3/1/2016 3/3/2016 3/6/2016 3/8/2016 3/10/2016 1102 483 total # sondes 31 20 32 29 16 13 26 31 28 26 28 32 23 35 26 28 20 29 19 31 29 41 593 match #skew 31 17 24 22 9 8 26 31 28 4 27 24 18 32 9 15 20 23 19 29 29 38 overpass sondes 11/12 08/09 10/11 02/03 08/09 07/08 08/09 01/02 01 14/15 08/09 05/06 10/11 12/13 07/08 09/10 18/19 07/08 05/06 useful match -4. 3 min -9. 2 min -11. 4 min -0. 3 hour -11. 4 min +0. 3 hour + 3 min -2. 1 min -0. 3 hour -17. 3 min -9. 4 min -2. 1 min -1. 3 min +0. 9 hour +3. 4 min +4. 7 min 30 secs -5. 1 min +3. 0 min +3. 4 min +0. 7 hour # of GH sondes # C 130 sondes RHB sondes CXI sondes 1 5 5 6 0 1 7 7 6 6 8 7 144 6 2 2 2 2 2 89 102 2 22 85 65 89 187 483 25

Feb. 17, Sonde #1: 2. 5 hours before overpass time IR+MW tends to capture vertical T(p) and q(p) structure better than MW 26

Feb. 17, Sonde #5: 0. 8 hours before overpass time But obviously doesn’t have the vertical resolution of a sonde or GFS 27

Feb. 17, Sonde #8: near overpass time NUCAPS is capturing large scale vertical structures 28

Feb. 17, Sonde #28: 2. 3 hours after overpass time thin layers can be used to estimate vertical response 29

Feb. 17, Sonde #30: 3 hours after overpass time Again, vertical resolution of IR+MW tends to be better than MW-only 30

Feb. 17, Sonde #31: 3. 2 hours after overpass time But why did this case do so much better? 31

Specific research topics we will focus on • Characterize algorithms in ocean regimes – Assess satellite sounding vertical resolution • Ability to see marine inversions, moist areas aloft – Improve our training: do statistics in user units (dew point) • These data test our ability to see extremes – Moisture extremes along flight path – 2015/16 El Nino outside of NUCAPS climatology training – Can test sensitivity to a-priori assumptions • Support the scientific goals of the field campaign – Use satellite data to test skill of GFS on flight versus non-flight days • Is USA forecast sensitive to specific regions (e. g. , ITCZ outflow) • What datasets could enhance skill. – Add NUCAPS to datasets that document thermodynamic environment of the 2015/16 El Nino • Complements the in-situ data investment of this field campaign 32

Feedback has led to potential improvements to NUCAPS • We need to improve our surface retrieval – We will employ the NASA MEa. SURES MODIS/ASTER surface emissivity climatology (Borbas, SSEC) • Should improve NUCAPS lower tropospheric soundings over land • We need to improve our QC – Original QC was developed to demonstrate that we met requirements – We need application dependent QC – Forecasters need more information as to where to believe sounding • We will explore using a model (most likely RAP) a-priori – Would allow NUCAPS to “verify” the model in near-real time • If we have low information content our product relaxes to model (and we can convey that) • If we have high information content this informs the forecast to either have more confidence in the model or to estimate where the model is incorrect – Could bring in valuable surface information • Could minimize surface correction • Could ensure surface correction agrees with satellite measurements 33

THANK YOU! QUESTIONS? 34

Acronyms – – – – – – AIRS = Atmospheric Infrared Sounder AMSU = Advanced Microwave Sounding Unit AR = Atmospheric River ATMS = Advanced Technology Microwave Sounder AVHRR = Advanced Very High Resolution Radiometer AWIPS = Advanced Weather Interactive Processing System AWT = Aviation Weather Testbed Cr. IS = Cross-track Infrared Sounder CIMMS = Cooperative Institute for Mesoscale Meteorological Studies CIMSS = Cooperative Institute for Meteorological Satellite Studies CSPP = (CIMSS) Community Satellite Processing Package CWA = (NWS) County Warning Area CWSU = (FAA) Center Weather Service Unit EUMETSAT = EUropean organization for exploitation of METeorological SATellites FOV/FOR = Field Of View/Regard GFS = (NCEP) Global Forecast System GSFC = (NASA) Goddard Space Flight Center HMT = Hydrometeorology Testbed HSB = Humidity Sounder Brazil HWT = Hazardous Weather Testbed IASI = Infrared Atmospheric Sounding Interferometer JPSS = Joint Polar Satellite System – – – – – – METOP = METeorological Observing Platform MHS = Microwave Humidity Sensor MODIS = MODerate resolution Imaging Spectroradiometer NASA = National Aeronautics and Space Administration NCEP = National Centers for Environmental Prediction NESDIS = National Environmental Satellite, Data, and Information Service NHC = (NCEP) National Hurricane Center NOAA = National Oceanographic and Atmospheric Administration NPP = National Polar-orbiting Partnership NWP = Numerical Weather Prediction NWS = National Weather Service NUCAPS = NOAA Unique Cr. IS/ATMS Processing System OPC = (NCEP) Ocean Prediction Center OSPO = (NESDIS) Office of Satellite and Product Operations SOO = Science Operations Officer SPC = (NCEP) Storm Prediction Center SPo. RT = (NASA) Short-term Prediction and Research Transition Center STAR = (NESDIS) Sa. Tellite Applications and Research STC = Science and Technology Corporation UMBC = University of Maryland, Baltimore County VIIRS = Visible Infrared Imaging Radiometer Suite WFO = (NWS) Weather Forecast Office WPC = (NCEP) Weather Prediction Center 35
 Questrom tools
 Restitution évaluations nationales cp
 Nau student evaluations
 Pharmacoeconomic evaluations amcp
 Nondiscriminatory evaluation
 Idea course evaluation
 Shsu idea evaluations
 Recent trends in ic engine
 Recent developments in ict
 Recent developments in object detection
 Is college worth it synthesis essay
 Recent trends in foreign trade
 Skim scan skip
 Recent trends in project management
 Recent demographic changes in the uk
 Myips.schoology.com
 Stippling
 After a skydiving accident laurie
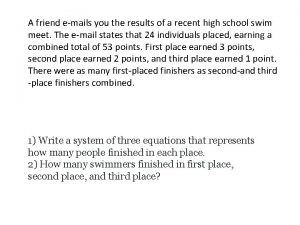
 A friend emails you the results of a recent high school
 Recent advances in ceramics
 Passive voice news
 Https://drive.google.com/drive/
 Udin generate icsi
 Recent trends in mis
 Mpgu
Mpgu Weber on status
 Project status summary
 Project status summary
 Physical motivation adalah
 Difference between progress report and status report
 Blau and duncan status attainment model
 Knowledge brings enlightenment and high status
 Sebutkan fungsi title bar
 Corpus planning and status planning slideshare
 Speech community in sociolinguistics
 Credit and status enquiries letter

