Nonparametric methods in statistical testing Douwe Postmus d

- Slides: 34
Non-parametric methods in statistical testing Douwe Postmus (d. postmus@umcg. nl)
Content • Comparison of a continuous outcome variable between two groups • Independent samples ─ ─ Student t-test (parametric) Mann-Whitney-Wilcoxon test (non-parametric) • Dependent samples ─ ─ 2 Paired samples t-test (parametric) Wilcoxon signed rank test (non-parametric)
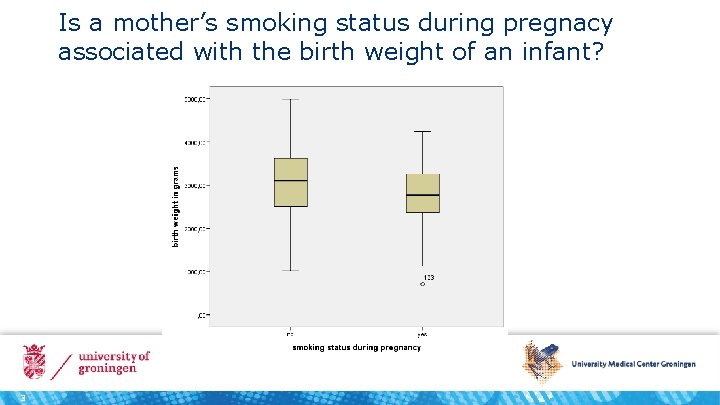
Is a mother’s smoking status during pregnacy associated with the birth weight of an infant? 3
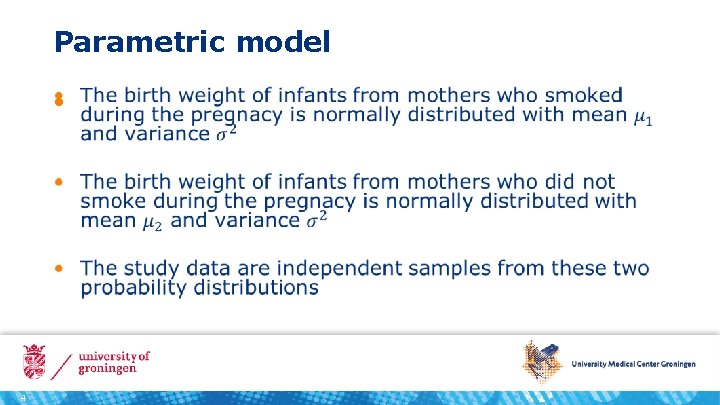
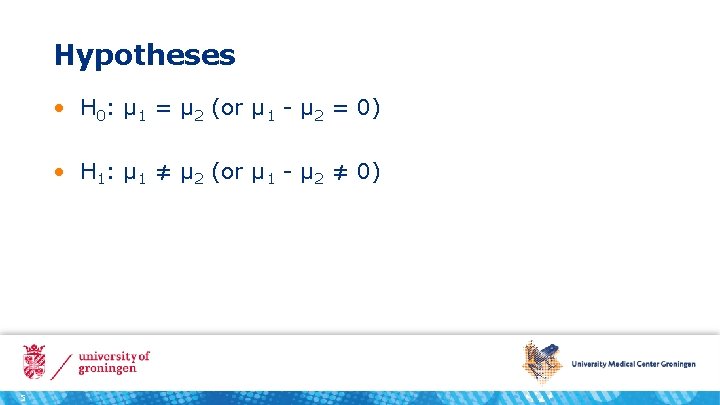
Parametric model • 4
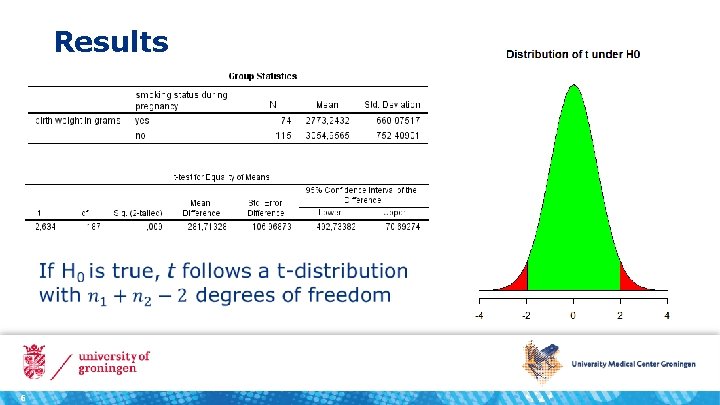
Results 6
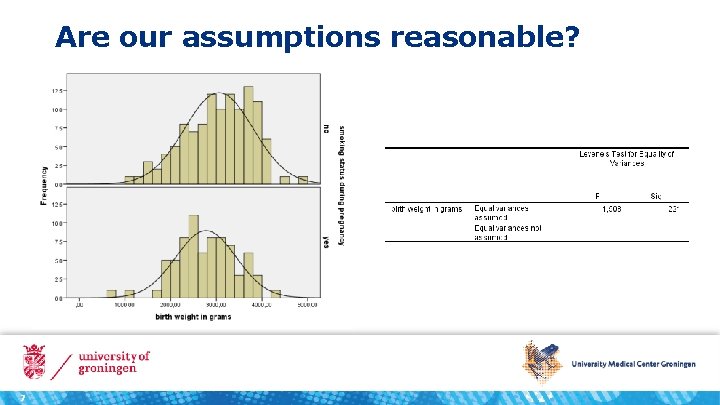
Are our assumptions reasonable? 7
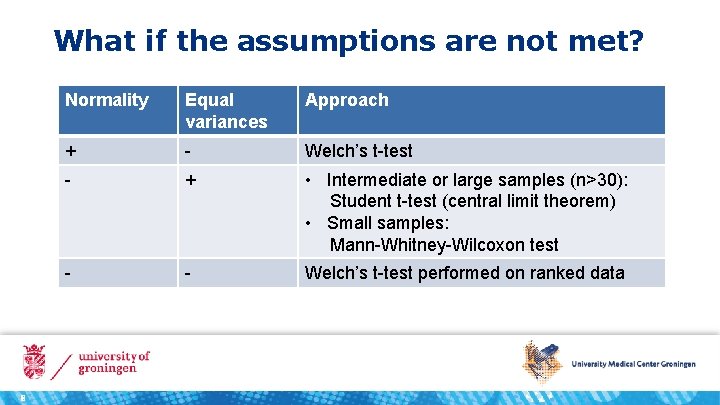
What if the assumptions are not met? 8 Normality Equal variances Approach + - Welch’s t-test - + • Intermediate or large samples (n>30): Student t-test (central limit theorem) • Small samples: Mann-Whitney-Wilcoxon test - - Welch’s t-test performed on ranked data
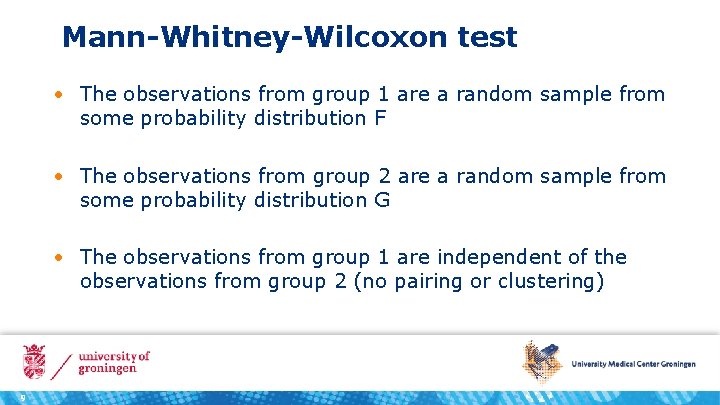
Mann-Whitney-Wilcoxon test • The observations from group 1 are a random sample from some probability distribution F • The observations from group 2 are a random sample from some probability distribution G • The observations from group 1 are independent of the observations from group 2 (no pairing or clustering) 9
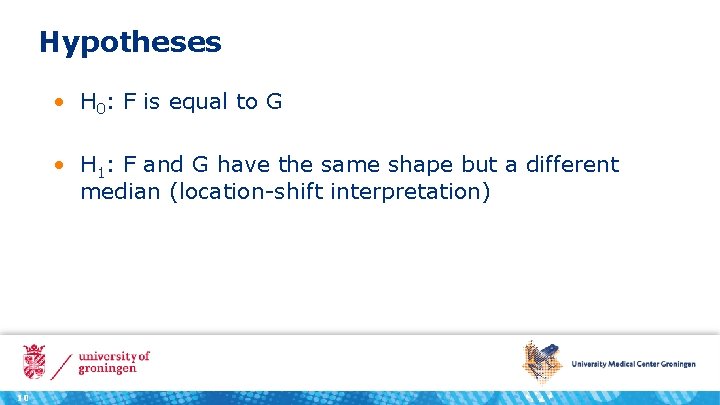
Hypotheses • H 0: F is equal to G • H 1: F and G have the same shape but a different median (location-shift interpretation) 10
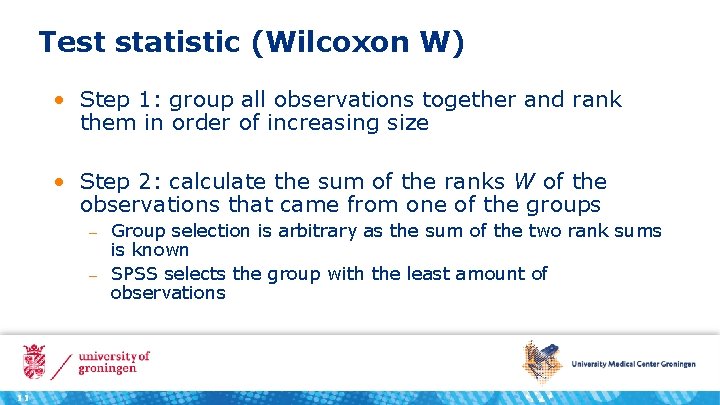
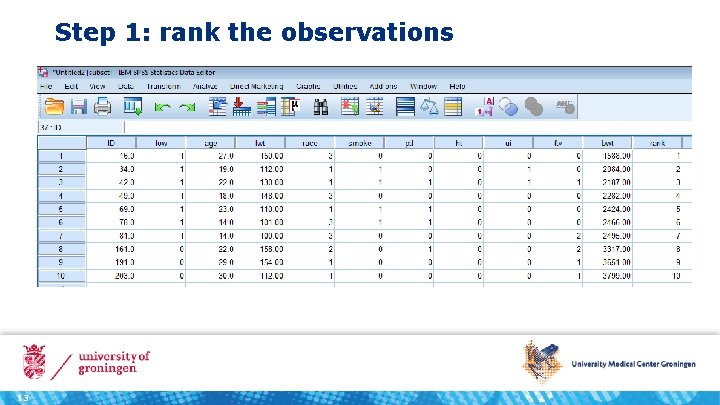
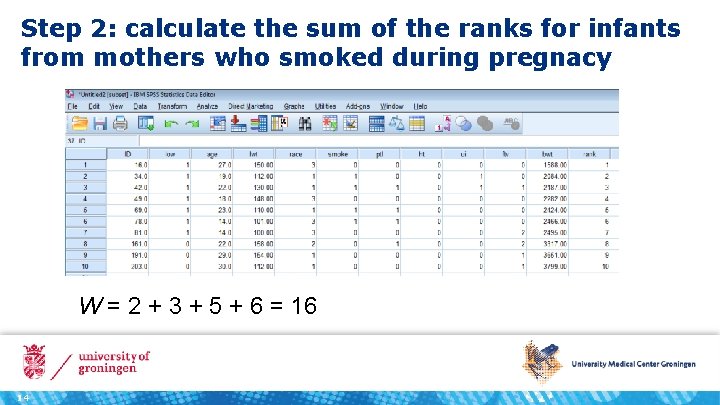
Test statistic (Wilcoxon W) • Step 1: group all observations together and rank them in order of increasing size • Step 2: calculate the sum of the ranks W of the observations that came from one of the groups ─ ─ 11 Group selection is arbitrary as the sum of the two rank sums is known SPSS selects the group with the least amount of observations
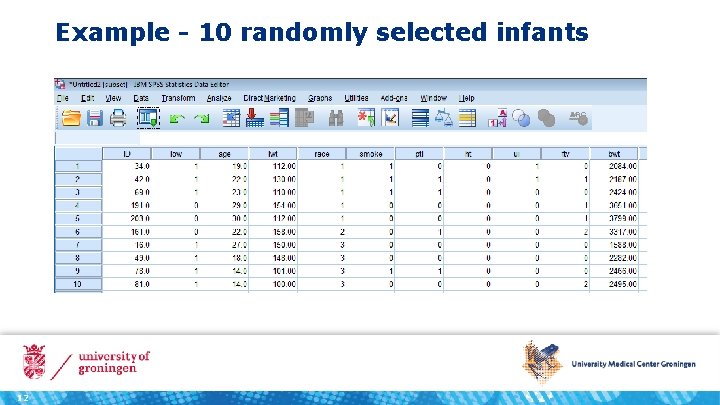
Example - 10 randomly selected infants 12
Step 1: rank the observations 13
Step 2: calculate the sum of the ranks for infants from mothers who smoked during pregnacy W = 2 + 3 + 5 + 6 = 16 14
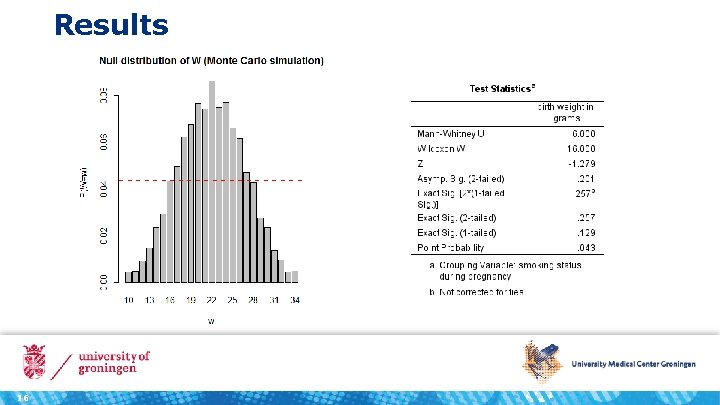
Distribution of W under H 0 • If H 0 is true, each assignment of ranks to the 10 infants is equally likely • In total, there are 10*9*8*…*1 = 10! = 3, 628, 800 possible ways to assign ranks to the 10 infants • The distribution of W is obtained by enumerating the rank sums for all of these assignments 15
Results 16
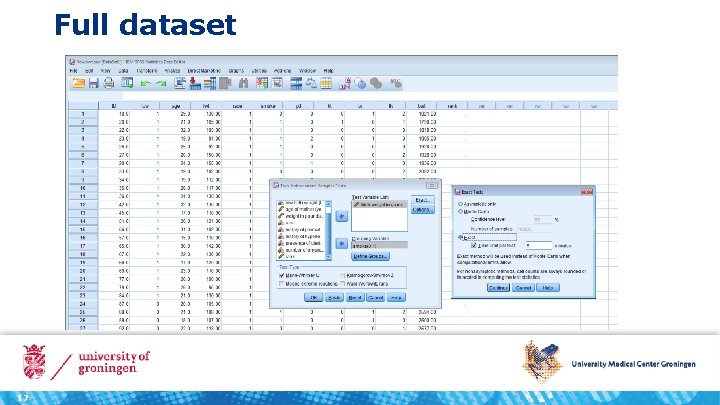
Full dataset 17
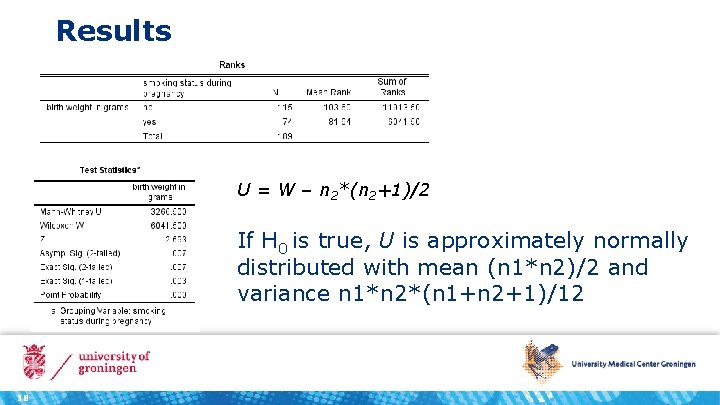
Results U = W – n 2*(n 2+1)/2 If H 0 is true, U is approximately normally distributed with mean (n 1*n 2)/2 and variance n 1*n 2*(n 1+n 2+1)/12 18
Content • Comparison of a continuous outcome variable between two groups • Independent samples ─ ─ Student t-test (parametric) Mann-Whitney-Wilcoxon test (non-parametric) • Dependent samples ─ ─ 19 Paired samples t-test (parametric) Wilcoxon signed rank test (non-parametric)
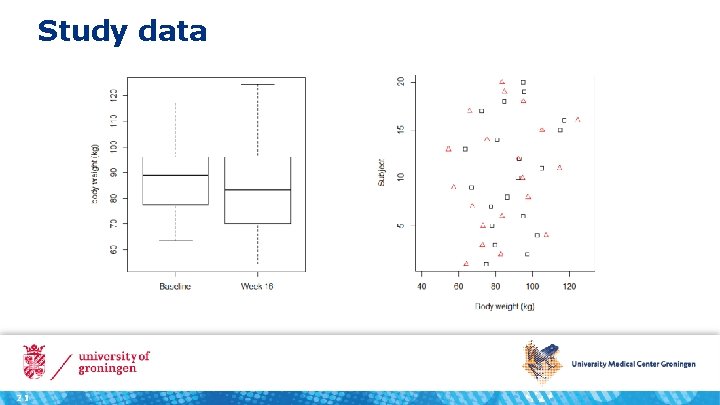
How effective is a low-carb diet? • Twenty subjects submitted to a low-carb diet • Two measurements per subject ─ ─ 20 Body weight at the start of the diet (kg) Body weight 16 weeks after the start of the diet (kg)
Study data 21
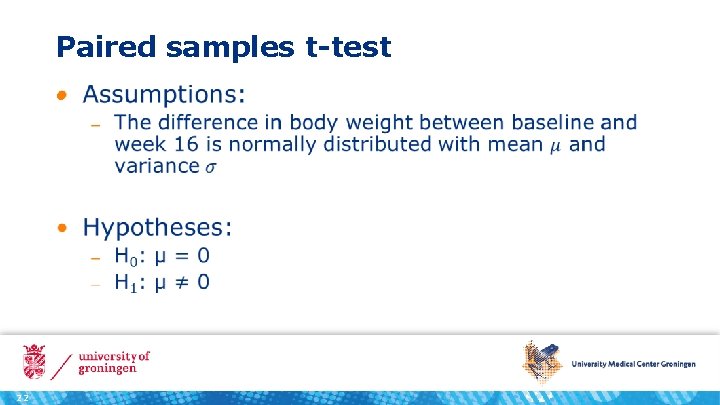
Paired samples t-test • 22
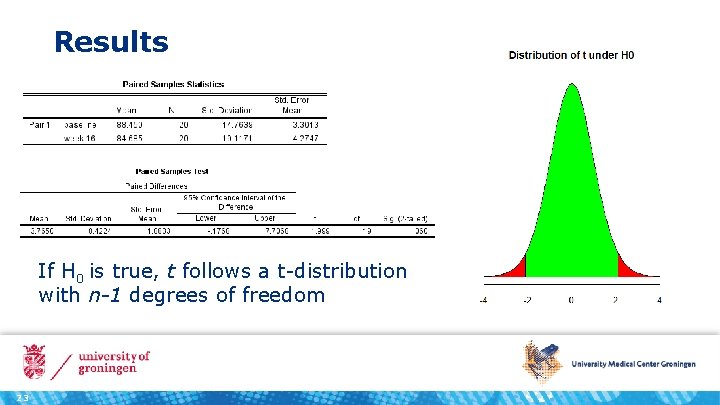
Results If H 0 is true, t follows a t-distribution with n-1 degrees of freedom 23
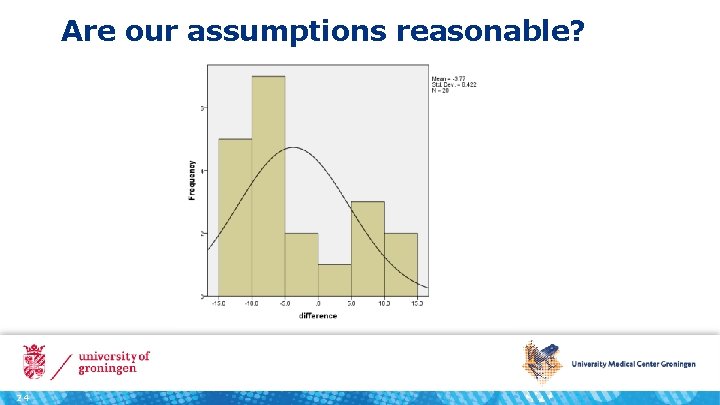
Are our assumptions reasonable? 24
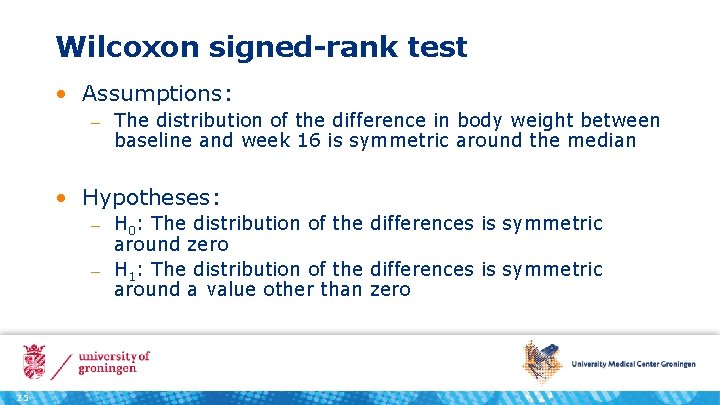
Wilcoxon signed-rank test • Assumptions: ─ The distribution of the difference in body weight between baseline and week 16 is symmetric around the median • Hypotheses: ─ ─ 25 H 0: The distribution of the differences is symmetric around zero H 1: The distribution of the differences is symmetric around a value other than zero
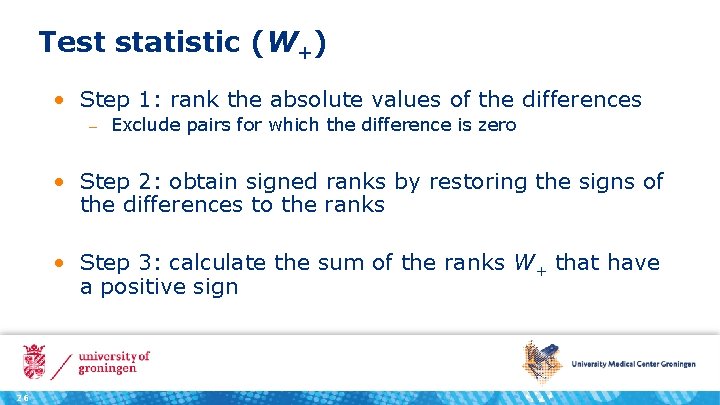
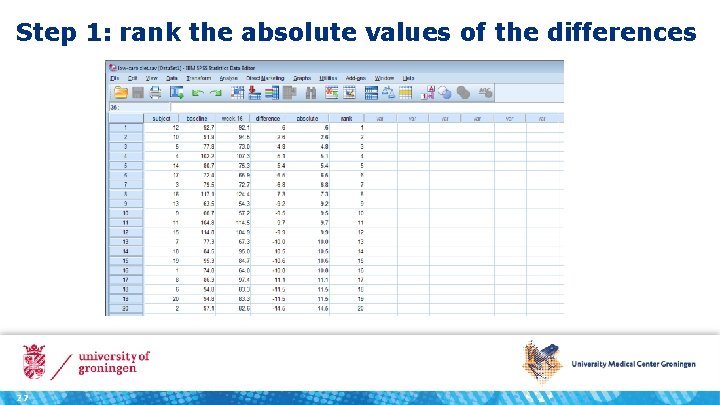
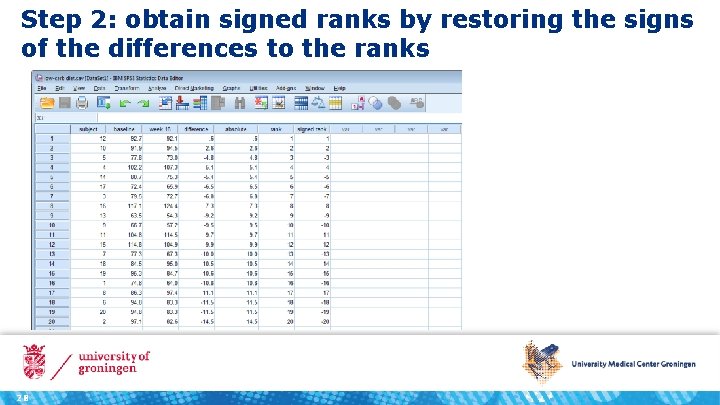
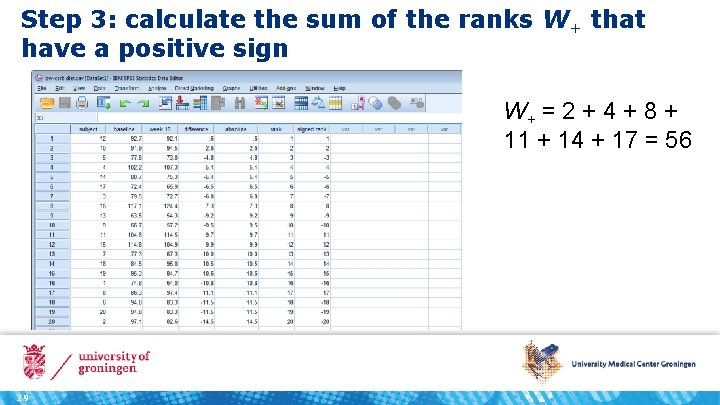
Test statistic (W+) • Step 1: rank the absolute values of the differences ─ Exclude pairs for which the difference is zero • Step 2: obtain signed ranks by restoring the signs of the differences to the ranks • Step 3: calculate the sum of the ranks W+ that have a positive sign 26
Step 1: rank the absolute values of the differences 27
Step 2: obtain signed ranks by restoring the signs of the differences to the ranks 28
Step 3: calculate the sum of the ranks W+ that have a positive sign W+ = 2 + 4 + 8 + 11 + 14 + 17 = 56 29
Distribution of W+ under H 0 • If H 0 is true, any particular assignment of signs to the 20 ranks is equally likely • In total, there are 220 = 1, 048, 576 possible ways to assigns to the 20 ranks • The distribution of W+ is obtained by enumerating the sum of the ranks that have a positive sign for all of these assignments 30
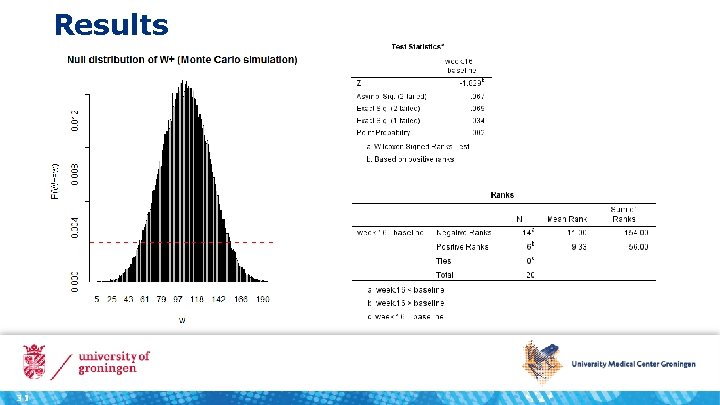
Results 31
Summary • Non-parametric methods do not assume that the data follow any particular distributional form • More generally applicable than the corresponding parametric models at the cost of a (slight) reduction in power • Non-parametric methods are not assumption free! 32
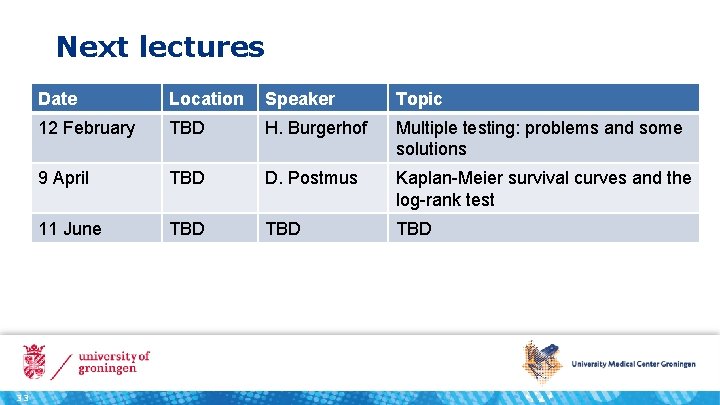
Next lectures 33 Date Location Speaker Topic 12 February TBD H. Burgerhof Multiple testing: problems and some solutions 9 April TBD D. Postmus Kaplan-Meier survival curves and the log-rank test 11 June TBD TBD
www. umcg. nl contact: d. postmus@umcg. nl 34