Multi Group Comparisons with Analysis of Variance ANOVA


- Slides: 28
Multi Group Comparisons with Analysis of Variance (ANOVA) BIOE April 28 th, 2016 1
Learning Objectives • What is ANOVA and when is it a useful tool? • What is the null hypothesis for ANOVA? • What are the assumptions for ANOVA? • What is a Kruskal-Wallis-Test and how is it related to ANOVA? • What is Post Hoc ANOVA Analysis? 2
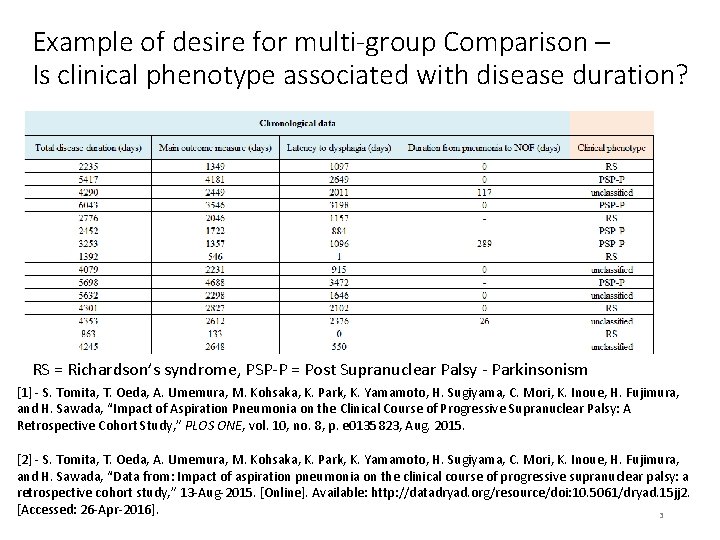
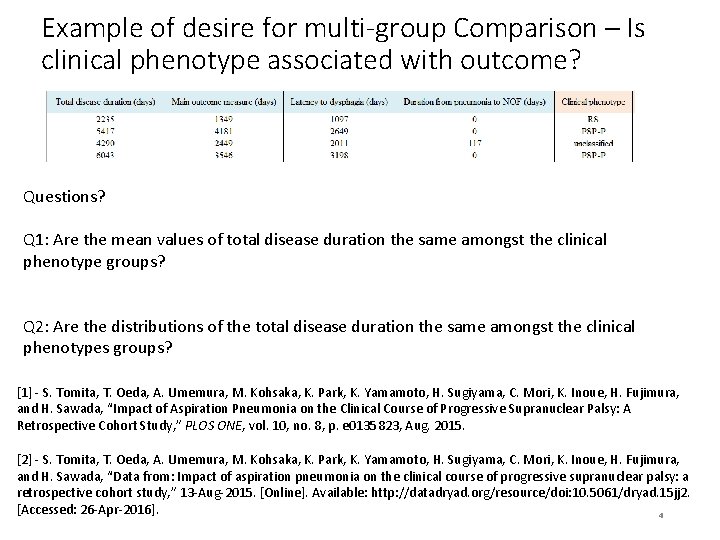
Example of desire for multi-group Comparison – Is clinical phenotype associated with disease duration? RS = Richardson’s syndrome, PSP-P = Post Supranuclear Palsy - Parkinsonism [1] - S. Tomita, T. Oeda, A. Umemura, M. Kohsaka, K. Park, K. Yamamoto, H. Sugiyama, C. Mori, K. Inoue, H. Fujimura, and H. Sawada, “Impact of Aspiration Pneumonia on the Clinical Course of Progressive Supranuclear Palsy: A Retrospective Cohort Study, ” PLOS ONE, vol. 10, no. 8, p. e 0135823, Aug. 2015. [2] - S. Tomita, T. Oeda, A. Umemura, M. Kohsaka, K. Park, K. Yamamoto, H. Sugiyama, C. Mori, K. Inoue, H. Fujimura, and H. Sawada, “Data from: Impact of aspiration pneumonia on the clinical course of progressive supranuclear palsy: a retrospective cohort study, ” 13 -Aug-2015. [Online]. Available: http: //datadryad. org/resource/doi: 10. 5061/dryad. 15 jj 2. [Accessed: 26 -Apr-2016]. 3
Example of desire for multi-group Comparison – Is clinical phenotype associated with outcome? Questions? Q 1: Are the mean values of total disease duration the same amongst the clinical phenotype groups? Q 2: Are the distributions of the total disease duration the same amongst the clinical phenotypes groups? [1] - S. Tomita, T. Oeda, A. Umemura, M. Kohsaka, K. Park, K. Yamamoto, H. Sugiyama, C. Mori, K. Inoue, H. Fujimura, and H. Sawada, “Impact of Aspiration Pneumonia on the Clinical Course of Progressive Supranuclear Palsy: A Retrospective Cohort Study, ” PLOS ONE, vol. 10, no. 8, p. e 0135823, Aug. 2015. [2] - S. Tomita, T. Oeda, A. Umemura, M. Kohsaka, K. Park, K. Yamamoto, H. Sugiyama, C. Mori, K. Inoue, H. Fujimura, and H. Sawada, “Data from: Impact of aspiration pneumonia on the clinical course of progressive supranuclear palsy: a retrospective cohort study, ” 13 -Aug-2015. [Online]. Available: http: //datadryad. org/resource/doi: 10. 5061/dryad. 15 jj 2. [Accessed: 26 -Apr-2016]. 4
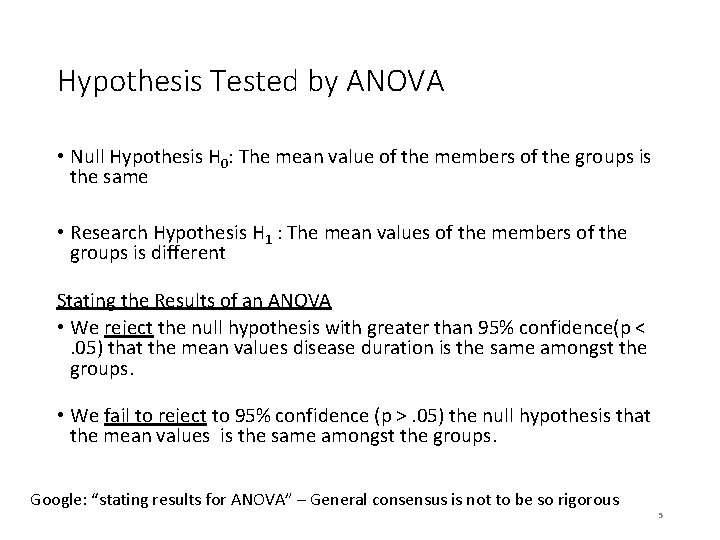
Hypothesis Tested by ANOVA • Null Hypothesis H 0: The mean value of the members of the groups is the same • Research Hypothesis H 1 : The mean values of the members of the groups is different Stating the Results of an ANOVA • We reject the null hypothesis with greater than 95% confidence(p <. 05) that the mean values disease duration is the same amongst the groups. • We fail to reject to 95% confidence (p >. 05) the null hypothesis that the mean values is the same amongst the groups. Google: “stating results for ANOVA” – General consensus is not to be so rigorous 5
Null Hypothesis for ANOVA H 0: The null hypothesis is that the mean value of total disease duration is the same amongst the clinical phenotype groups. 6
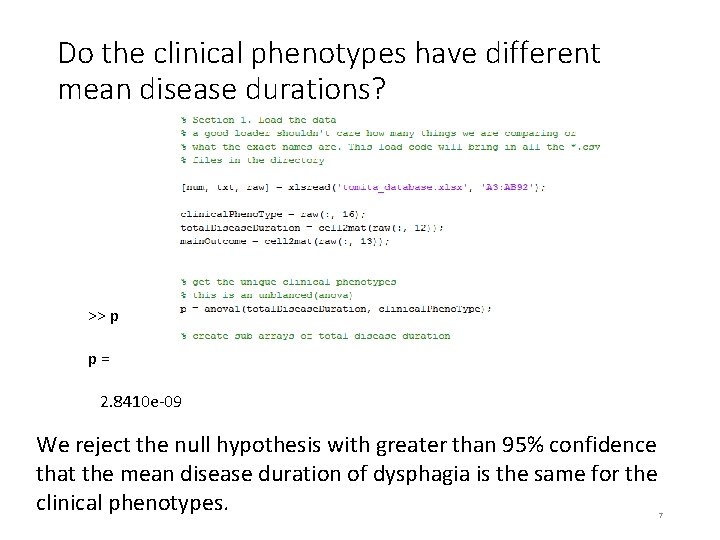
Do the clinical phenotypes have different mean disease durations? >> p p= 2. 8410 e-09 We reject the null hypothesis with greater than 95% confidence that the mean disease duration of dysphagia is the same for the clinical phenotypes. 7
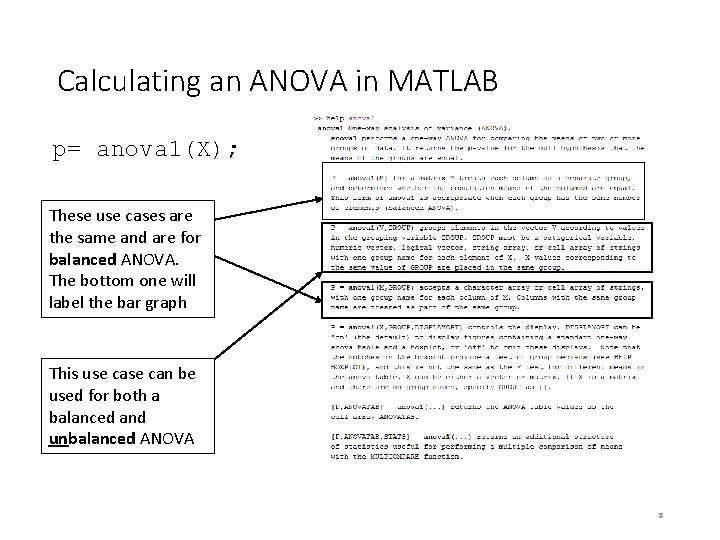
Calculating an ANOVA in MATLAB p= anova 1(X); These use cases are the same and are for balanced ANOVA. The bottom one will label the bar graph This use can be used for both a balanced and unbalanced ANOVA 8
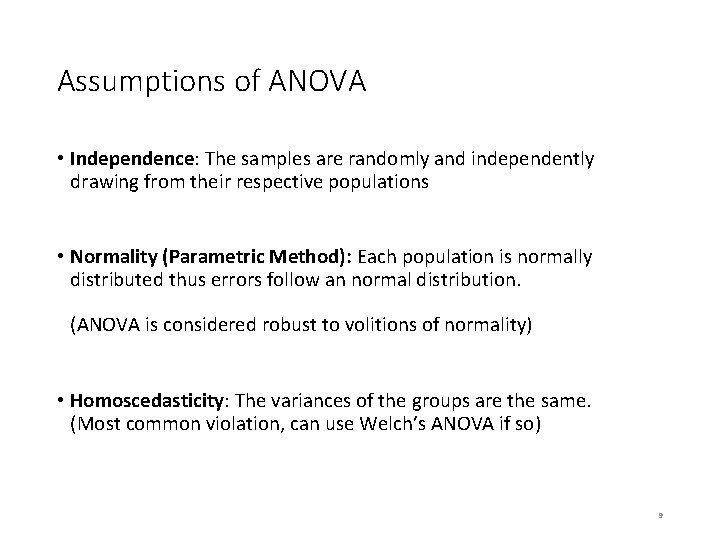
Assumptions of ANOVA • Independence: The samples are randomly and independently drawing from their respective populations • Normality (Parametric Method): Each population is normally distributed thus errors follow an normal distribution. (ANOVA is considered robust to volitions of normality) • Homoscedasticity: The variances of the groups are the same. (Most common violation, can use Welch’s ANOVA if so) 9
Checking for Normality of our data 10
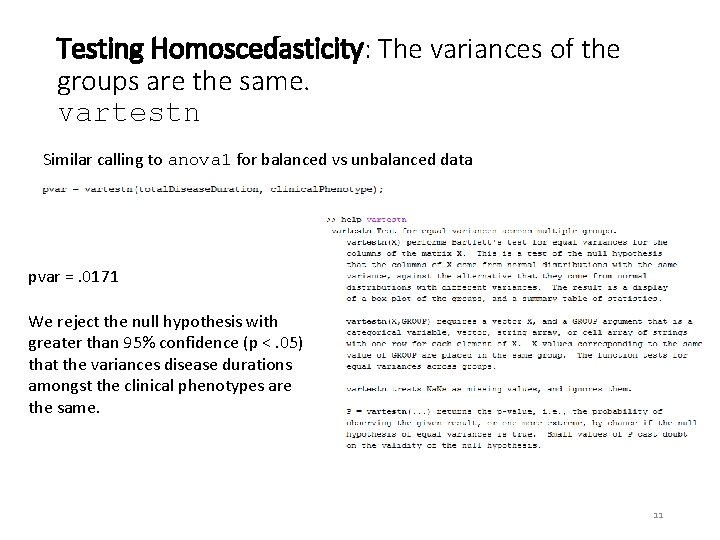
Testing Homoscedasticity: The variances of the groups are the same. vartestn Similar calling to anova 1 for balanced vs unbalanced data pvar =. 0171 We reject the null hypothesis with greater than 95% confidence (p <. 05) that the variances disease durations amongst the clinical phenotypes are the same. 11
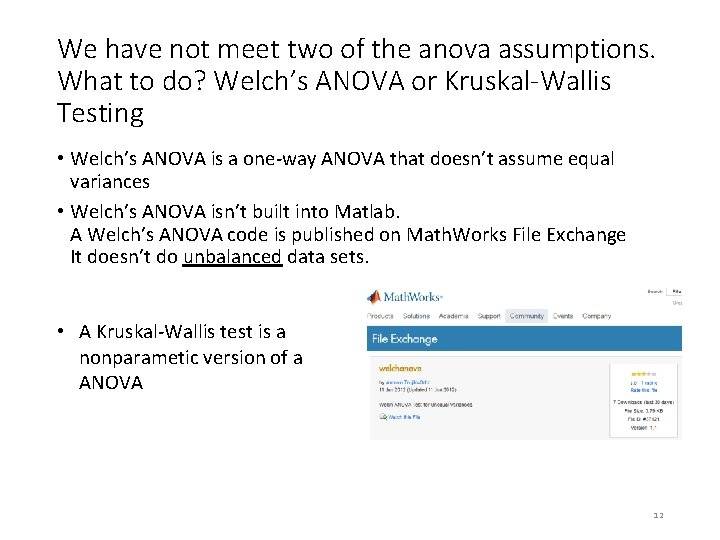
We have not meet two of the anova assumptions. What to do? Welch’s ANOVA or Kruskal-Wallis Testing • Welch’s ANOVA is a one-way ANOVA that doesn’t assume equal variances • Welch’s ANOVA isn’t built into Matlab. A Welch’s ANOVA code is published on Math. Works File Exchange It doesn’t do unbalanced data sets. • A Kruskal-Wallis test is a nonparametic version of a ANOVA 12
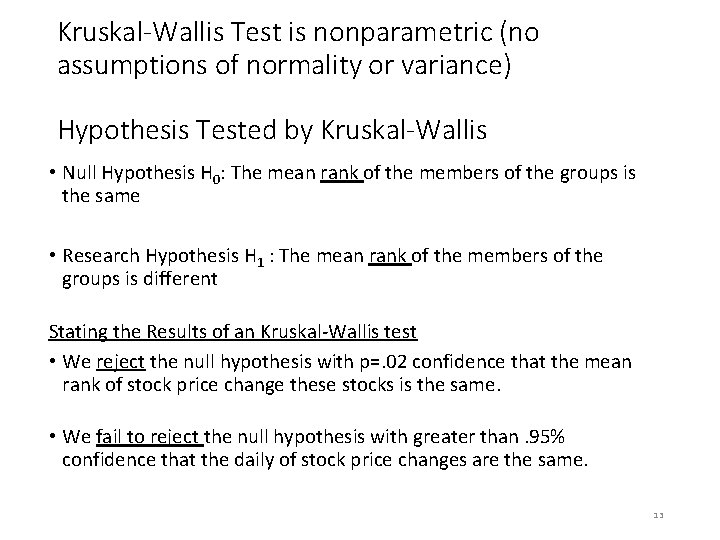
Kruskal-Wallis Test is nonparametric (no assumptions of normality or variance) Hypothesis Tested by Kruskal-Wallis • Null Hypothesis H 0: The mean rank of the members of the groups is the same • Research Hypothesis H 1 : The mean rank of the members of the groups is different Stating the Results of an Kruskal-Wallis test • We reject the null hypothesis with p=. 02 confidence that the mean rank of stock price change these stocks is the same. • We fail to reject the null hypothesis with greater than. 95% confidence that the daily of stock price changes are the same. 13
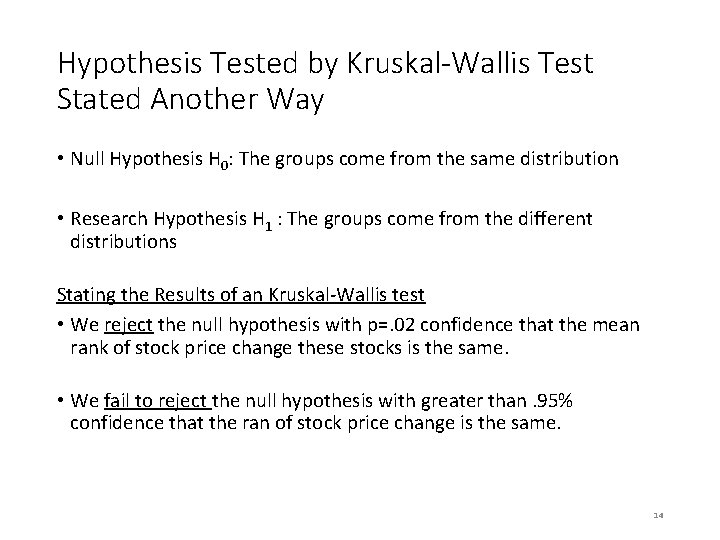
Hypothesis Tested by Kruskal-Wallis Test Stated Another Way • Null Hypothesis H 0: The groups come from the same distribution • Research Hypothesis H 1 : The groups come from the different distributions Stating the Results of an Kruskal-Wallis test • We reject the null hypothesis with p=. 02 confidence that the mean rank of stock price change these stocks is the same. • We fail to reject the null hypothesis with greater than. 95% confidence that the ran of stock price change is the same. 14
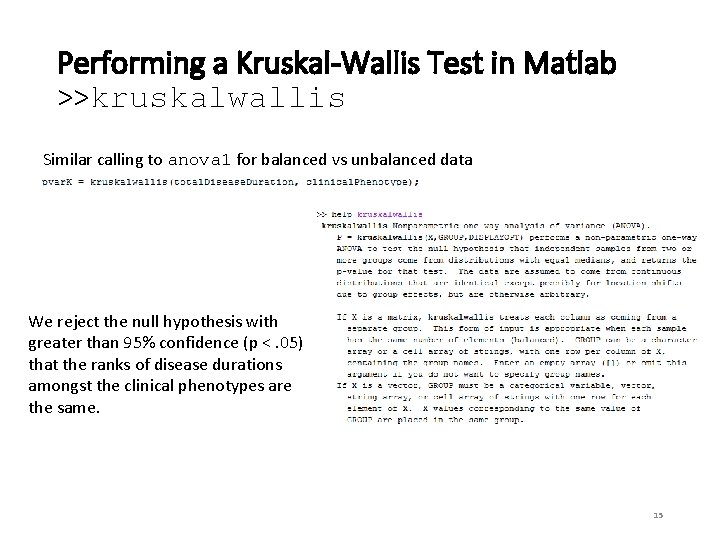
Performing a Kruskal-Wallis Test in Matlab >>kruskalwallis Similar calling to anova 1 for balanced vs unbalanced data We reject the null hypothesis with greater than 95% confidence (p <. 05) that the ranks of disease durations amongst the clinical phenotypes are the same. 15
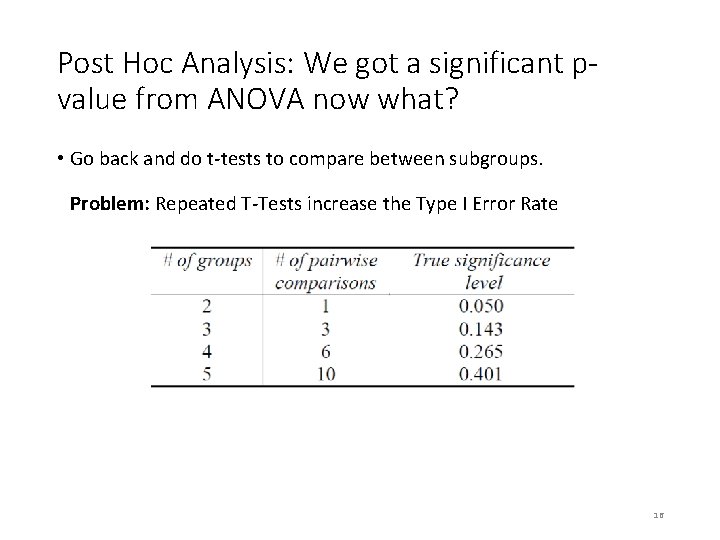
Post Hoc Analysis: We got a significant pvalue from ANOVA now what? • Go back and do t-tests to compare between subgroups. Problem: Repeated T-Tests increase the Type I Error Rate 16
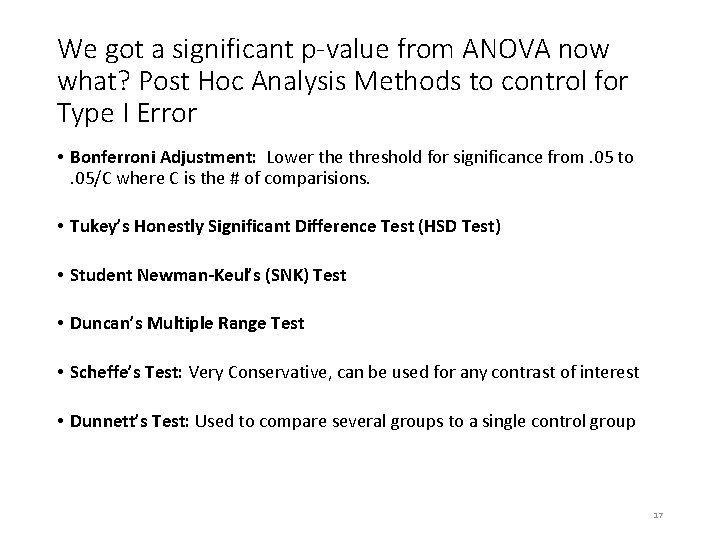
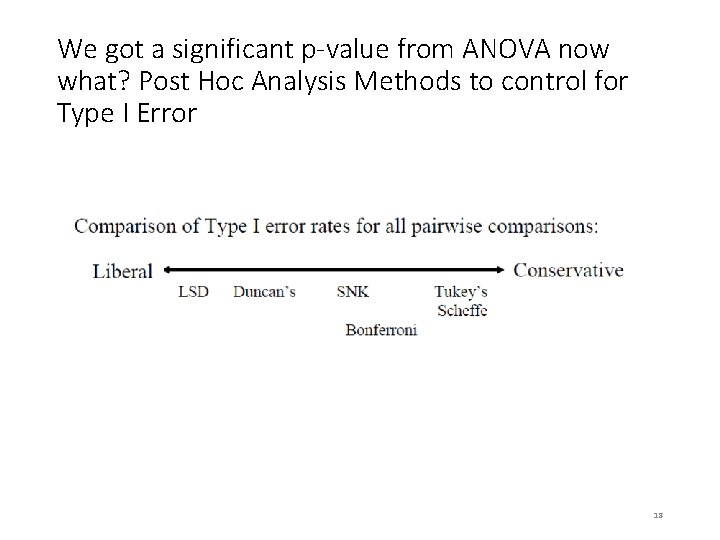
We got a significant p-value from ANOVA now what? Post Hoc Analysis Methods to control for Type I Error • Bonferroni Adjustment: Lower the threshold for significance from. 05 to. 05/C where C is the # of comparisions. • Tukey’s Honestly Significant Difference Test (HSD Test) • Student Newman-Keul’s (SNK) Test • Duncan’s Multiple Range Test • Scheffe’s Test: Very Conservative, can be used for any contrast of interest • Dunnett’s Test: Used to compare several groups to a single control group 17
We got a significant p-value from ANOVA now what? Post Hoc Analysis Methods to control for Type I Error 18
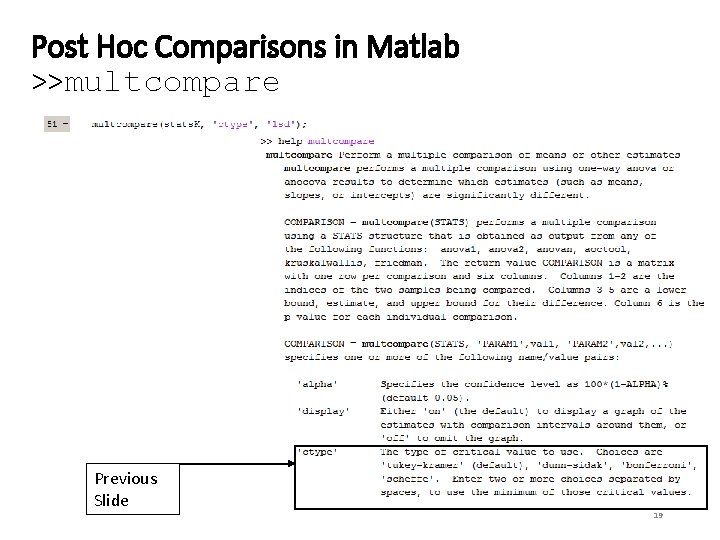
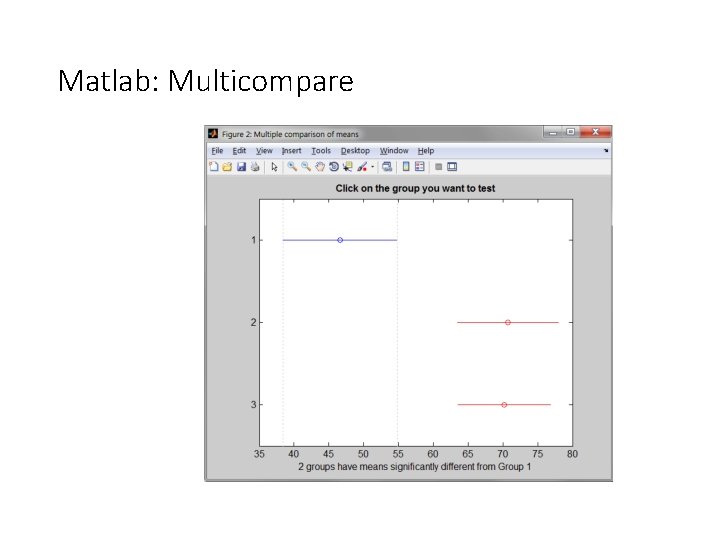
Post Hoc Comparisons in Matlab >>multcompare Previous Slide 19
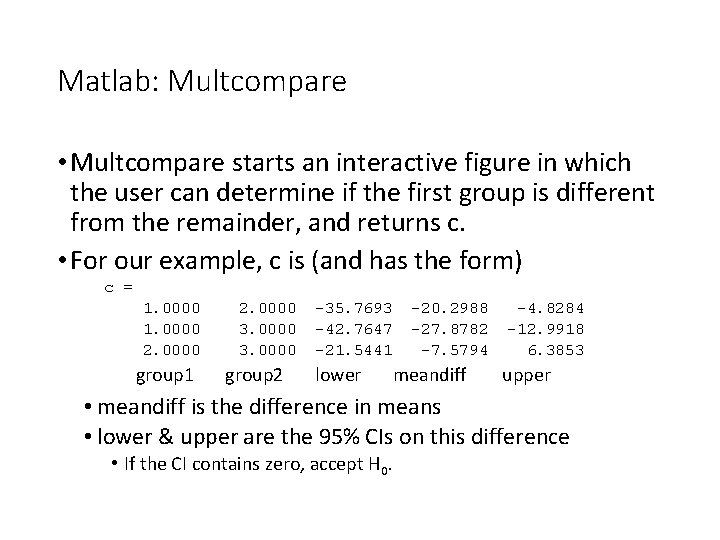
Matlab: Multcompare • Multcompare starts an interactive figure in which the user can determine if the first group is different from the remainder, and returns c. • For our example, c is (and has the form) c = 1. 0000 2. 0000 group 1 2. 0000 3. 0000 group 2 -35. 7693 -42. 7647 -21. 5441 lower -20. 2988 -27. 8782 -7. 5794 meandiff -4. 8284 -12. 9918 6. 3853 upper • meandiff is the difference in means • lower & upper are the 95% CIs on this difference • If the CI contains zero, accept H 0.
Matlab: Multicompare
Comments on Post Hoc Analysis Methods If you throw enough darts at the board you are bound to hit it (Type I Error). • There is controversy over the use of post-hoc analysis. Some researchers use them all the time others never • Post-Hoc Analysis can inflate type II error rates. 23
2 - (or n-) Way ANOVA • An extension of ANOVA to two or more independent variables (factors). • Consider number of years to cancer onset in a smoking study • As start with a 1× 6 design: • non, passive, pipe, light, moderate, heavy • Can do 1 way ANOVA here. • Add sex of the smoker: M/F • Becomes a 2× 6 design – variation due to degree of smoking and due to sex of the smoker – Can ask 2 way anova questions. • anova 2 in or anovan matlab
2 - (or n-) Way ANOVA There are 3 Hypotheses Under Test • H 0: 1 – There is no mean difference in the number of years to cancer onset amongst smoking types (Same as 1 way anova) 2 – There is no mean difference in the number of years to cancer onset amongst the sexes (Same as 1 way anova) 3 – There is no interaction effect between the sexes, smoking and number of years to cancer onset. (Additional Hypothesis)
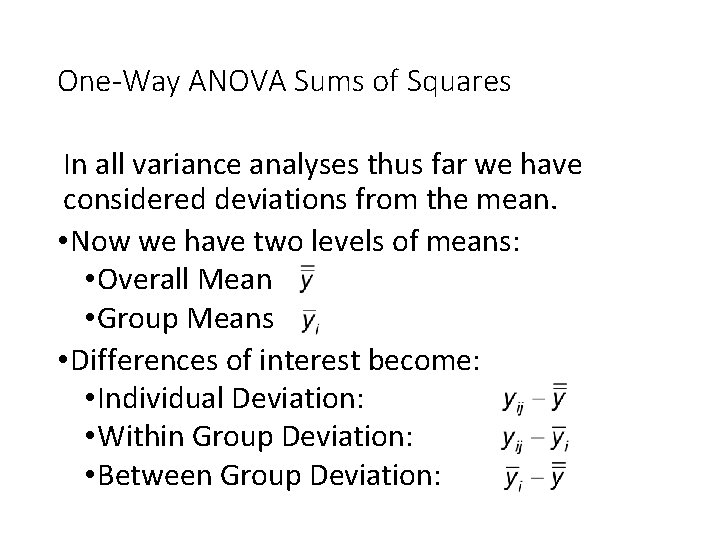
One-Way ANOVA Sums of Squares In all variance analyses thus far we have considered deviations from the mean. • Now we have two levels of means: • Overall Mean y • Group Means y • Differences of interest become: • Individual Deviation: • Within Group Deviation: • Between Group Deviation:
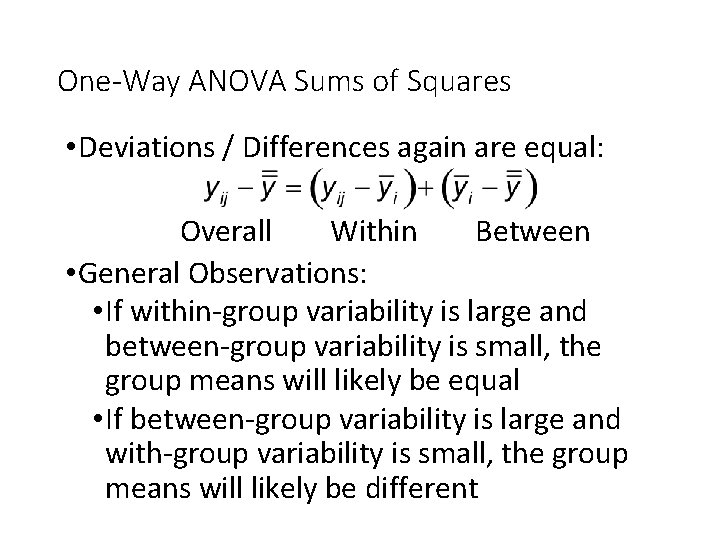
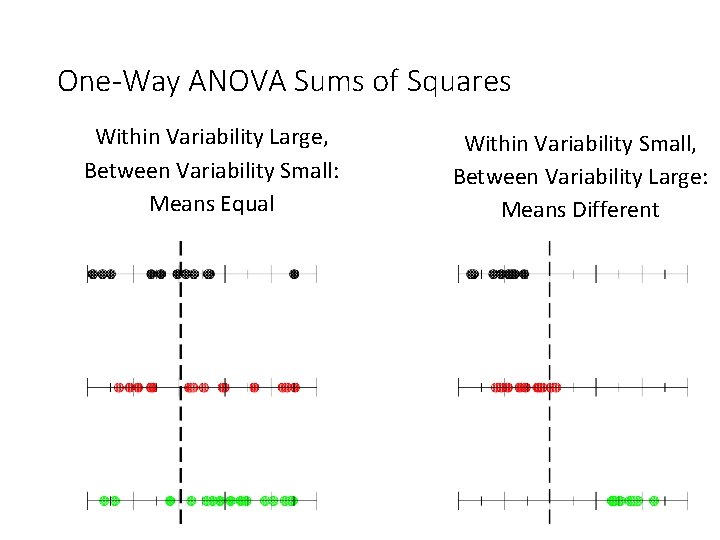
One-Way ANOVA Sums of Squares • Deviations / Differences again are equal: Overall Within Between • General Observations: • If within-group variability is large and between-group variability is small, the group means will likely be equal • If between-group variability is large and with-group variability is small, the group means will likely be different
One-Way ANOVA Sums of Squares Within Variability Large, Between Variability Small: Means Equal Within Variability Small, Between Variability Large: Means Different
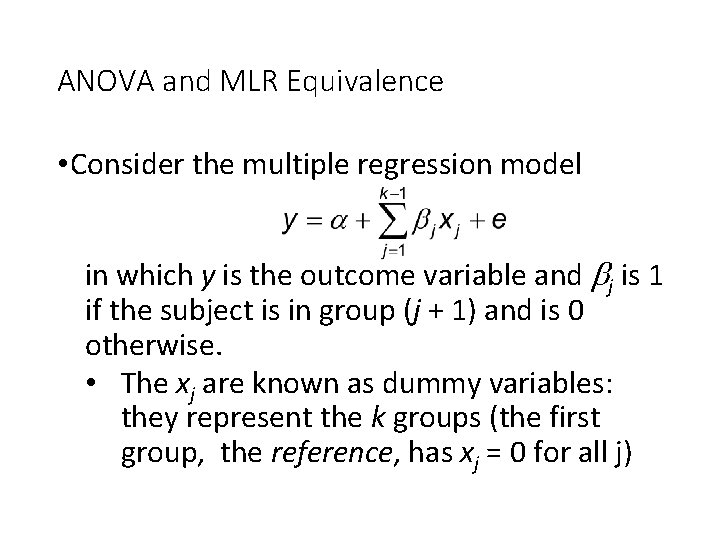
ANOVA and MLR Equivalence • Consider the multiple regression model in which y is the outcome variable and bj is 1 if the subject is in group (j + 1) and is 0 otherwise. • The xj are known as dummy variables: they represent the k groups (the first group, the reference, has xj = 0 for all j)