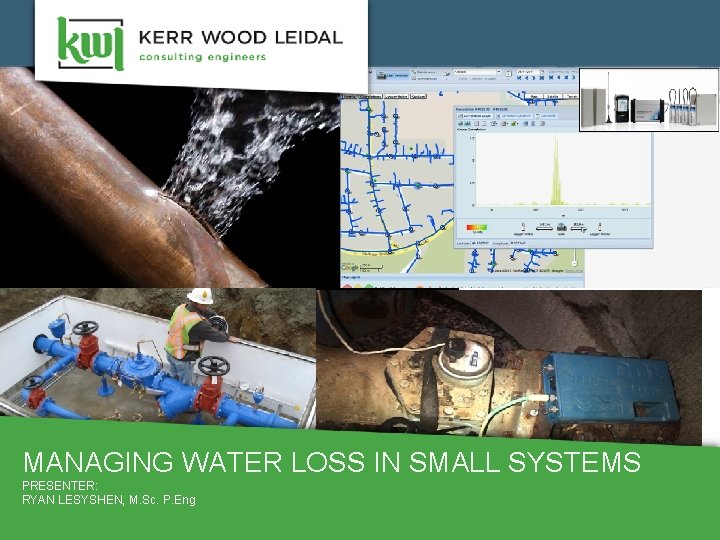
MANAGING WATER LOSS IN SMALL SYSTEMS PRESENTER RYAN

- Slides: 28
MANAGING WATER LOSS IN SMALL SYSTEMS PRESENTER: RYAN LESYSHEN, M. Sc. P. Eng
A bit about me… 2 Ryan Lesyshen M. Sc. , P. Eng 2003 - 2005 Completed Masters related to Watermain Leak Detection at University of Saskatchewan 0 2005 - 2007 Work in New Zealand including finding leaks, implementing pressure management and big stormwater projects. 2007 - 2017 Work for KWL. Water loss management plans, audits, condition assessment, water system master planning, infrastructure design and construction. APRIL 7, 2017
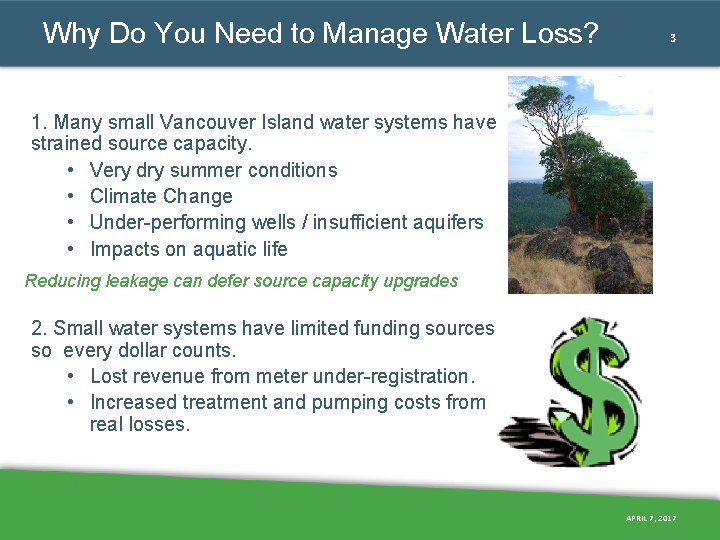
Why Do You Need to Manage Water Loss? 3 1. Many small Vancouver Island water systems have strained source capacity. • Very dry summer conditions • Climate Change • Under-performing wells / insufficient aquifers • Impacts on aquatic life Reducing leakage can defer source capacity upgrades 2. Small water systems have limited funding sources so every dollar counts. • Lost revenue from meter under-registration. • Increased treatment and pumping costs from real losses. APRIL 7, 2017
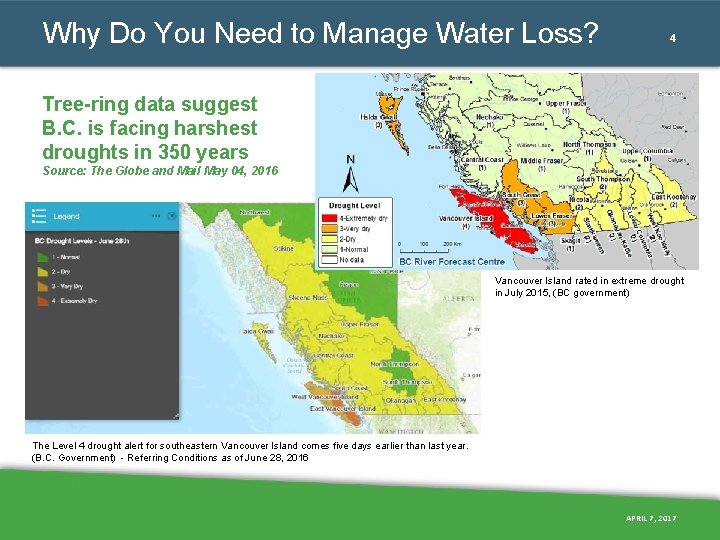
Why Do You Need to Manage Water Loss? 4 Tree-ring data suggest B. C. is facing harshest droughts in 350 years Source: The Globe and Mail May 04, 2016 Vancouver Island rated in extreme drought in July 2015, (BC government) The Level 4 drought alert for southeastern Vancouver Island comes five days earlier than last year. (B. C. Government) - Referring Conditions as of June 28, 2016 APRIL 7, 2017
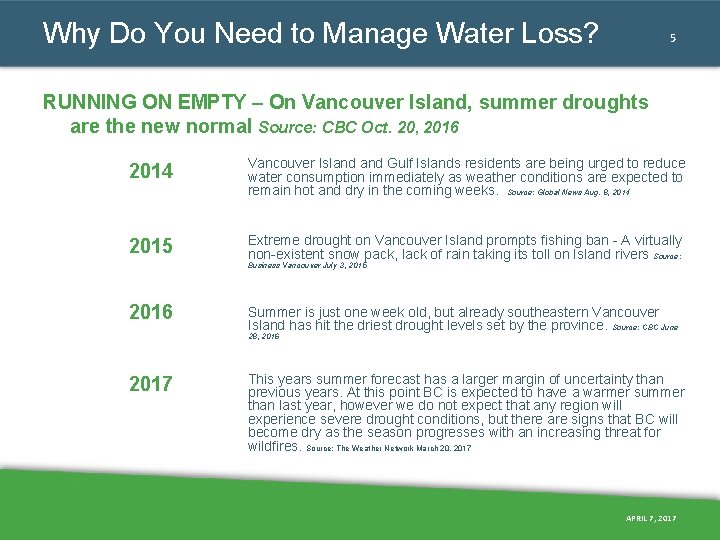
Why Do You Need to Manage Water Loss? 5 RUNNING ON EMPTY – On Vancouver Island, summer droughts are the new normal Source: CBC Oct. 20, 2016 2014 Vancouver Island Gulf Islands residents are being urged to reduce water consumption immediately as weather conditions are expected to remain hot and dry in the coming weeks. Source: Global News Aug. 8, 2014 2015 Extreme drought on Vancouver Island prompts fishing ban - A virtually non-existent snow pack, lack of rain taking its toll on Island rivers Source: Business Vancouver July 3, 2015 2016 Summer is just one week old, but already southeastern Vancouver Island has hit the driest drought levels set by the province. Source: CBC June 28, 2016 2017 This years summer forecast has a larger margin of uncertainty than previous years. At this point BC is expected to have a warmer summer than last year, however we do not expect that any region will experience severe drought conditions, but there are signs that BC will become dry as the season progresses with an increasing threat for wildfires. Source: The Weather Network March 20, 2017 APRIL 7, 2017
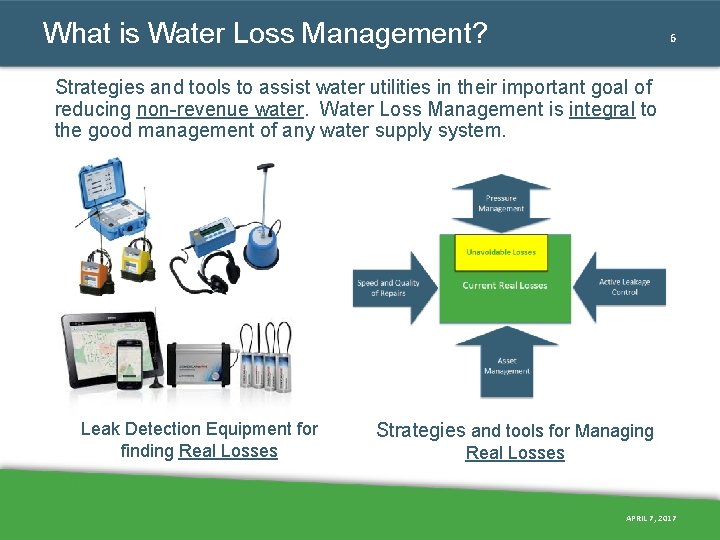
What is Water Loss Management? 6 Strategies and tools to assist water utilities in their important goal of reducing non-revenue water. Water Loss Management is integral to the good management of any water supply system. Leak Detection Equipment for finding Real Losses Strategies and tools for Managing Real Losses APRIL 7, 2017
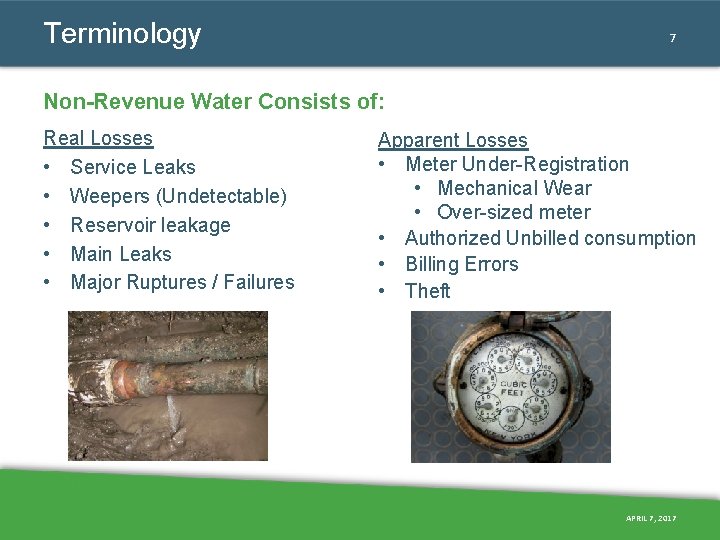
Terminology 7 Non-Revenue Water Consists of: Real Losses • Service Leaks • Weepers (Undetectable) • Reservoir leakage • Main Leaks • Major Ruptures / Failures Apparent Losses • Meter Under-Registration • Mechanical Wear • Over-sized meter • Authorized Unbilled consumption • Billing Errors • Theft APRIL 7, 2017
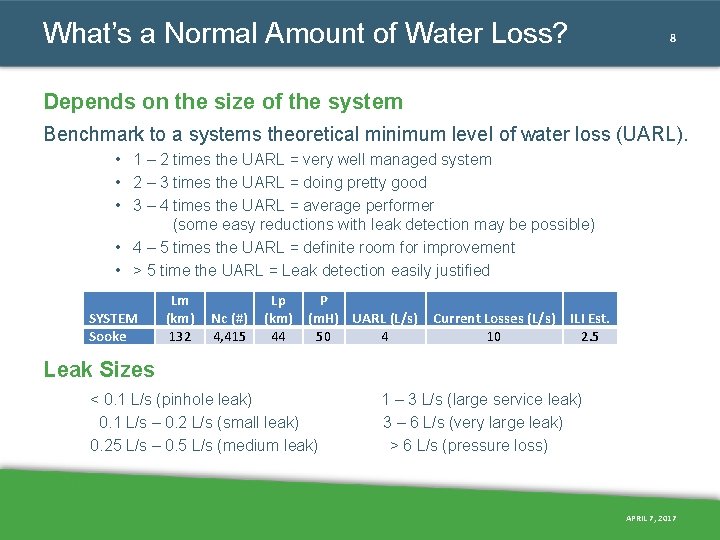
What’s a Normal Amount of Water Loss? 8 Depends on the size of the system Benchmark to a systems theoretical minimum level of water loss (UARL). • 1 – 2 times the UARL = very well managed system • 2 – 3 times the UARL = doing pretty good • 3 – 4 times the UARL = average performer (some easy reductions with leak detection may be possible) • 4 – 5 times the UARL = definite room for improvement • > 5 time the UARL = Leak detection easily justified SYSTEM Sooke Lm (km) 132 Nc (#) 4, 415 Lp (km) 44 P (m. H) UARL (L/s) 50 4 Current Losses (L/s) ILI Est. 10 2. 5 Leak Sizes < 0. 1 L/s (pinhole leak) 1 – 3 L/s (large service leak) 0. 1 L/s – 0. 2 L/s (small leak) 3 – 6 L/s (very large leak) 0. 25 L/s – 0. 5 L/s (medium leak) > 6 L/s (pressure loss) APRIL 7, 2017
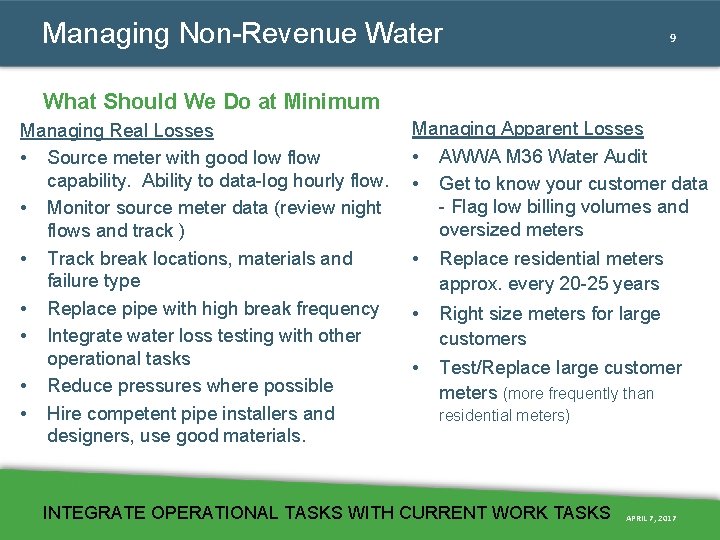
Managing Non-Revenue Water 9 What Should We Do at Minimum Managing Real Losses • Source meter with good low flow capability. Ability to data-log hourly flow. • Monitor source meter data (review night flows and track ) • Track break locations, materials and failure type • Replace pipe with high break frequency • Integrate water loss testing with other operational tasks • Reduce pressures where possible • Hire competent pipe installers and designers, use good materials. Managing Apparent Losses • AWWA M 36 Water Audit • Get to know your customer data - Flag low billing volumes and oversized meters • Replace residential meters approx. every 20 -25 years • Right size meters for large customers • Test/Replace large customer meters (more frequently than residential meters) INTEGRATE OPERATIONAL TASKS WITH CURRENT WORK TASKS APRIL 7, 2017
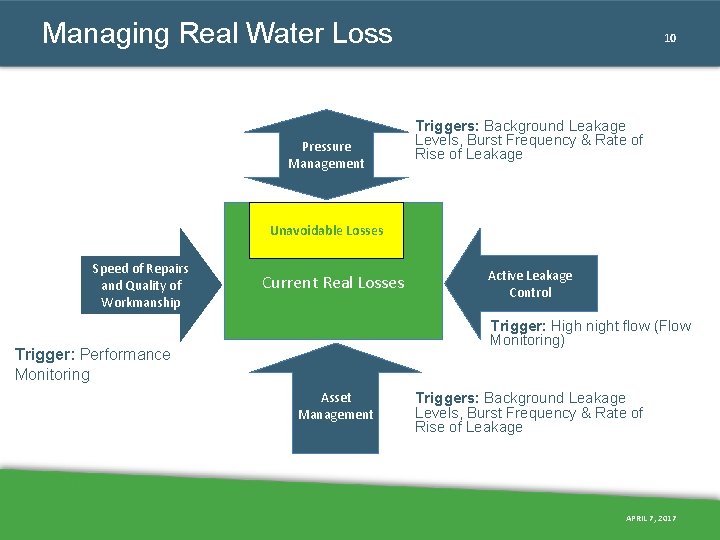
Managing Real Water Loss Pressure Management 10 Triggers: Background Leakage Levels, Burst Frequency & Rate of Rise of Leakage Unavoidable Losses Speed of Repairs and Quality of Workmanship Current Real Losses Active Leakage Control Trigger: High night flow (Flow Monitoring) Trigger: Performance Monitoring Asset Management Triggers: Background Leakage Levels, Burst Frequency & Rate of Rise of Leakage APRIL 7, 2017
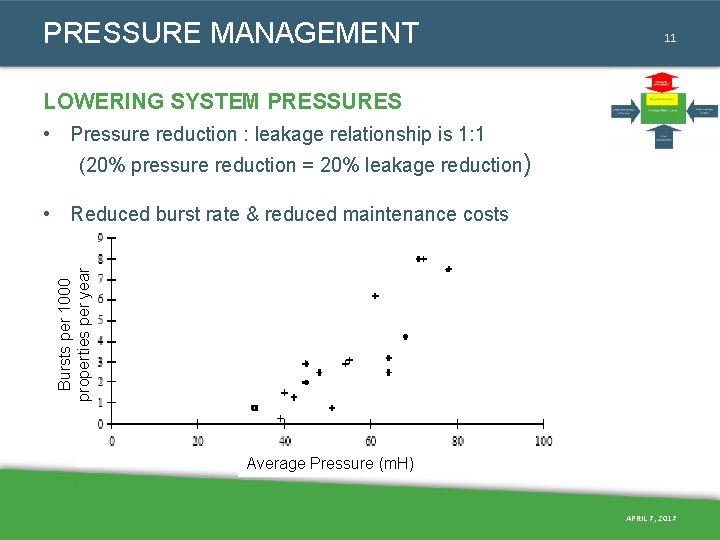
PRESSURE MANAGEMENT 11 LOWERING SYSTEM PRESSURES • Pressure reduction : leakage relationship is 1: 1 (20% pressure reduction = 20% leakage reduction) Bursts per 1000 properties per year • Reduced burst rate & reduced maintenance costs Average Pressure (m. H) APRIL 7, 2017
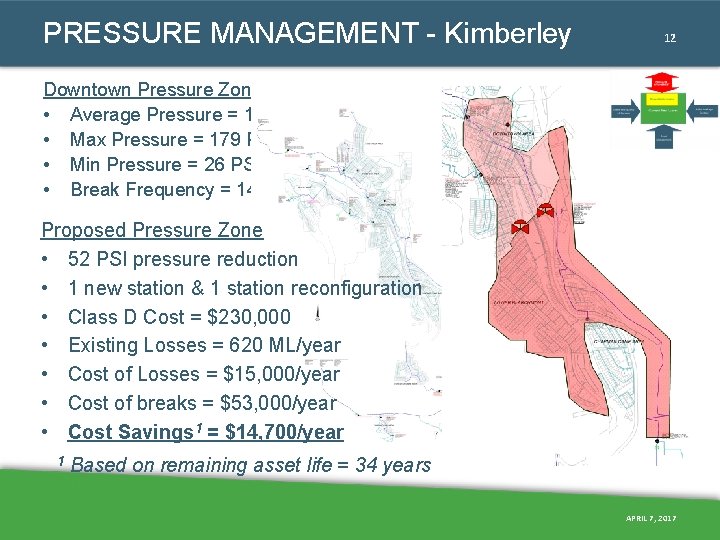
PRESSURE MANAGEMENT - Kimberley 12 Downtown Pressure Zone • Average Pressure = 102 PSI • Max Pressure = 179 PSI • Min Pressure = 26 PSI • Break Frequency = 14 / 100 km / year Proposed Pressure Zone • 52 PSI pressure reduction • 1 new station & 1 station reconfiguration • Class D Cost = $230, 000 • Existing Losses = 620 ML/year • Cost of Losses = $15, 000/year • Cost of breaks = $53, 000/year • Cost Savings 1 = $14, 700/year 1 Based on remaining asset life = 34 years APRIL 7, 2017
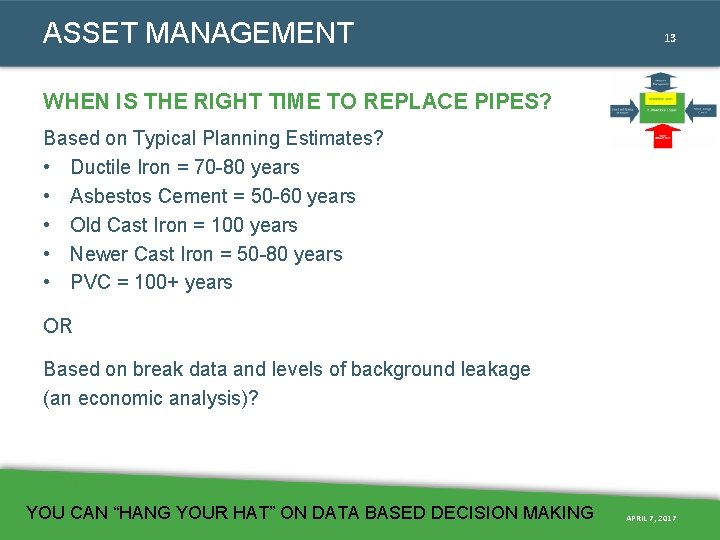
ASSET MANAGEMENT 13 WHEN IS THE RIGHT TIME TO REPLACE PIPES? Based on Typical Planning Estimates? • Ductile Iron = 70 -80 years • Asbestos Cement = 50 -60 years • Old Cast Iron = 100 years • Newer Cast Iron = 50 -80 years • PVC = 100+ years OR Based on break data and levels of background leakage (an economic analysis)? YOU CAN “HANG YOUR HAT” ON DATA BASED DECISION MAKING APRIL 7, 2017
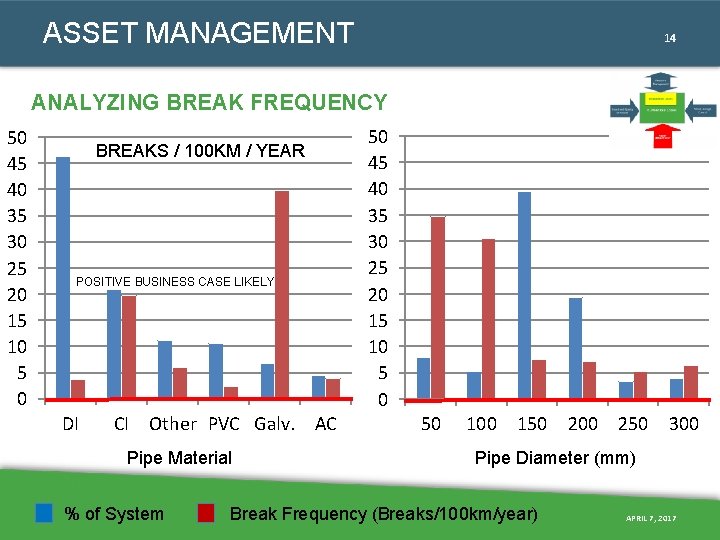
ASSET MANAGEMENT 14 ANALYZING BREAK FREQUENCY 50 45 40 35 30 25 20 15 10 5 0 BREAKS / 100 KM / YEAR POSITIVE BUSINESS CASE LIKELY DI CI Other PVC Galv. AC Pipe Material 50 45 40 35 30 25 20 15 10 5 0 50 100 150 200 250 300 Pipe Diameter (mm) % of System Break Frequency (Breaks/100 km/year) APRIL 7, 2017
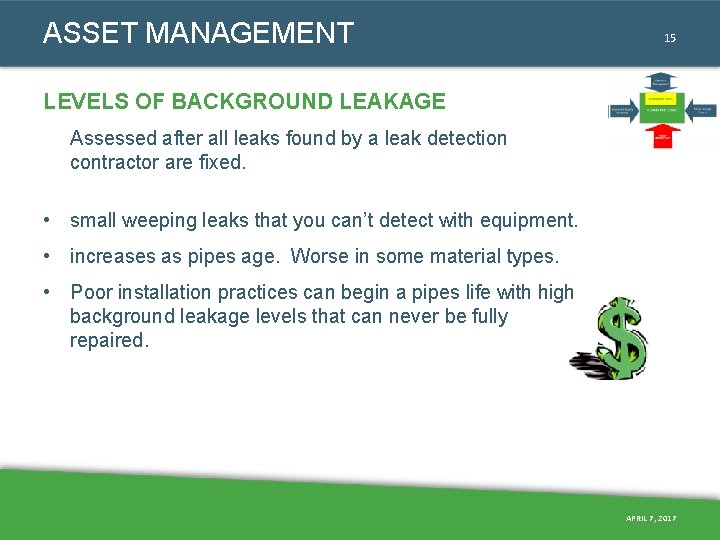
ASSET MANAGEMENT 15 LEVELS OF BACKGROUND LEAKAGE Assessed after all leaks found by a leak detection contractor are fixed. • small weeping leaks that you can’t detect with equipment. • increases as pipes age. Worse in some material types. • Poor installation practices can begin a pipes life with high background leakage levels that can never be fully repaired. APRIL 7, 2017
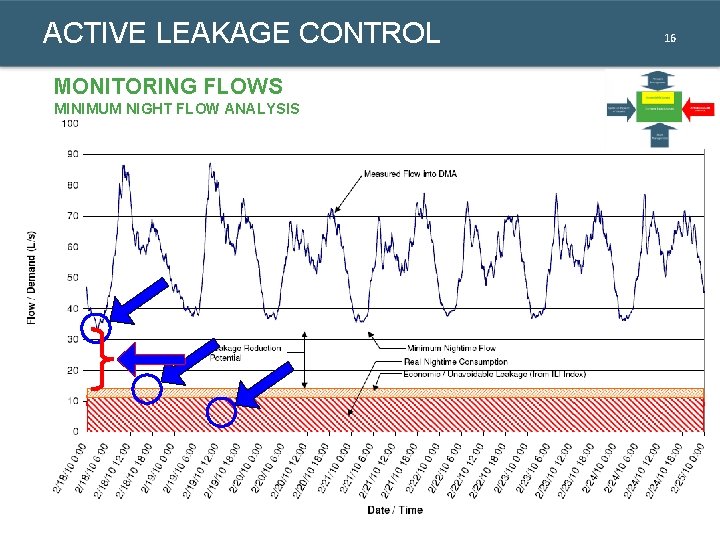
ACTIVE LEAKAGE CONTROL 16 MONITORING FLOWS MINIMUM NIGHT FLOW ANALYSIS APRIL 7, 2017
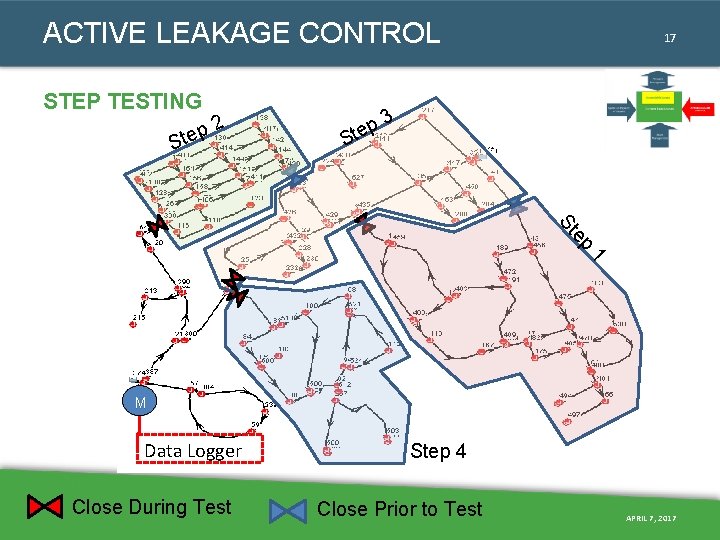
ACTIVE LEAKAGE CONTROL STEP TESTING 2 p e t S 17 3 p Ste 1 ep St M Data Logger Close During Test Step 4 Close Prior to Test 17 APRIL 7, 2017
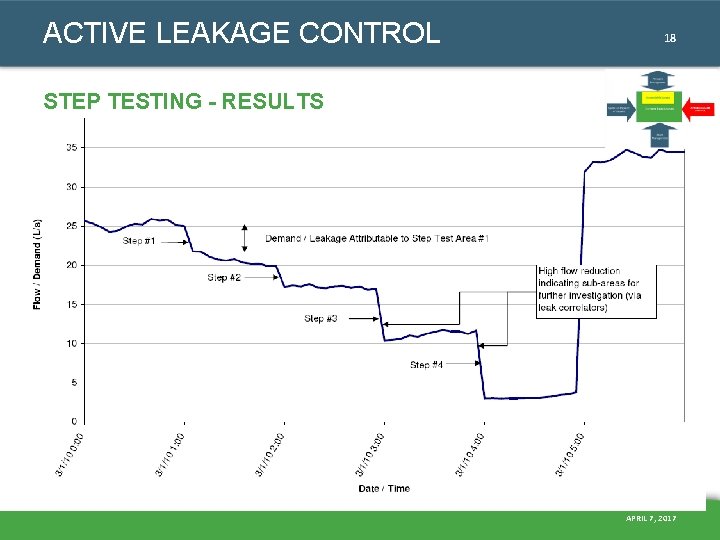
ACTIVE LEAKAGE CONTROL 18 STEP TESTING - RESULTS APRIL 7, 2017
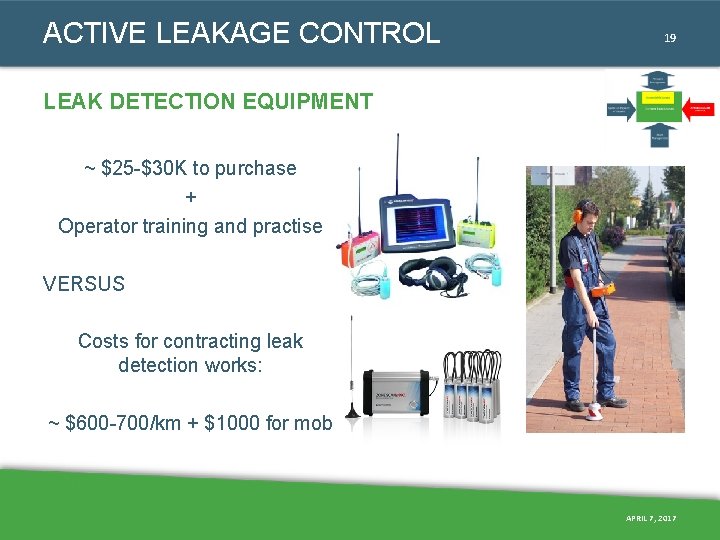
ACTIVE LEAKAGE CONTROL 19 LEAK DETECTION EQUIPMENT ~ $25 -$30 K to purchase + Operator training and practise VERSUS Costs for contracting leak detection works: ~ $600 -700/km + $1000 for mob APRIL 7, 2017
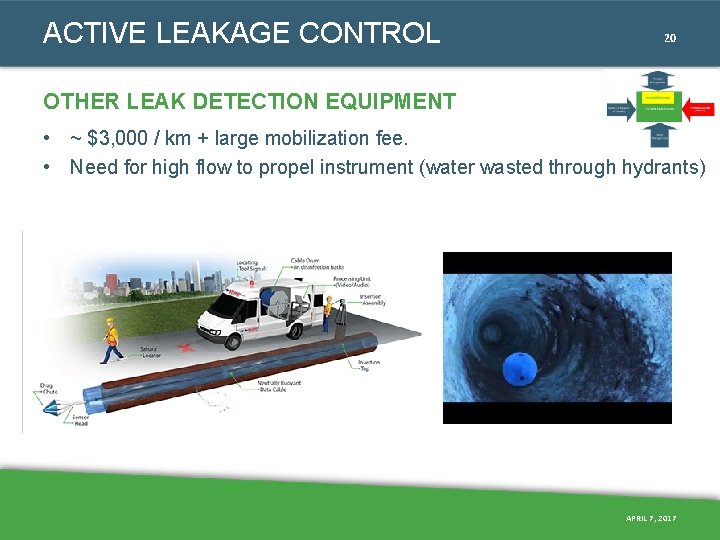
ACTIVE LEAKAGE CONTROL 20 OTHER LEAK DETECTION EQUIPMENT • ~ $3, 000 / km + large mobilization fee. • Need for high flow to propel instrument (water wasted through hydrants) APRIL 7, 2017
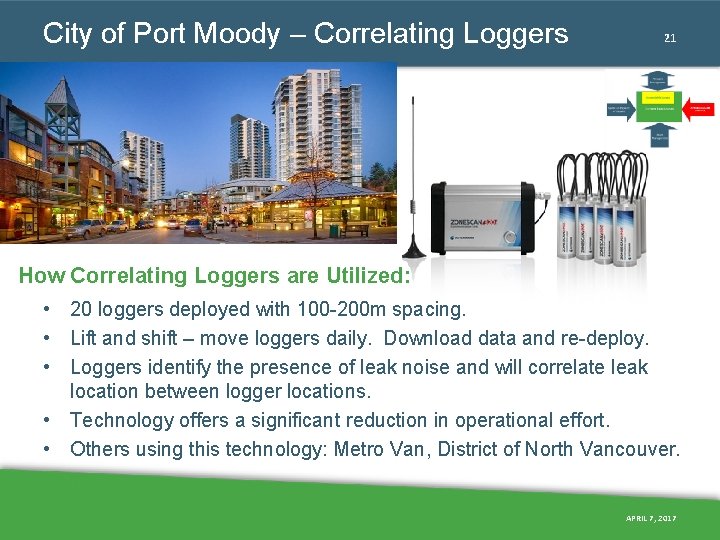
City of Port Moody – Correlating Loggers 21 How Correlating Loggers are Utilized: • 20 loggers deployed with 100 -200 m spacing. • Lift and shift – move loggers daily. Download data and re-deploy. • Loggers identify the presence of leak noise and will correlate leak location between logger locations. • Technology offers a significant reduction in operational effort. • Others using this technology: Metro Van, District of North Vancouver. APRIL 7, 2017
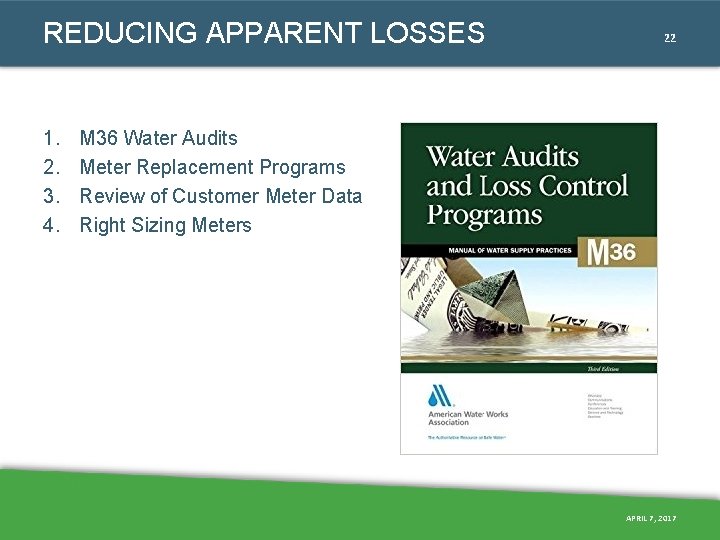
REDUCING APPARENT LOSSES 1. 2. 3. 4. 22 M 36 Water Audits Meter Replacement Programs Review of Customer Meter Data Right Sizing Meters APRIL 7, 2017
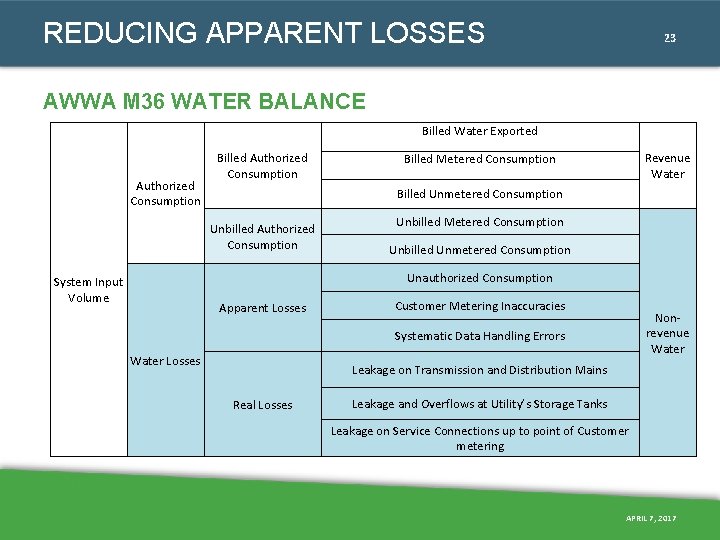
REDUCING APPARENT LOSSES 23 AWWA M 36 WATER BALANCE Billed Water Exported Authorized Consumption Billed Authorized Consumption Revenue Water Billed Metered Consumption Billed Unmetered Consumption Unbilled Authorized Consumption Unbilled Metered Consumption Unbilled Unmetered Consumption Unauthorized Consumption System Input Volume Apparent Losses Customer Metering Inaccuracies Nonrevenue Water Systematic Data Handling Errors Water Losses Leakage on Transmission and Distribution Mains Real Losses Leakage and Overflows at Utility’s Storage Tanks Leakage on Service Connections up to point of Customer metering APRIL 7, 2017
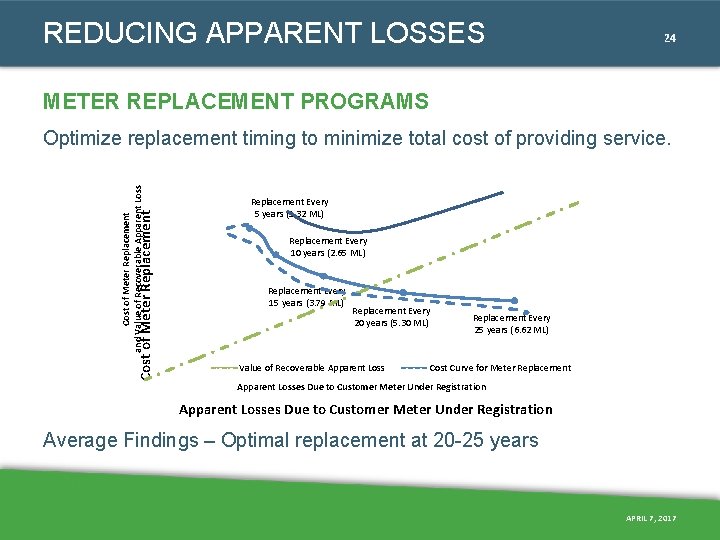
REDUCING APPARENT LOSSES 24 METER REPLACEMENT PROGRAMS Cost of Meter Replacement and Value of Recoverable Apparent Loss Optimize replacement timing to minimize total cost of providing service. Replacement Every 5 years (1. 32 ML) Replacement Every 10 years (2. 65 ML) Replacement Every 15 years (3. 79 ML) Replacement Every 20 years (5. 30 ML) Value of Recoverable Apparent Loss Replacement Every 25 years (6. 62 ML) Cost Curve for Meter Replacement Apparent Losses Due to Customer Meter Under Registration Average Findings – Optimal replacement at 20 -25 years APRIL 7, 2017
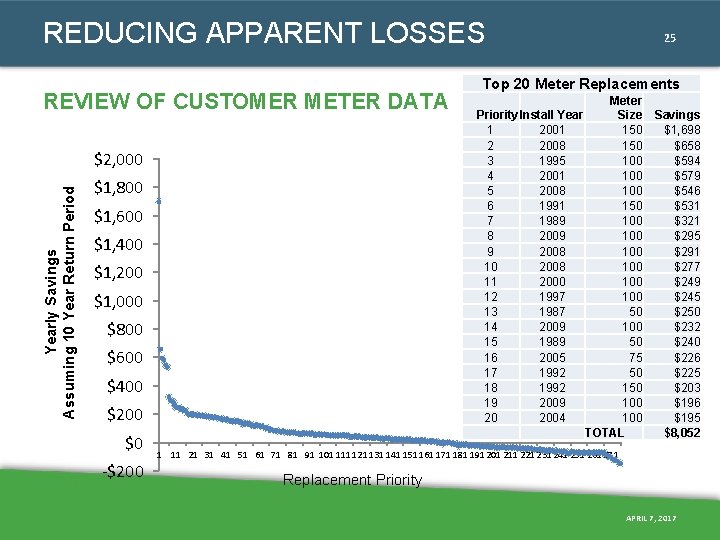
REDUCING APPARENT LOSSES REVIEW OF CUSTOMER METER DATA Yearly Savings Assuming 10 Year Return Period $2, 000 $1, 800 $1, 600 $1, 400 $1, 200 $1, 000 $800 $600 $400 $200 $0 -$200 25 Top 20 Meter Replacements Priority. Install Year 1 2001 2 2008 3 1995 4 2001 5 2008 6 1991 7 1989 8 2009 9 2008 10 2008 11 2000 12 1997 13 1987 14 2009 15 1989 16 2005 17 1992 18 1992 19 2009 20 2004 Meter Size 150 100 100 100 50 75 50 100 100 TOTAL Savings $1, 698 $658 $594 $579 $546 $531 $321 $295 $291 $277 $249 $245 $250 $232 $240 $226 $225 $203 $196 $195 $8, 052 1 11 21 31 41 51 61 71 81 91 101 111 121 131 141 151 161 171 181 191 201 211 221 231 241 251 261 271 Replacement Priority APRIL 7, 2017
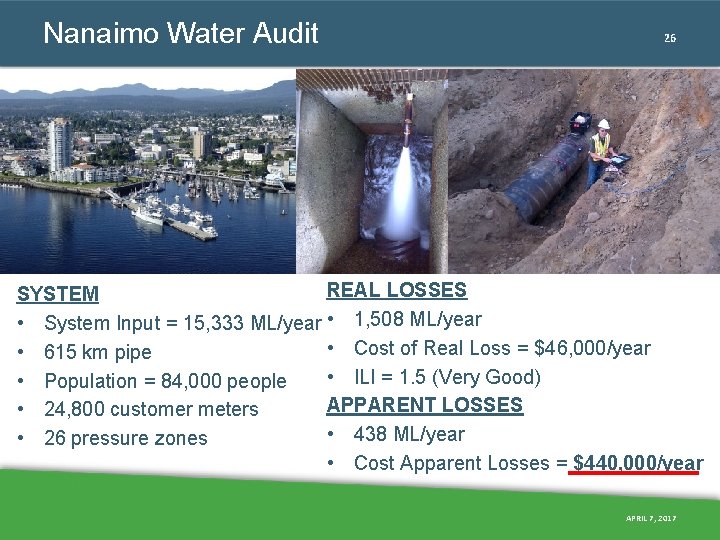
Nanaimo Water Audit 26 REAL LOSSES SYSTEM • System Input = 15, 333 ML/year • 1, 508 ML/year • Cost of Real Loss = $46, 000/year • 615 km pipe • ILI = 1. 5 (Very Good) • Population = 84, 000 people APPARENT LOSSES • 24, 800 customer meters • 438 ML/year • 26 pressure zones • Cost Apparent Losses = $440, 000/year APRIL 7, 2017
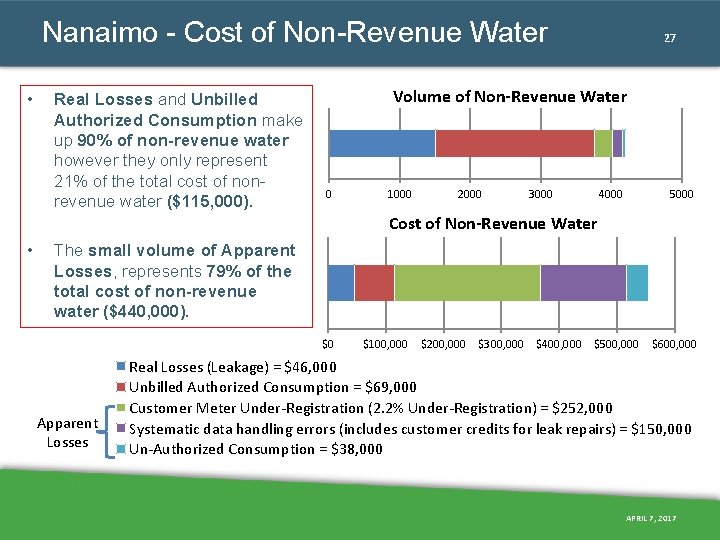
Nanaimo - Cost of Non-Revenue Water • Real Losses and Unbilled Authorized Consumption make up 90% of non-revenue water however they only represent 21% of the total cost of nonrevenue water ($115, 000). 27 Volume of Non-Revenue Water 0 1000 2000 3000 4000 5000 Cost of Non-Revenue Water • The small volume of Apparent Losses, represents 79% of the total cost of non-revenue water ($440, 000). $0 Apparent Losses $100, 000 $200, 000 $300, 000 $400, 000 $500, 000 $600, 000 Real Losses (Leakage) = $46, 000 Unbilled Authorized Consumption = $69, 000 Customer Meter Under-Registration (2. 2% Under-Registration) = $252, 000 Systematic data handling errors (includes customer credits for leak repairs) = $150, 000 Un-Authorized Consumption = $38, 000 APRIL 7, 2017
THANKS FOR YOUR ATTENTION 28 Ryan Lesyshen, M. Sc. , P. Eng Kerr Wood Leidal Associates Limited Email: rlesyshen@kwl. ca Phone: 250 -812 -0443 APRIL 7, 2017