Machine Protection and Operation Doug Curry USPAS January
- Slides: 14
Machine Protection and Operation Doug Curry USPAS, January 2017 ORNL is managed by UT-Battelle for the US Department of Energy
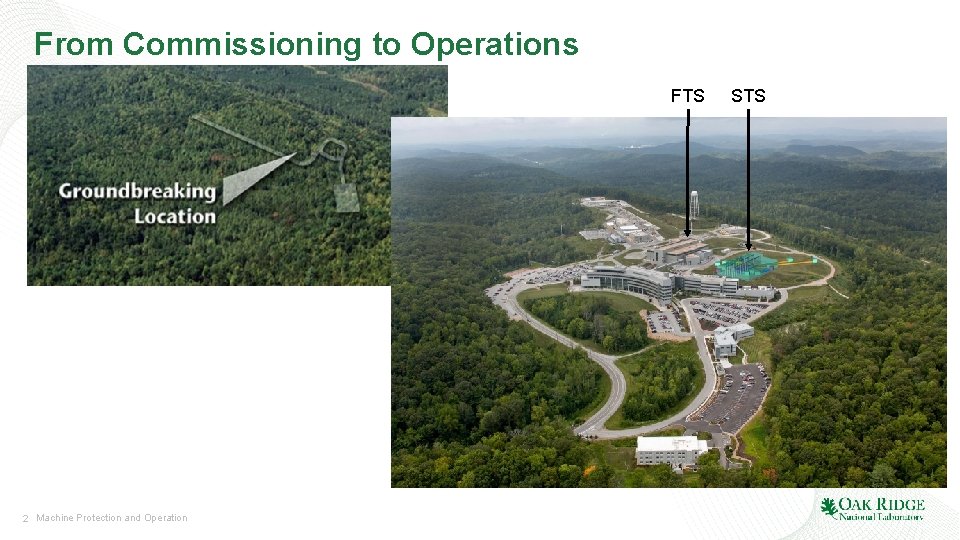
From Commissioning to Operations FTS 2 Machine Protection and Operation STS
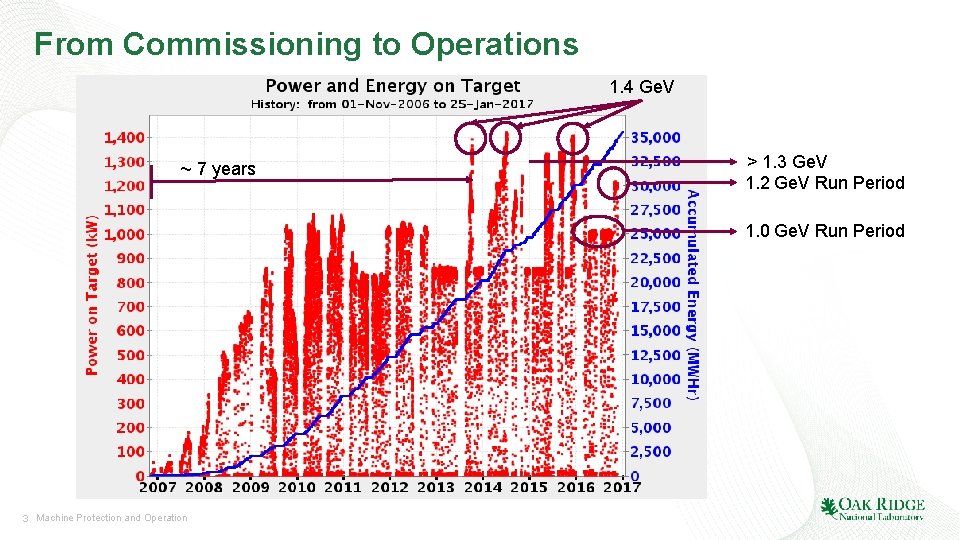
From Commissioning to Operations 1. 4 Ge. V ~ 7 years > 1. 3 Ge. V 1. 2 Ge. V Run Period 1. 0 Ge. V Run Period 3 Machine Protection and Operation
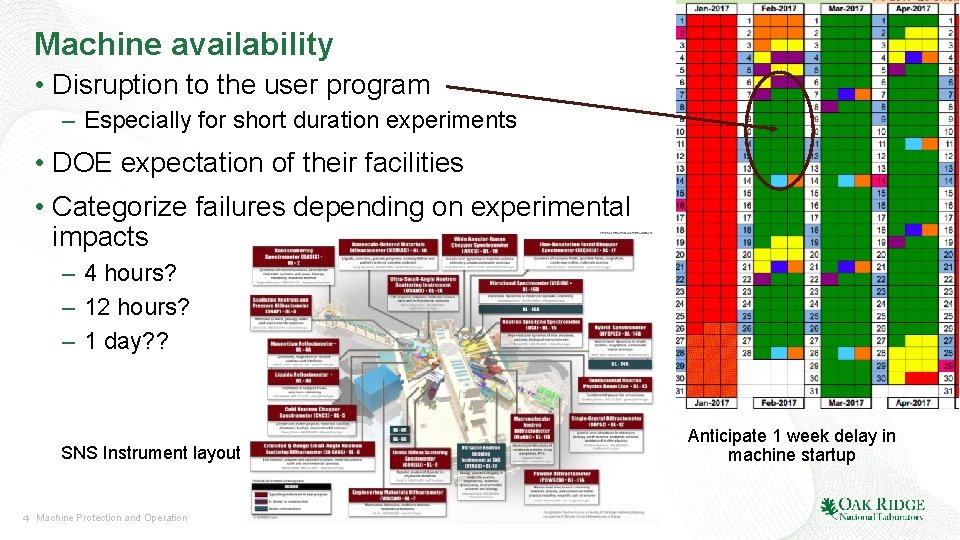
Machine availability • Disruption to the user program – Especially for short duration experiments • DOE expectation of their facilities • Categorize failures depending on experimental impacts – 4 hours? – 12 hours? – 1 day? ? SNS Instrument layout 4 Machine Protection and Operation Anticipate 1 week delay in machine startup
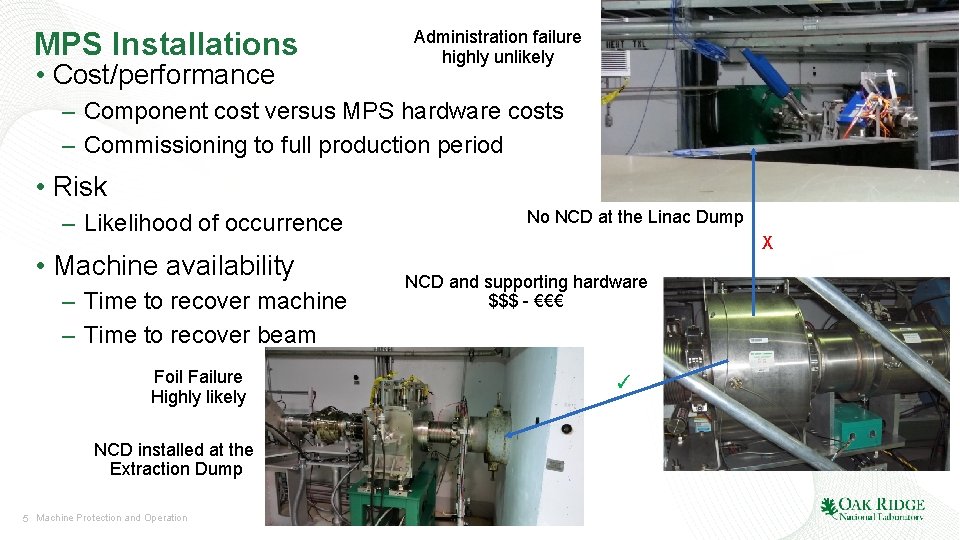
MPS Installations • Cost/performance Administration failure highly unlikely – Component cost versus MPS hardware costs – Commissioning to full production period • Risk – Likelihood of occurrence • Machine availability – Time to recover machine – Time to recover beam Foil Failure Highly likely NCD installed at the Extraction Dump 5 Machine Protection and Operation No NCD at the Linac Dump X NCD and supporting hardware $$$ - €€€ ✓
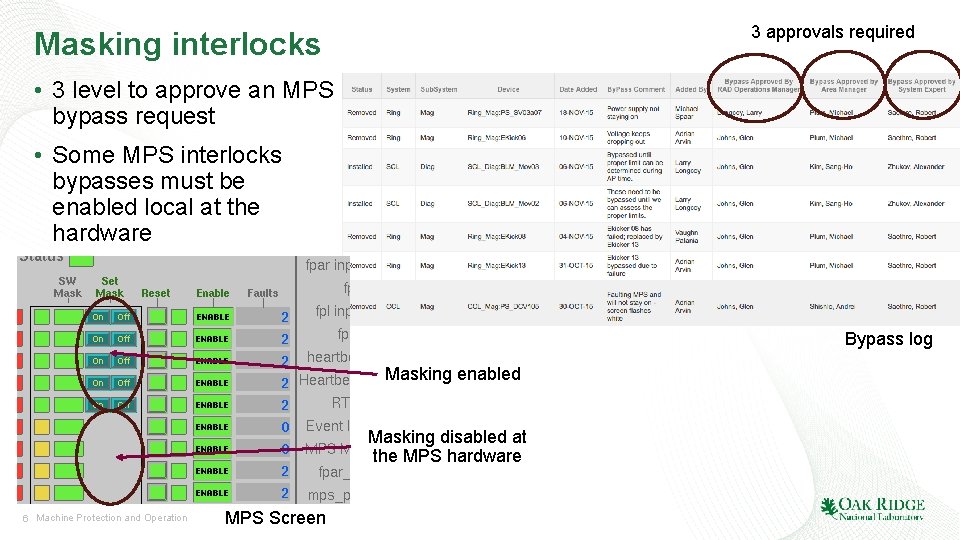
3 approvals required Masking interlocks • 3 level to approve an MPS bypass request • Some MPS interlocks bypasses must be enabled local at the hardware Bypass log Masking enabled Masking disabled at the MPS hardware 6 Machine Protection and Operation MPS Screen
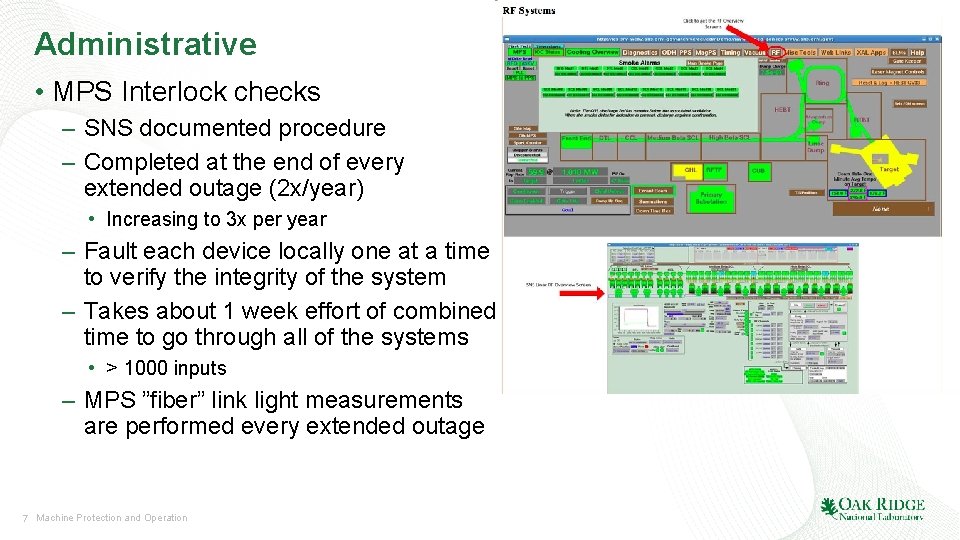
Administrative • MPS Interlock checks – SNS documented procedure – Completed at the end of every extended outage (2 x/year) • Increasing to 3 x per year – Fault each device locally one at a time to verify the integrity of the system – Takes about 1 week effort of combined time to go through all of the systems • > 1000 inputs – MPS ”fiber” link light measurements are performed every extended outage 7 Machine Protection and Operation
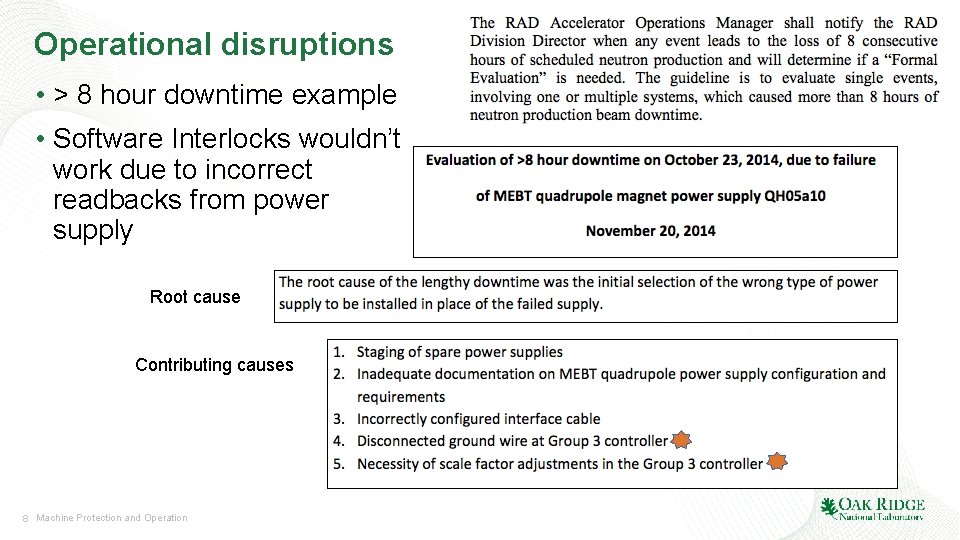
Operational disruptions • > 8 hour downtime example • Software Interlocks wouldn’t work due to incorrect readbacks from power supply Root cause Contributing causes 8 Machine Protection and Operation
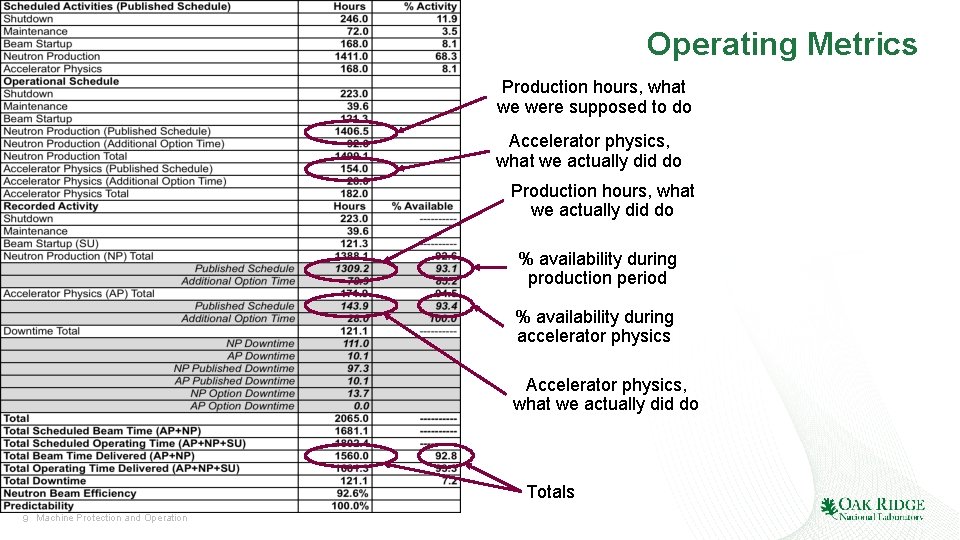
Operating Metrics Production hours, what we were supposed to do Accelerator physics, what we actually did do Production hours, what we actually did do % availability during production period % availability during accelerator physics Accelerator physics, what we actually did do Totals 9 Machine Protection and Operation
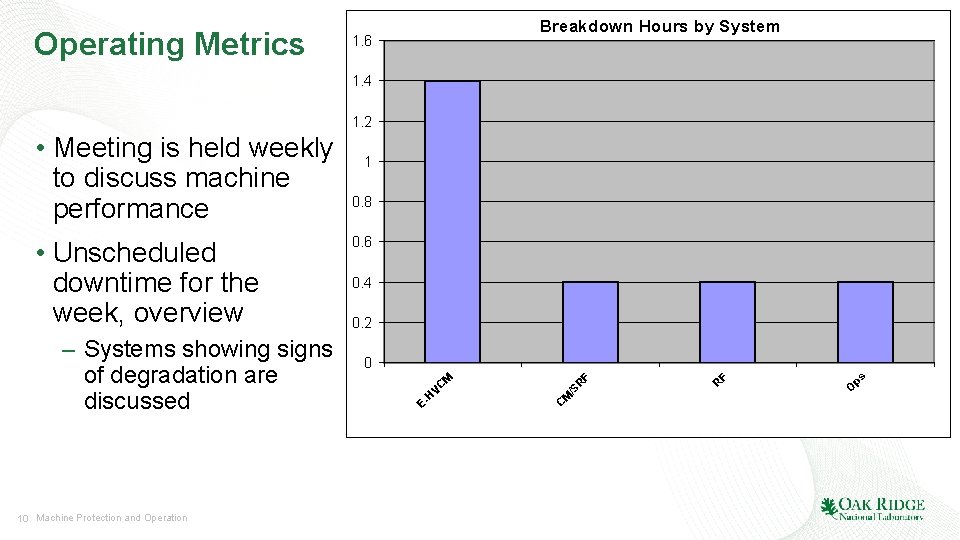
Operating Metrics Breakdown Hours by System 1. 6 1. 4 1. 2 10 Machine Protection and Operation 0. 6 0. 4 0. 2 C M ps F R O /S R F M 0 VC – Systems showing signs of degradation are discussed 0. 8 H • Unscheduled downtime for the week, overview 1 E- • Meeting is held weekly to discuss machine performance
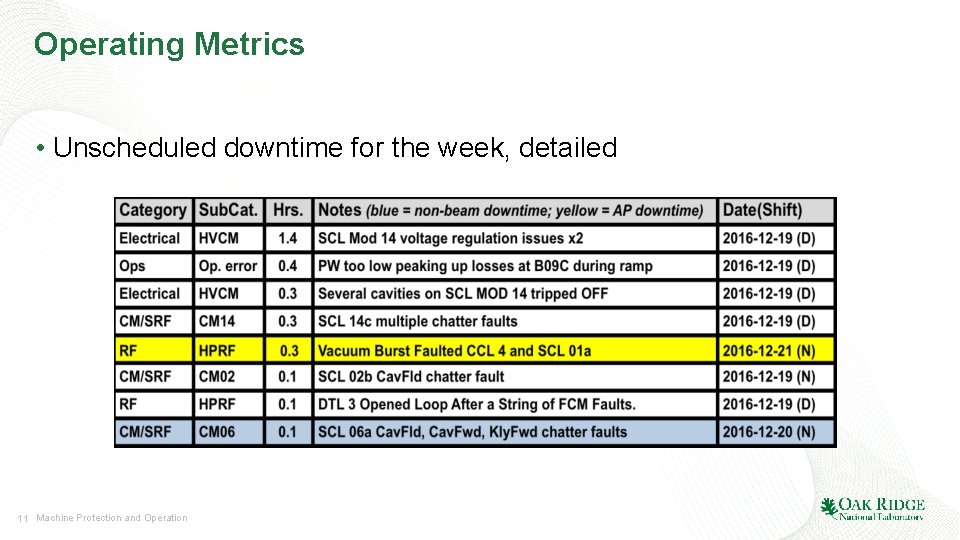
Operating Metrics • Unscheduled downtime for the week, detailed 11 Machine Protection and Operation
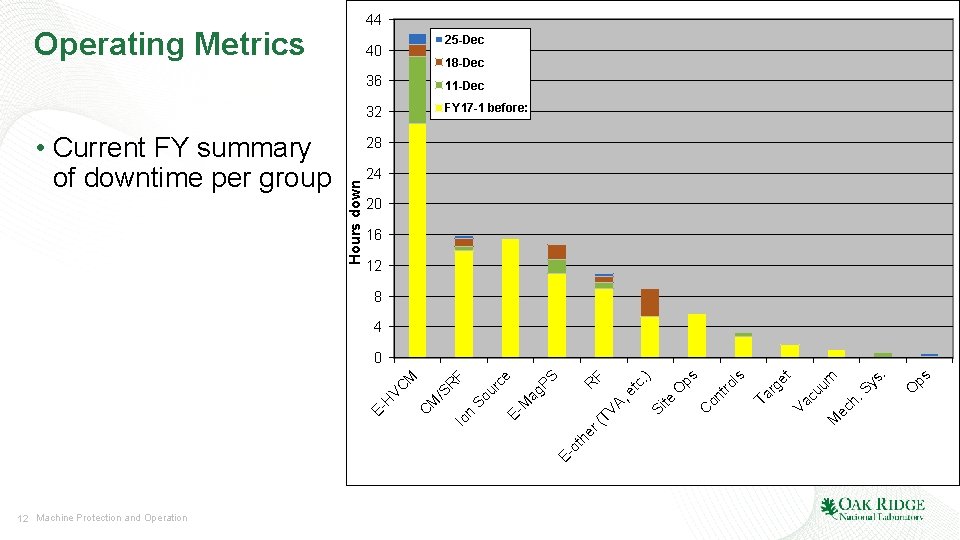
44 Operating Metrics 18 -Dec 36 11 -Dec 32 FY 17 -1 before: 28 Hours down • Current FY summary of downtime per group 25 -Dec 40 24 20 16 12 8 4 r( he ot E- 12 Machine Protection and Operation ps O F TV A, et c. ) Si te O ps C on tro ls Ta rg et Va cu um M ec h. Sy s. R PS ag M E- So ur ce F R Io n M /S C EH VC M 0
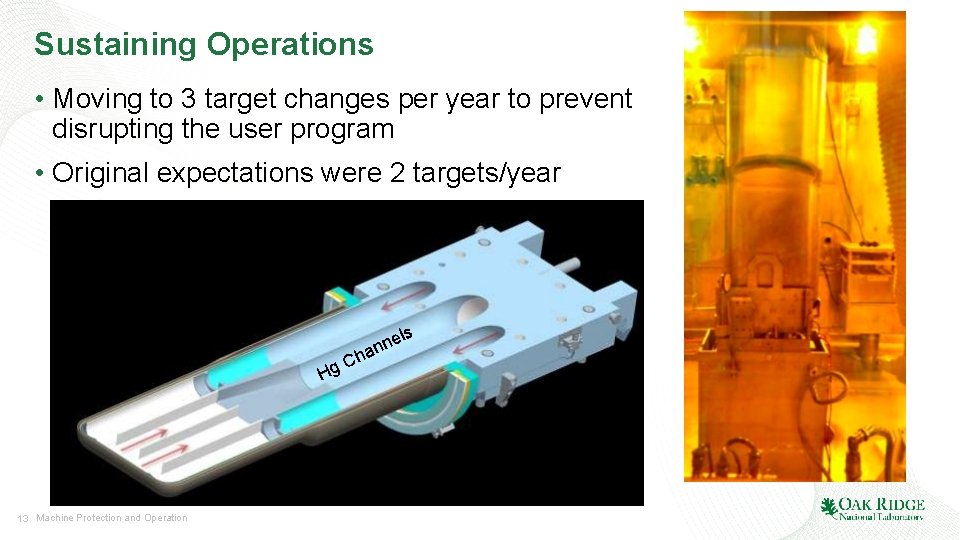
Sustaining Operations • Moving to 3 target changes per year to prevent disrupting the user program • Original expectations were 2 targets/year Hg 13 Machine Protection and Operation C ls e n han
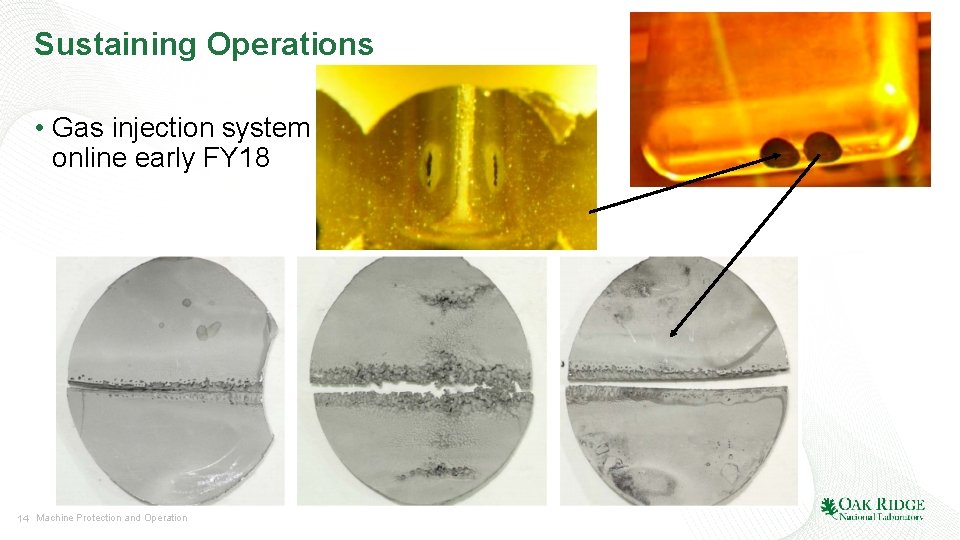
Sustaining Operations • Gas injection system online early FY 18 14 Machine Protection and Operation