Liverpool Healthy Homes Programme Ian Watson Neil Johnson


- Slides: 20
Liverpool Healthy Homes Programme Ian Watson & Neil Johnson
Liverpool overall context q Population: 466, 000 q 148, 000 private sector properties: - (Excess Safety and Fire) - Fuel poverty rates across Liverpool 19, 400 present H&S risk (13%) Cold, Falls, Electrical 19, 000 fail the energy efficiency requirements of the DHS (13%) q Private-rented sector accounts for highest rates of hazardous housing (18. 7%) & highest concentration of poorest thermal efficiency q Among highest mortality rates and lowest levels of life expectancy q Large health inequalities © Crown copyright and database rights 2012 Ordnance Survey 100018351
Liverpool Life Expectancy Northern Line Bus Route 12 County 76. 6 Kirkdale 73. 8 Fazakerley 77. 7 Croxteth 75. 3 Tuebrook 77. 3 Anfield 74. 7 Everton 75. 0 Central 78. 6 City Line West Derby 79. 6 Old Swan 75. 5 Kensington 75. 2 Knotty Ash 78. 4 Picton 72. 9 Woolton 80. 7 Riverside 74. 9 St Michaels 76. 9 Mossley Hill 81. 4 Childwall 82. 7 Church 82. 6 Belle Vale 77. 2 Cressington 79. 0 Speke Garston 74. 0
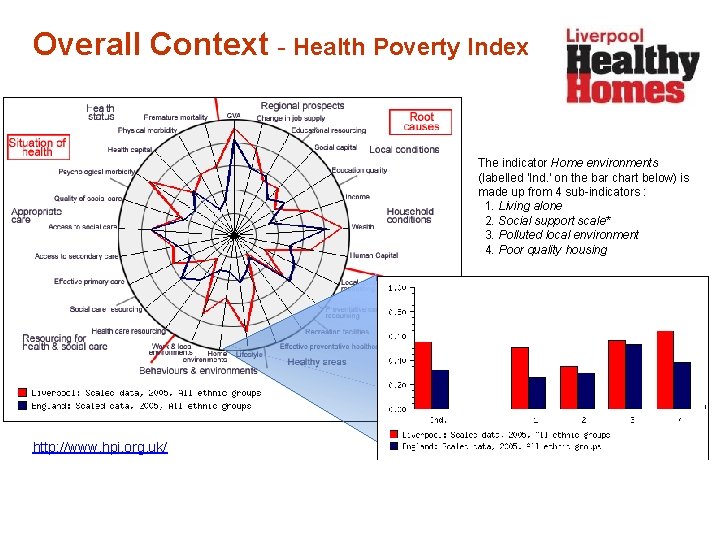
Overall Context - Health Poverty Index The indicator Home environments (labelled 'Ind. ' on the bar chart below) is made up from 4 sub-indicators : 1. Living alone 2. Social support scale* 3. Polluted local environment 4. Poor quality housing http: //www. hpi. org. uk/
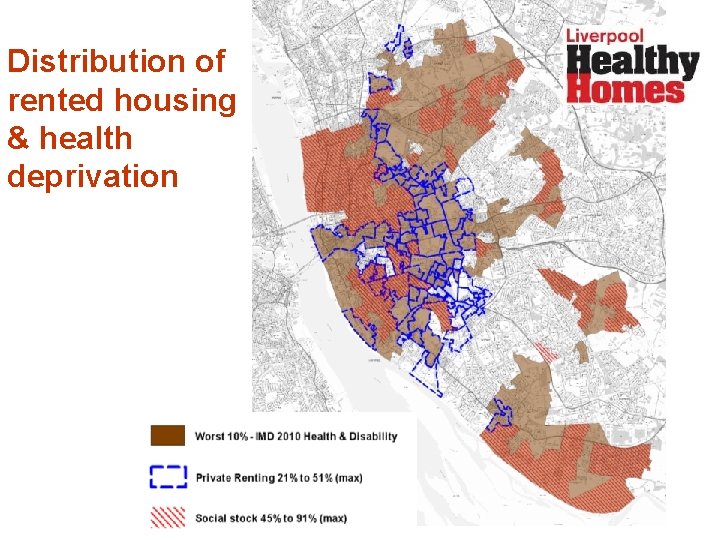
Distribution of rented housing & health deprivation
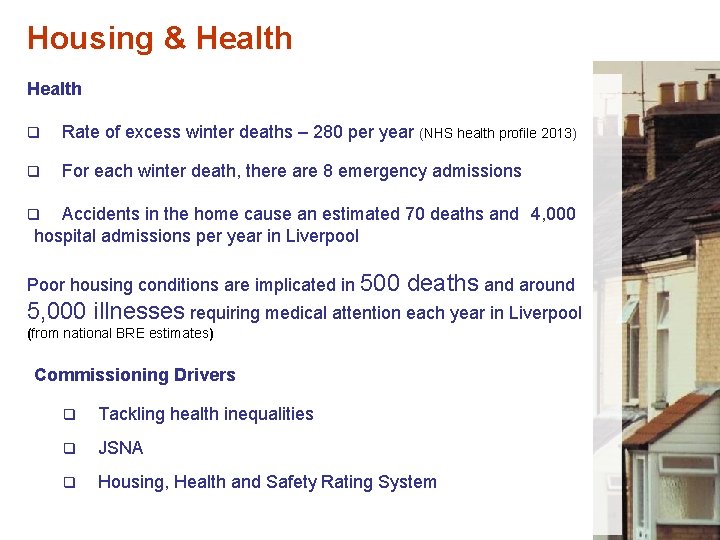
Housing & Health q Rate of excess winter deaths – 280 per year (NHS health profile 2013) q For each winter death, there are 8 emergency admissions q Accidents in the home cause an estimated 70 deaths and 4, 000 hospital admissions per year in Liverpool Poor housing conditions are implicated in 500 deaths and around 5, 000 illnesses requiring medical attention each year in Liverpool (from national BRE estimates) Commissioning Drivers q Tackling health inequalities q JSNA q Housing, Health and Safety Rating System
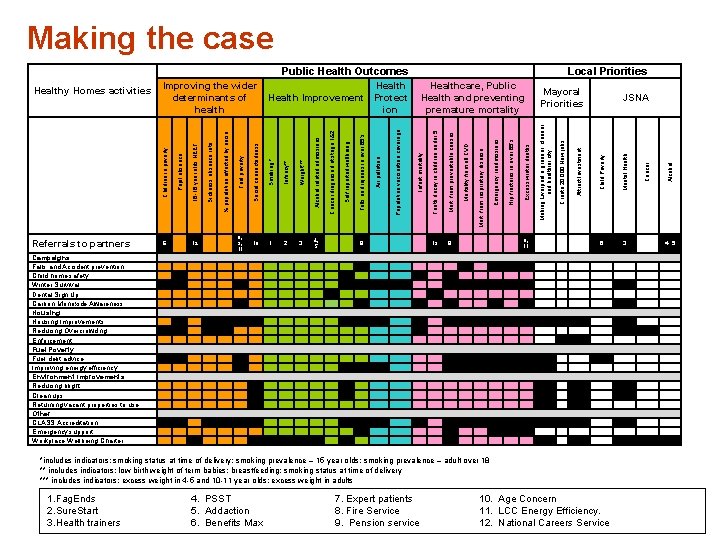
Making the case Public Health Outcomes Campaigns Falls and Accident prevention Child home safety Winter Survival Dental Sign Up Carbon Monoxide Awareness Housing Improvements Reducing Overcrowding Enforcement Fuel Poverty Fuel debt advice Improving energy efficiency Environment Improvements Reducing blight Clean ups Returning vacant properties to use Other CLASS Accreditation Emergency support Workplace Wellbeing Charter Hip fractures in over 65’s Excess winter deaths Making Liverpool a greener, cleaner and healthier city Create 20, 000 New jobs Attract Investment Child Poverty Mental Health Cancer Alcohol Emergency readmissions 13 8 6, 11 6 3 4, 5 Mort. from respiratory disease 8 Mortality from all CVD JSNA Mort. from preventable causes Mayoral Priorities Tooth decay in children under 5 4, 5 Healthcare, Public Health and preventing premature mortality Infant mortality 3 Population vaccination coverage 2 Air pollution Falls and injuries in over 65’s 1 Self reported wellbeing 10 Cancer diagnosed at stage 1&2 6, 9, 11 Alcohol related admissions Infancy** Weight*** Smoking * 12 Social connectedness Fuel poverty 6 Sickness absence rate 16 -18 year olds NEET Referrals to partners % population affected by noise Pupil absence Improving the wider Health determinants of Health Improvement Protect health ion Children in poverty Healthy Homes activities Local Priorities *includes indicators; smoking status at time of delivery; smoking prevalence – 15 year olds; smoking prevalence – adult over 18 ** includes indicators; low birth weight of term babies; breastfeeding; smoking status at time of delivery *** includes indicators; excess weight in 4 -5 and 10 -11 year olds; excess weight in adults 1. Fag. Ends 2. Sure. Start 3. Health trainers 4. PSST 5. Addaction 6. Benefits Max 7. Expert patients 8. Fire Service 9. Pension service 10. Age Concern 11. LCC Energy Efficiency. 12. National Careers Service
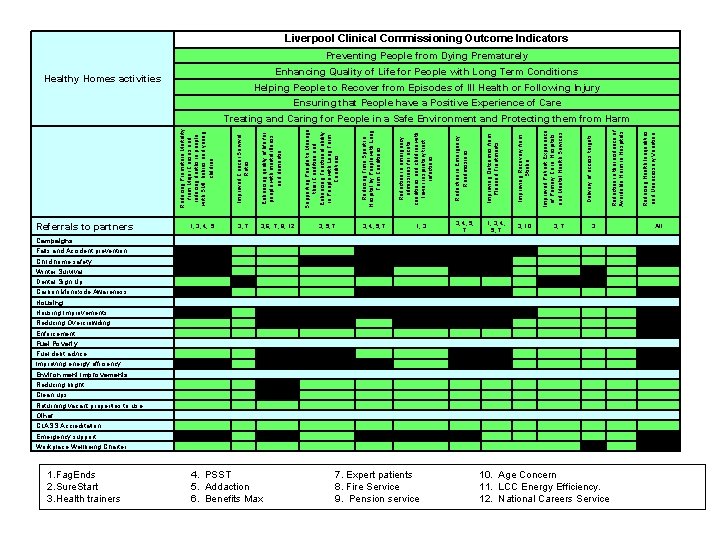
Liverpool Clinical Commissioning Outcome Indicators Preventing People from Dying Prematurely Enhancing Quality of Life for People with Long Term Conditions Healthy Homes activities Helping People to Recover from Episodes of Ill Health or Following Injury Ensuring that People have a Positive Experience of Care Campaigns Falls and Accident prevention Child home safety Winter Survival Dental Sign Up Carbon Monoxide Awareness Housing Improvements Reducing Overcrowding Enforcement Fuel Poverty Fuel debt advice Improving energy efficiency Environment Improvements Reducing blight Clean ups Returning vacant properties to use Other CLASS Accreditation Emergency support Workplace Wellbeing Charter 1. Fag. Ends 2. Sure. Start 3. Health trainers 3, 4, 5, 7 1, 3 3, 10 3, 7 3 All Reducing Health Inequalities and Unnecessary Variation 1, 3, 4, 5, 7 Reduction in the incidence of Avoidable Harm in Hospitals 3, 4, 5, 7 Delivery of access targets Reduction in emergency admissions for acute conditions and children with lower respiratory tract infections Reducing Time Spent in Hospital by People with Long Term Conditions Supporting People to Manage their Condition and Enhancing Functional ability in People with Long Term Conditions 3, 5, 7 Improved Patient Experience of Primary Care, Hospitals and Mental Health Services 3, 6, 7, 8, 12 Improving Recovery from Stroke 3, 7 Improving Outcomes from Planned Treatments 1, 3, 4, 5 Reduction in Emergency Readmissions Referrals to partners Enhancing quality of life for people with mental illness and dementia Improved Cancer Survival Rates Reducing Premature Mortality from Major Causes and reducing deaths in people with SMI, babies and young children Treating and Caring for People in a Safe Environment and Protecting them from Harm 4. PSST 5. Addaction 6. Benefits Max 7. Expert patients 8. Fire Service 9. Pension service 10. Age Concern 11. LCC Energy Efficiency. 12. National Careers Service
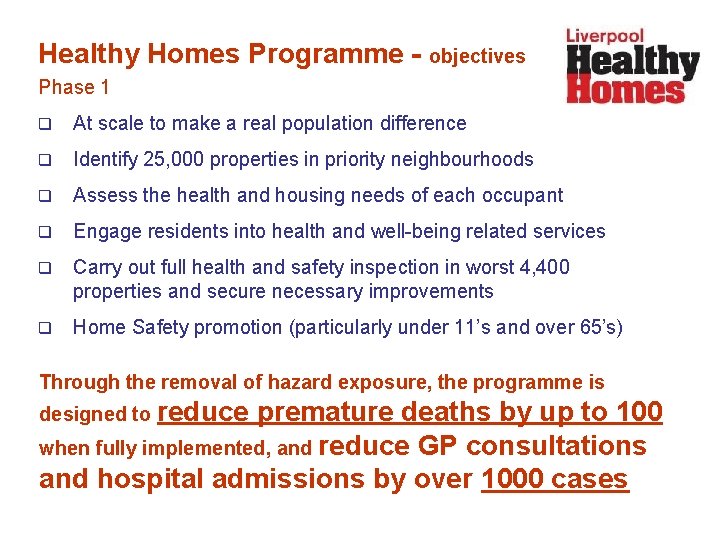
Healthy Homes Programme - objectives Phase 1 q At scale to make a real population difference q Identify 25, 000 properties in priority neighbourhoods q Assess the health and housing needs of each occupant q Engage residents into health and well-being related services q Carry out full health and safety inspection in worst 4, 400 properties and secure necessary improvements q Home Safety promotion (particularly under 11’s and over 65’s) Through the removal of hazard exposure, the programme is designed to reduce premature deaths by up to 100 when fully implemented, and reduce GP consultations and hospital admissions by over 1000 cases
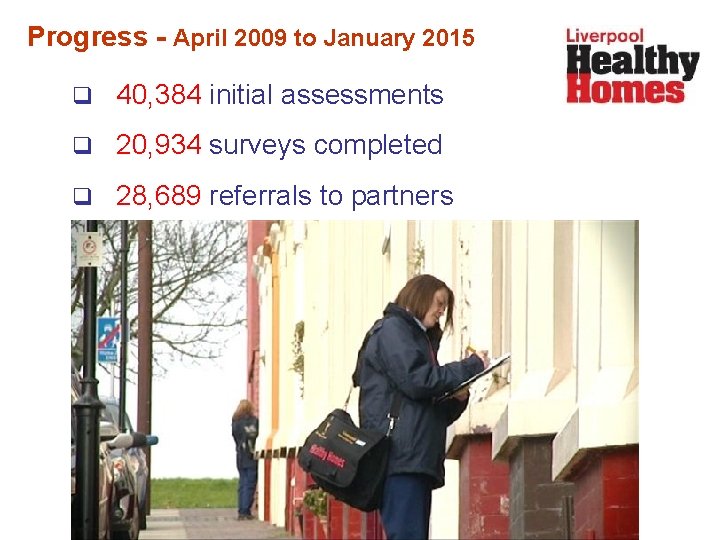
Progress - April 2009 to January 2015 q 40, 384 initial assessments q 20, 934 surveys completed q 28, 689 referrals to partners
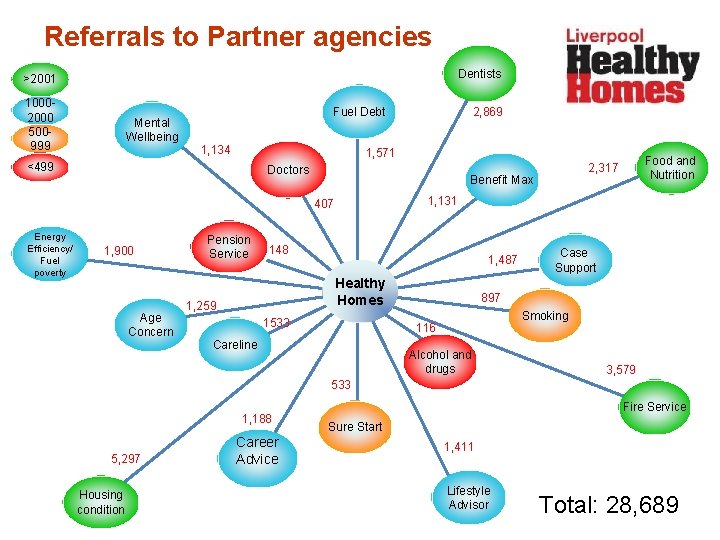
Referrals to Partner agencies Dentists >2001 10002000 500999 Mental Wellbeing 1, 134 1, 571 <499 Doctors 1, 900 Age Concern Pension Service 1, 131 148 1, 487 Healthy Homes 1, 259 Food and Nutrition 2, 317 Benefit Max 407 Energy Efficiency/ Fuel poverty 2, 869 Fuel Debt 1533 897 Smoking 116 Careline Case Support Alcohol and drugs 3, 579 533 1, 188 5, 297 Housing condition Career Advice Fire Service Sure Start 1, 411 Lifestyle Advisor Total: 28, 689
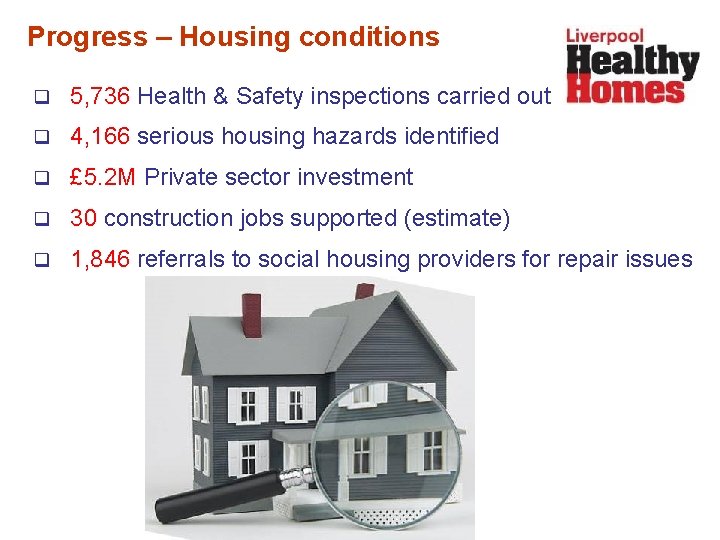
Progress – Housing conditions q 5, 736 Health & Safety inspections carried out q 4, 166 serious housing hazards identified q £ 5. 2 M Private sector investment q 30 construction jobs supported (estimate) q 1, 846 referrals to social housing providers for repair issues
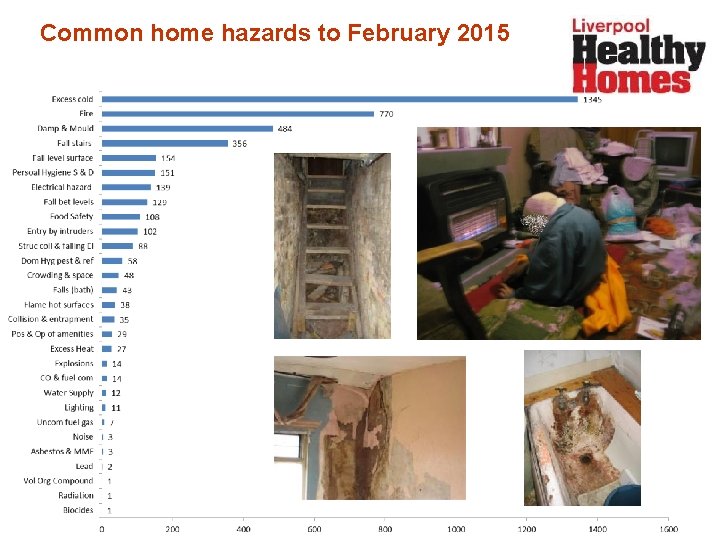
Common home hazards to February 2015
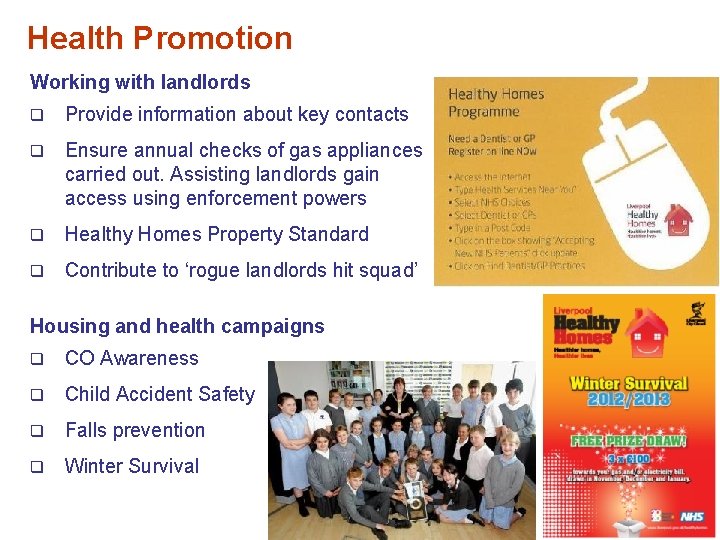
Health Promotion Working with landlords q Provide information about key contacts q Ensure annual checks of gas appliances carried out. Assisting landlords gain access using enforcement powers q Healthy Homes Property Standard q Contribute to ‘rogue landlords hit squad’ Housing and health campaigns q CO Awareness q Child Accident Safety q Falls prevention q Winter Survival
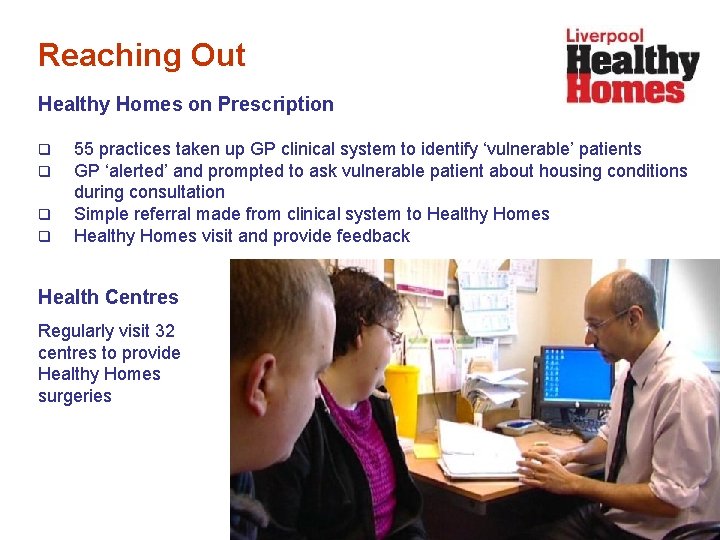
Reaching Out Healthy Homes on Prescription q q 55 practices taken up GP clinical system to identify ‘vulnerable’ patients GP ‘alerted’ and prompted to ask vulnerable patient about housing conditions during consultation Simple referral made from clinical system to Healthy Homes visit and provide feedback Health Centres Regularly visit 32 centres to provide Healthy Homes surgeries
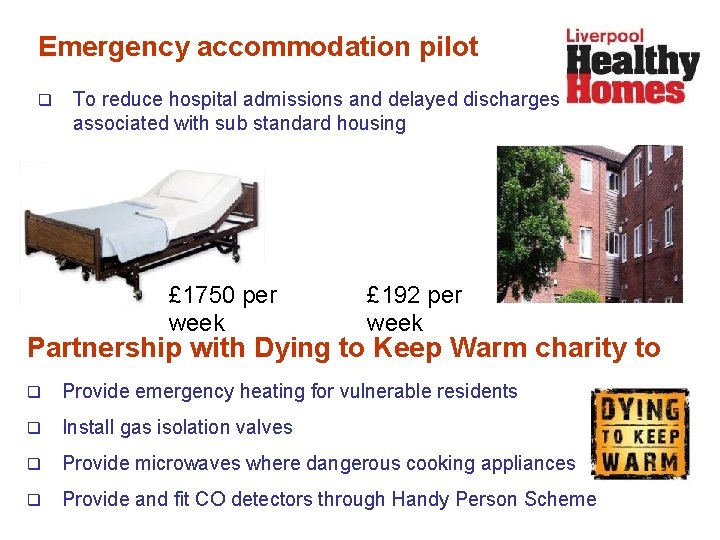
Emergency accommodation pilot q To reduce hospital admissions and delayed discharges associated with sub standard housing £ 1750 per week £ 192 per week Partnership with Dying to Keep Warm charity to q Provide emergency heating for vulnerable residents q Install gas isolation valves q Provide microwaves where dangerous cooking appliances q Provide and fit CO detectors through Handy Person Scheme
Value for Money? BRE evaluation of first year’s operation shows: q 861 HHSRS inspections removing 725 Cat 1 hazards q Total project cost £ 1. 07 M (Inspection cost £ 300 K) q On-going annual NHS savings £ 440 K (£ 4. 4 M over 10 years) q Excess cold hazard alone £ 341, 000 (£ 3. 41 M over 10 years) q Wider Society annual savings £ 1. 1 M (£ 11 M over 10 years) q Excess cold hazard alone £ 852, 000 (£ 8. 52 M over 10 years) Total anticipated savings by HHP: £ 55 Million (£ 42 M from excess cold) (Building Research Establishment Jan 2011)
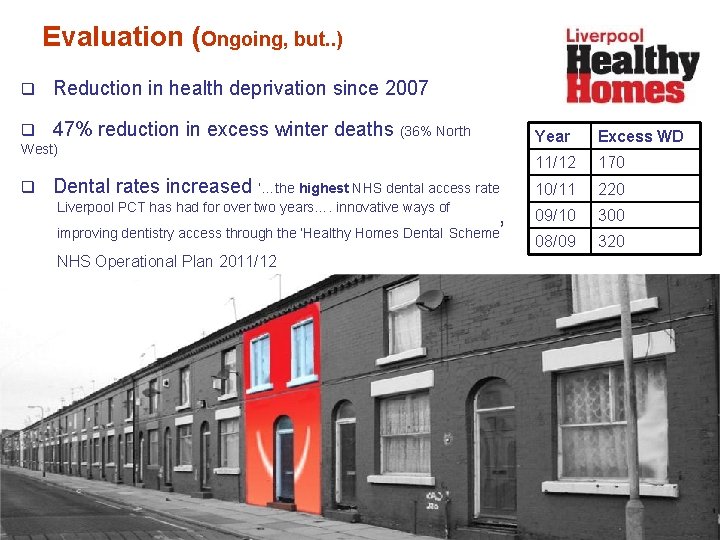
Evaluation (Ongoing, but. . ) q Reduction in health deprivation since 2007 q 47% reduction in excess winter deaths (36% North West) q Dental rates increased ‘…the highest NHS dental access rate Liverpool PCT has had for over two years…. innovative ways of improving dentistry access through the ‘Healthy Homes Dental Scheme NHS Operational Plan 2011/12 ’ Year Excess WD 11/12 170 10/11 220 09/10 300 08/09 320
Evaluation q EQ 5 D – measuring health outcome q Tagging referrals to partner organisations q 28 day call back q Customer Satisfaction (10% of all surveys) q Radio. City – “most successful online microsite in the history of the station”
Remember, it costs to do nothing! Thank you for listening watsoni@bre. co. uk Neil. Johnson@liverpool. gov. uk