Lesson 3 Title Calculating Rate of Reaction LI


 0 Volume of CO 2 produced (cm 3) 0")


 0")
 0")
 0 s and 10 s b)10 s and")
 0 -4 minutes b) 6 -10 minutes")

- Slides: 15
Lesson 3 Title: Calculating Rate of Reaction LI: Calculate average rate of reaction Green – I can describe how the rate of a reaction can be followed and measured. I can interpret graphs of reactions. I can carry calculate the average rate of a reaction. Amber - I can describe how the rate of a reaction can be followed and measured. I can interpret graphs of reactions. Red - I can describe how the rate of a reaction can be followed and measured.
Following the Progress of a Reaction using Graphs • Rate of the reaction – The steeper the slope the faster the reaction • Completion of the reaction – When the graph levels off the reaction has stopped – Usually one or both of the reactants has been used up
The graph shows how the volume of hydrogen gas produced increases with time when 2 g of magnesium granules react with excess hydrochloric acid B Add similar curves to the graph to show the reaction of the same concentration of acid and: A 1 g magnesium powder A B 2 g magnesium ribbon
Excess copper carbonate was added to 1 mol l-1 sulphuric acid at 25 o. C Add to the graph to show the curves obtained when the reaction is repeated: A A at a higher temperature B Booklet page 3 B with the same volume of 0. 5 mol l-1 sulfuric acid
Average Rate of Reaction • Slope of graph tells us about the rate of the reaction • Rate = change in quantity change in time From a graph: (see data booklet) Rate = (change in y axis) (change in time)
Calculating Average Rate Time (s) 0 Volume of CO 2 produced (cm 3) 0 30 60 90 120 150 180 210 240 270 300 28 39 46 51 55 58 60 61 62 62 Calculate the average rate between 0 and 90 seconds: Rate = change in quantity measured change in time Rate = 46 – 0 = 0. 51 cm 3 s-1 90 – 0 Calculate the average rate between: a) b) 60 and 120 seconds 120 and 300 seconds
Monitoring Volume of Gas • Rate = change in volume time taken for change • Units of rate are cm 3 i. e. cm 3 s-1 s
Monitoring Mass of Gas • Rate = change in mass time taken for change • Units of rate are g i. e. g s-1 s
Calculating rate from a graph Calculate the average rate of reaction between a) 0 -30 seconds b) 30 -90 seconds c) 90 -150 seconds d) During which time interval is the rate fastest? e) Explain why the rate of reaction is fastest during this time interval. Booklet page 4 and 5
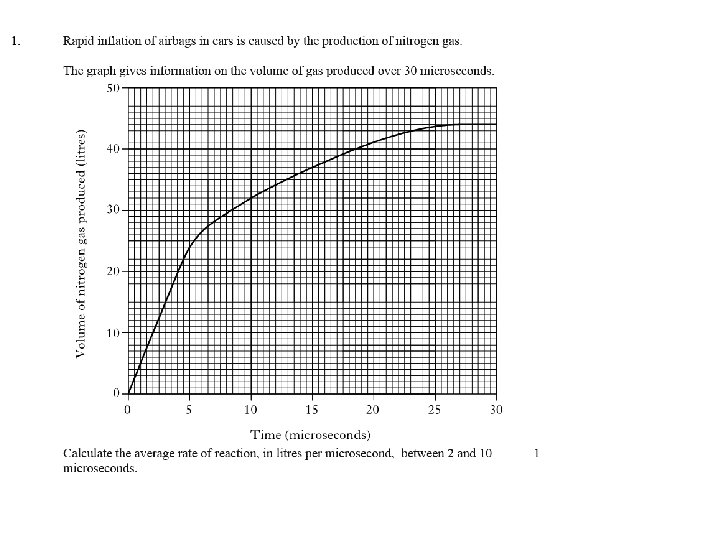
PASS Before you leave… Answer the following: Calculate the average rate between a) 0 s and 10 s b)10 s and 20 s
Calculate the average rate between a) 0 s and 10 s b)10 s and 20 s
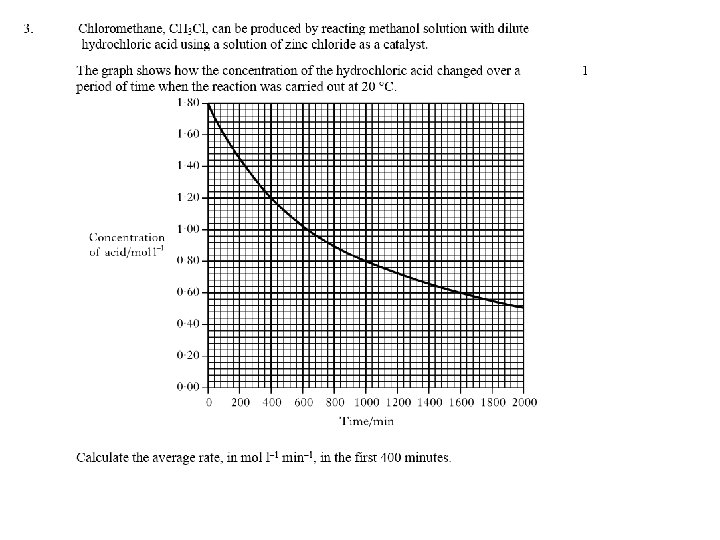
Calculate the rate of reaction between a) 0 -4 minutes b) 6 -10 minutes 2
4.