Lecture 14 Instantaneous Rate of Change Interpretations Higher


 How far will be object drop 2 seconds? (b) What is the instantaneous")


 becomes more and more negative as the value of x")


- Slides: 30
Lecture 14 Instantaneous Rate of Change Interpretations; Higher Order Derivatives
Last Lecture Summary We covered sections 15. 5 and 15. 6: • Differentiation • Rules of Differentiation • Implementation and examples
Today We’ll cover sections 15. 7 and 15. 8: • Instantaneous Rate of Change Interpretations • Second Order, Third Order and Higher Order Derivatives
INSTANTANEOUS-RATE-OF-CHANGE INTERPRETATION •
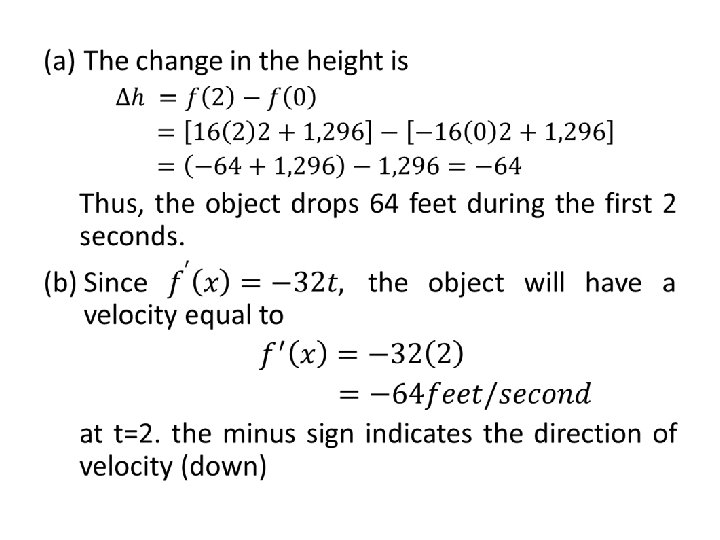
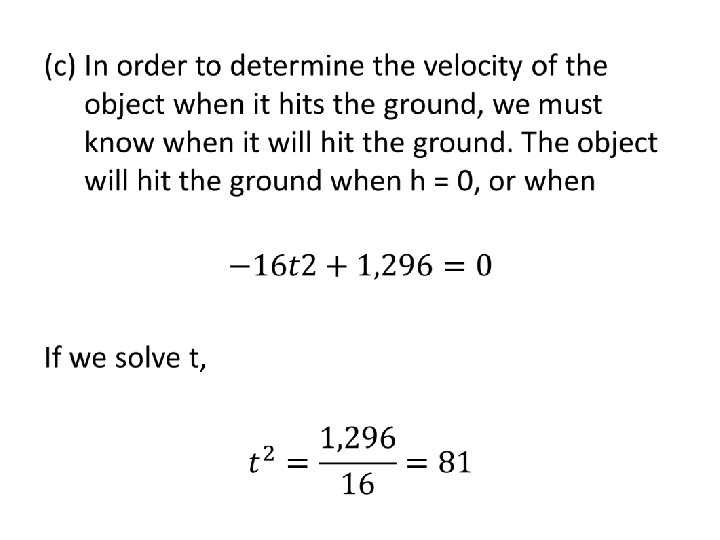
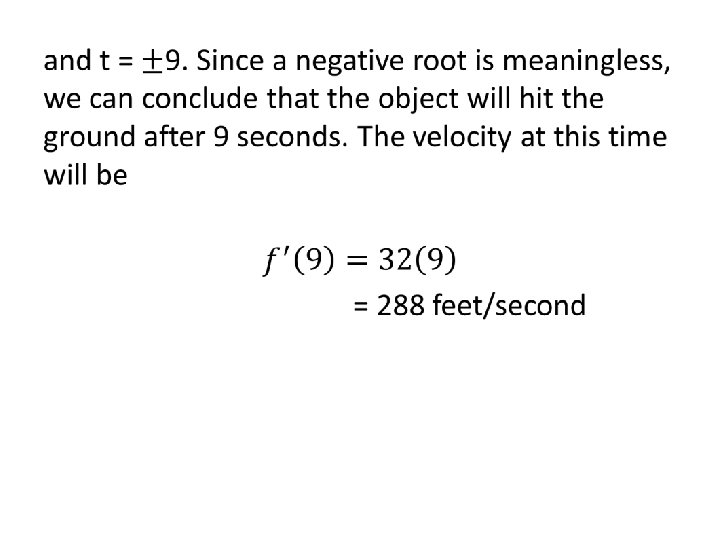
(a) How far will be object drop 2 seconds? (b) What is the instantaneous velocity of the object at t = 2? (c) What is the velocity of the object at the instant it hits the ground?
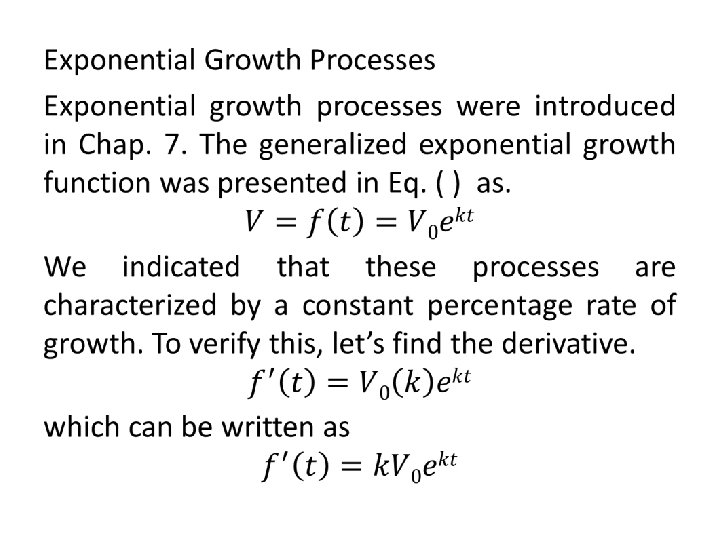
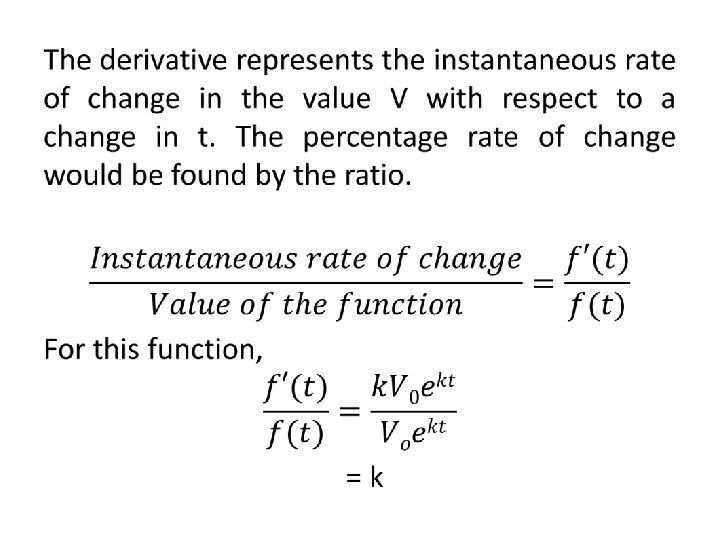
This confirms that for an exponential growth function of the form of Eq. (7. 9), k represents the percentage rate of growth. Given that k is a constant, the percentage rate of growth is the same for all values t.
HIGHER-ORDER DERIVATIVES
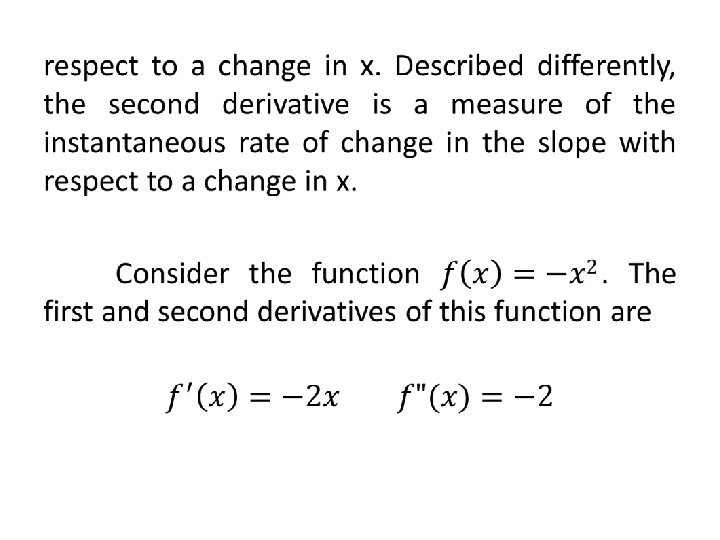
The following figure illustrates the graphs of f, f’ and f”. The function f is a parabola which is concave down with the vertex at (0, 0). The tangent slope is positive to the left of the vertex but becomes less positive as x approaches 0. To the right of the vertex the tangent slope is negative, becoming more negative (decreasing) as x increases. The graph of f’ indicates the value of the slope at any point on f. Note that values of f’(x) are positive, but becoming less positive, as x approaches 0 from
the left, And f’(x) becomes more and more negative as the value of x becomes more positive. Thus, the graph of f’ is consistent with our observation of the sketch of f.
Third and Higher-Order Derivatives •
Review We covered sections 15. 7 and 15. 8: • Instantaneous Rate of Change Interpretations • Second Order, Third Order and Higher Order Derivatives Finished Chapter 15 • Next time, we’ll start Chapter 16