Late Life Domestic Violence Charles P Mouton MD



- Slides: 30
Late Life Domestic Violence Charles P. Mouton, MD, MS Department of Community and Family Medicine Howard University College of Medicine
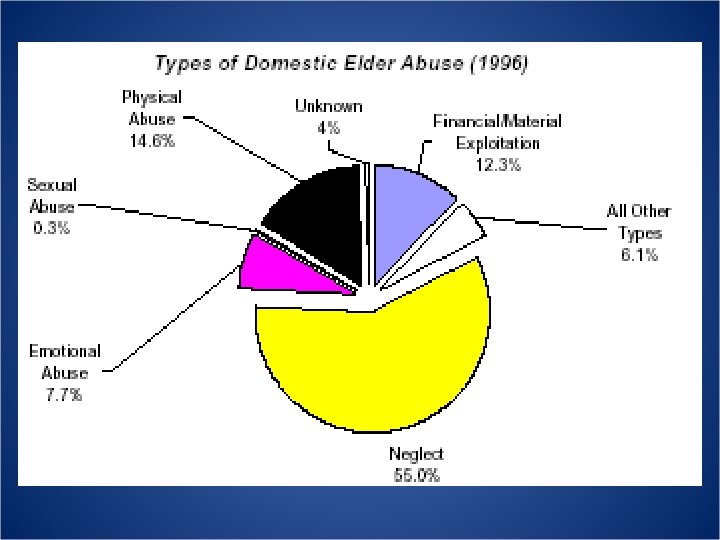
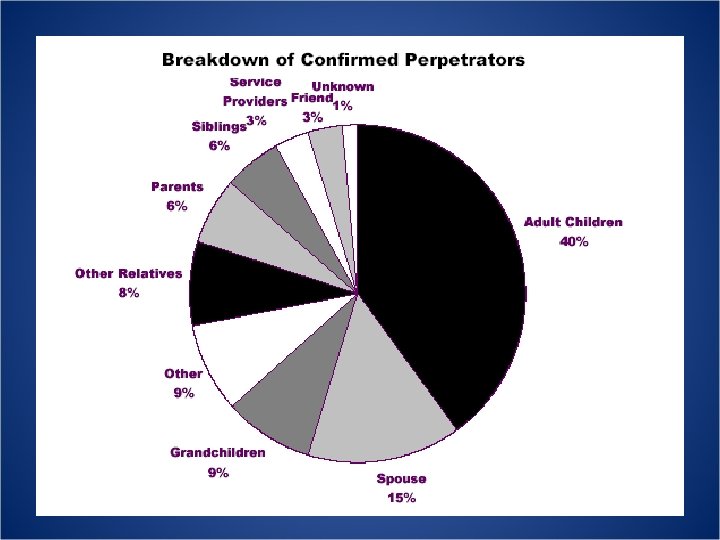
BACKGROUND • Internationally, 1 -8 % of older adults are victims of violence. • About 4% of the US elderly have suffered abuse (Pillemer and Finklehor) • 820, 000 -1. 9 million experience maltreatment annually (Tatara, Toshio and Lisa Kuzmeskus, , 1997). – Derived from APS stats • Women are victims in 2/3 of reported elder abuse cases
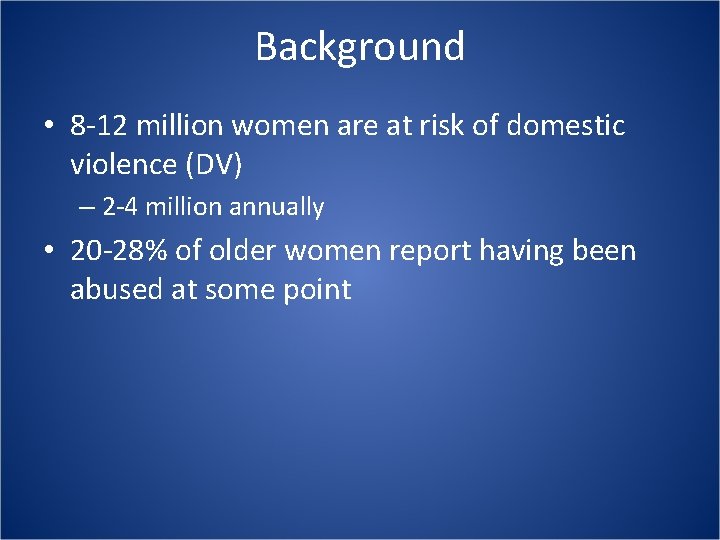
Background • 8 -12 million women are at risk of domestic violence (DV) – 2 -4 million annually • 20 -28% of older women report having been abused at some point
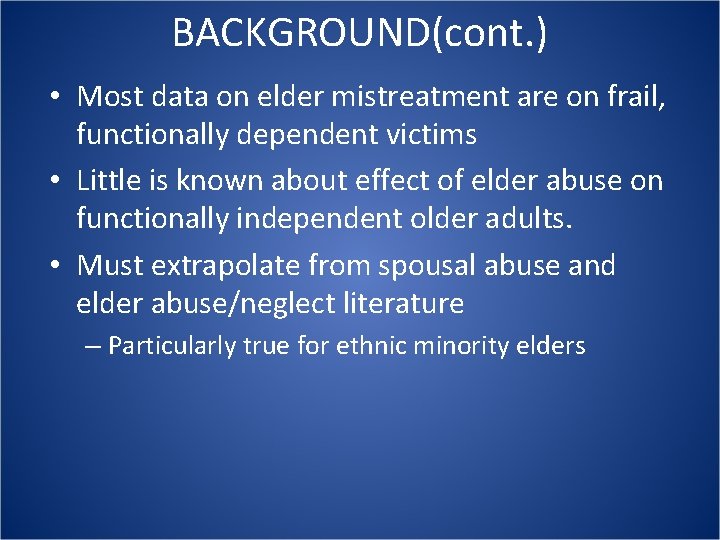
BACKGROUND(cont. ) • Most data on elder mistreatment are on frail, functionally dependent victims • Little is known about effect of elder abuse on functionally independent older adults. • Must extrapolate from spousal abuse and elder abuse/neglect literature – Particularly true for ethnic minority elders
OVERVIEW OF RESEARCH • To understand the prevalence and incidence of late life domestic violence in older women • To understand the health effects of LLDV and violence across the lifespan – Hopefully demonstrating the health effects will encourage greater attention on the part of clinicians
WHI OVERVIEW • Purpose: A three component study – CT: a RCT of HRT, LFD, Vit. D/Ca on CVD, Cancer, Osteoporosis – OS: a prospective cohort study of the same endpoints – Community Component • Setting: The Women’s Health Initiative (WHI) sites. • Participants: Over 93, 000 women greater than 50 who are part of the Observational Study of the WHI across 40 clinical research centers in the US
WHI Overview • Subjects recruited through mass mailing, media advertisements, • Subjects completed interviewer administered questionnaires • Participants in the DV ancillary study completed my Domestic Violence Screening Questionnaire separately
METHODS • Setting: The Women’s Health Initiative (WHI) sites. • Participants: Over 93, 000 women greater than 50 who are part of the Observational Study of the WHI across 40 clinical research centers in the US.
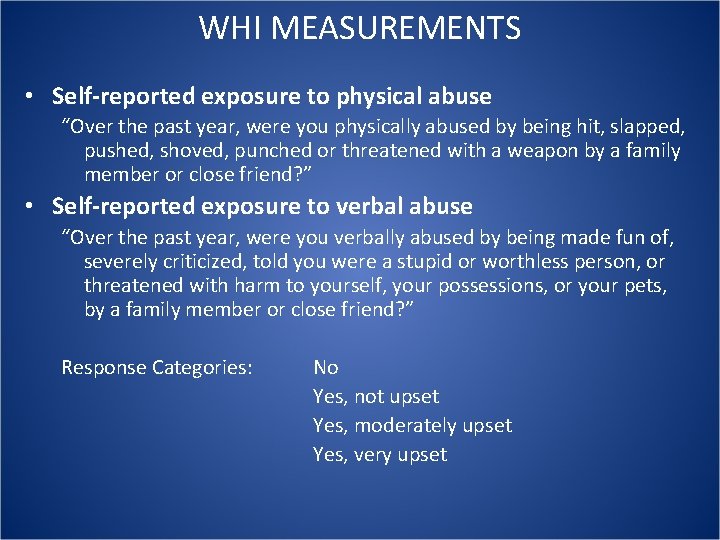
WHI MEASUREMENTS • Self-reported exposure to physical abuse “Over the past year, were you physically abused by being hit, slapped, pushed, shoved, punched or threatened with a weapon by a family member or close friend? ” • Self-reported exposure to verbal abuse “Over the past year, were you verbally abused by being made fun of, severely criticized, told you were a stupid or worthless person, or threatened with harm to yourself, your possessions, or your pets, by a family member or close friend? ” Response Categories: No Yes, not upset Yes, moderately upset Yes, very upset
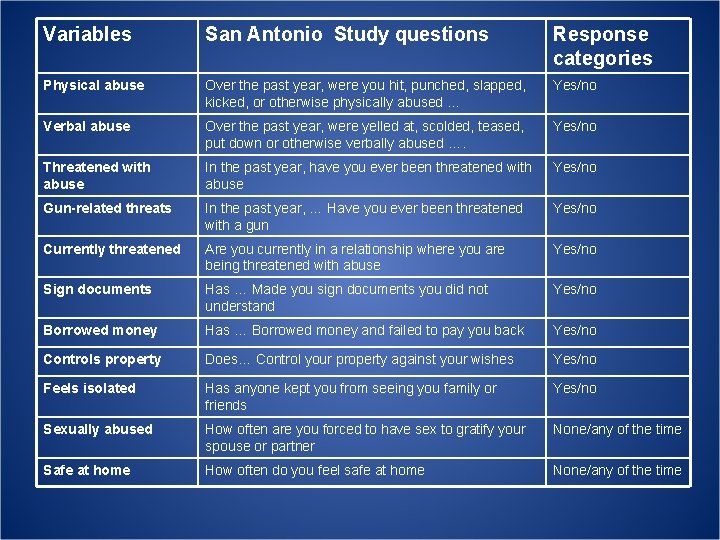
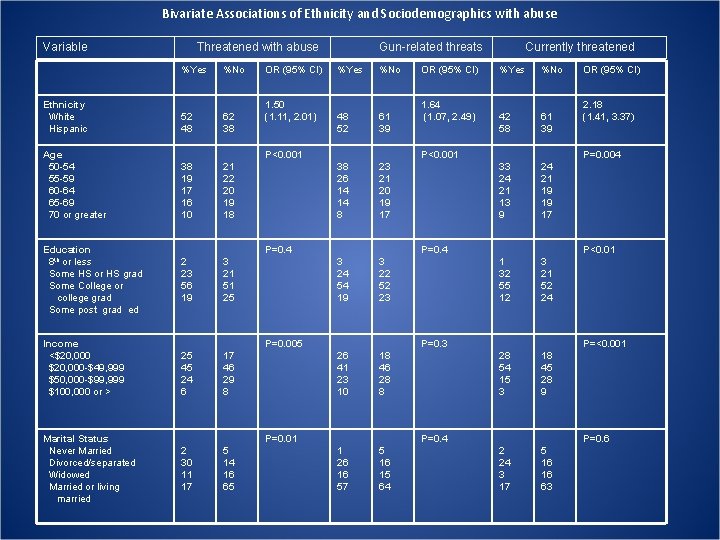
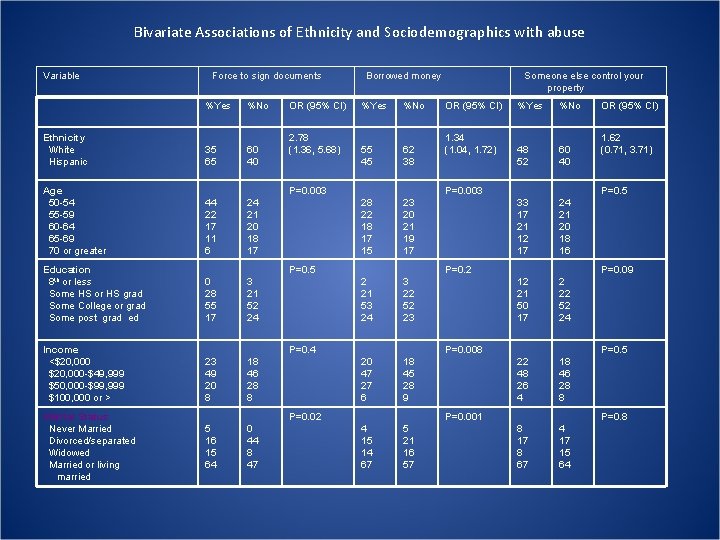
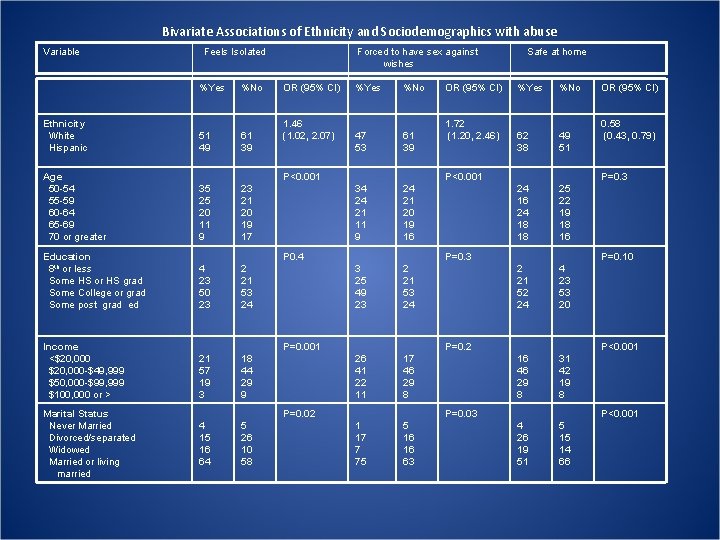
Variables San Antonio Study questions Response categories Physical abuse Over the past year, were you hit, punched, slapped, kicked, or otherwise physically abused … Yes/no Verbal abuse Over the past year, were yelled at, scolded, teased, put down or otherwise verbally abused …. Yes/no Threatened with abuse In the past year, have you ever been threatened with abuse Yes/no Gun-related threats In the past year, … Have you ever been threatened with a gun Yes/no Currently threatened Are you currently in a relationship where you are being threatened with abuse Yes/no Sign documents Has … Made you sign documents you did not understand Yes/no Borrowed money Has … Borrowed money and failed to pay you back Yes/no Controls property Does… Control your property against your wishes Yes/no Feels isolated Has anyone kept you from seeing you family or friends Yes/no Sexually abused How often are you forced to have sex to gratify your spouse or partner None/any of the time Safe at home How often do you feel safe at home None/any of the time
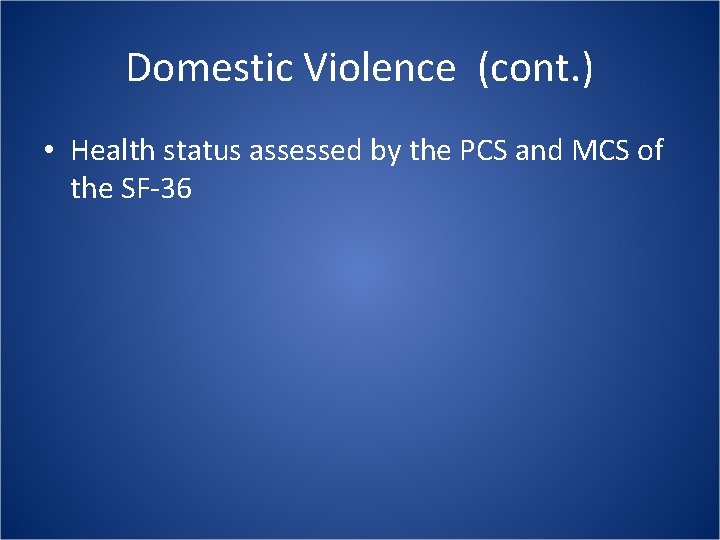
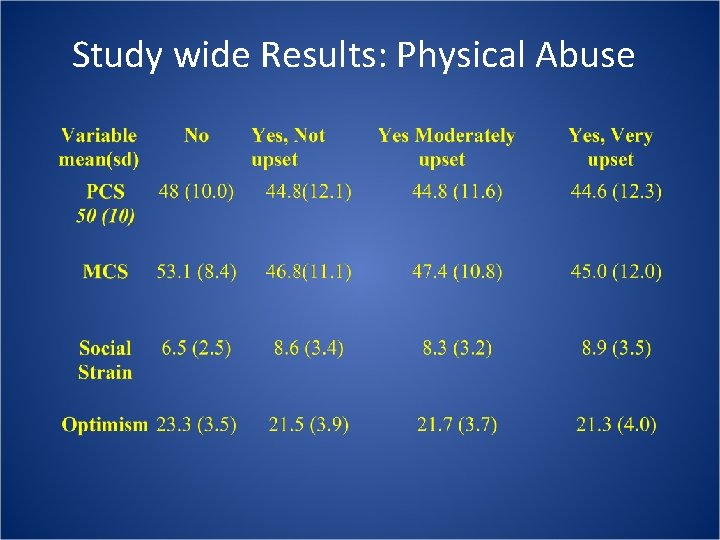
Domestic Violence (cont. ) • Health status assessed by the PCS and MCS of the SF-36
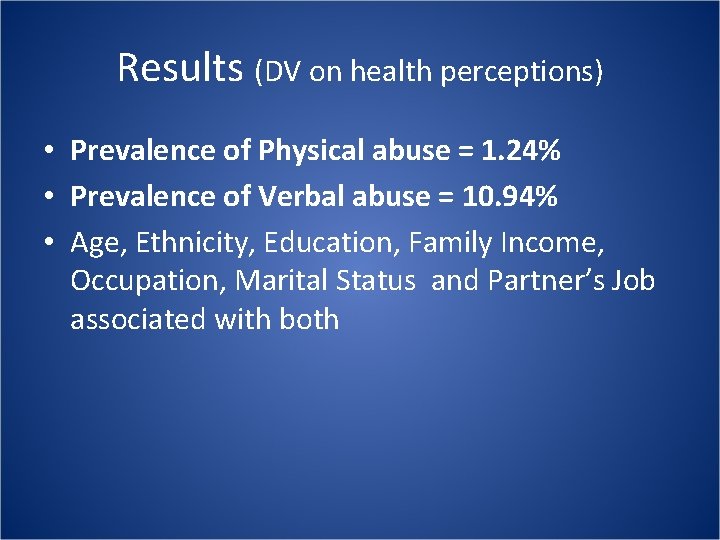
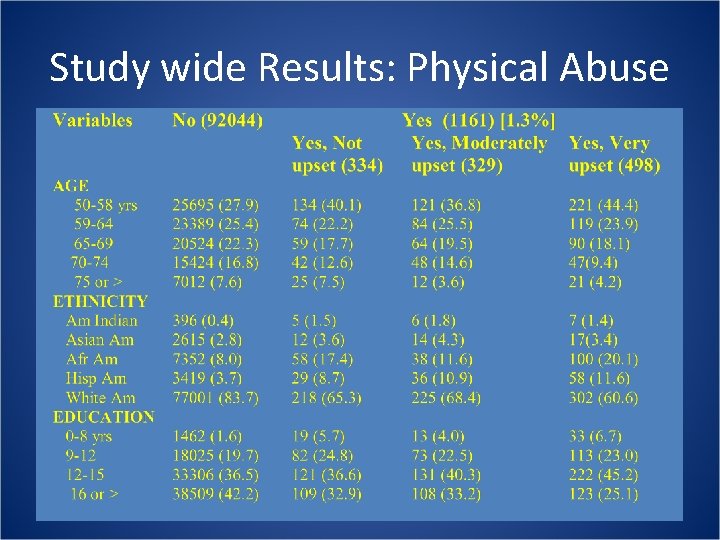
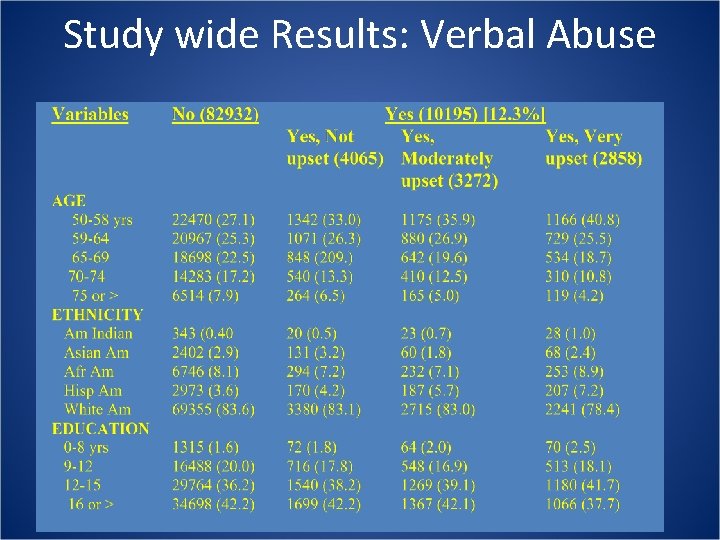
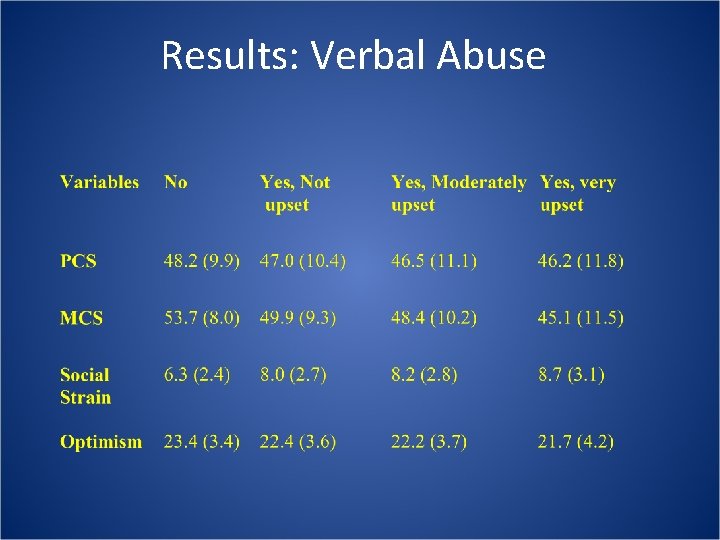
Results (DV on health perceptions) • Prevalence of Physical abuse = 1. 24% • Prevalence of Verbal abuse = 10. 94% • Age, Ethnicity, Education, Family Income, Occupation, Marital Status and Partner’s Job associated with both
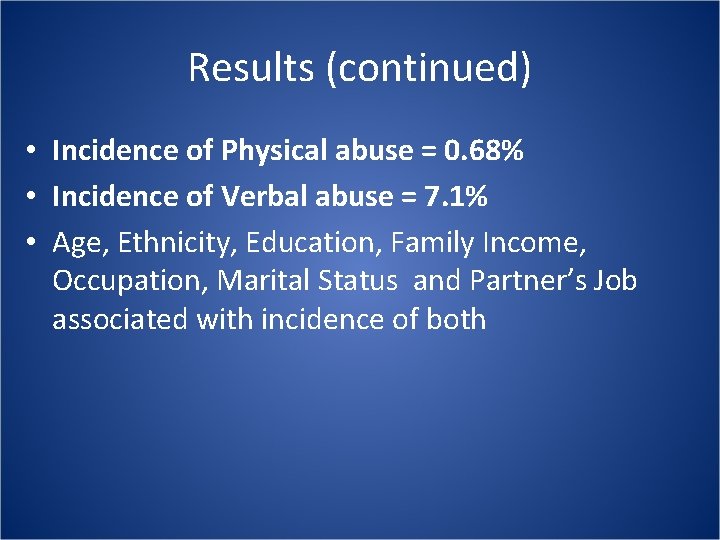
Results (continued) • Incidence of Physical abuse = 0. 68% • Incidence of Verbal abuse = 7. 1% • Age, Ethnicity, Education, Family Income, Occupation, Marital Status and Partner’s Job associated with incidence of both
Study wide Results: Physical Abuse
Study wide Results: Verbal Abuse
Study wide Results: Physical Abuse
Results: Verbal Abuse
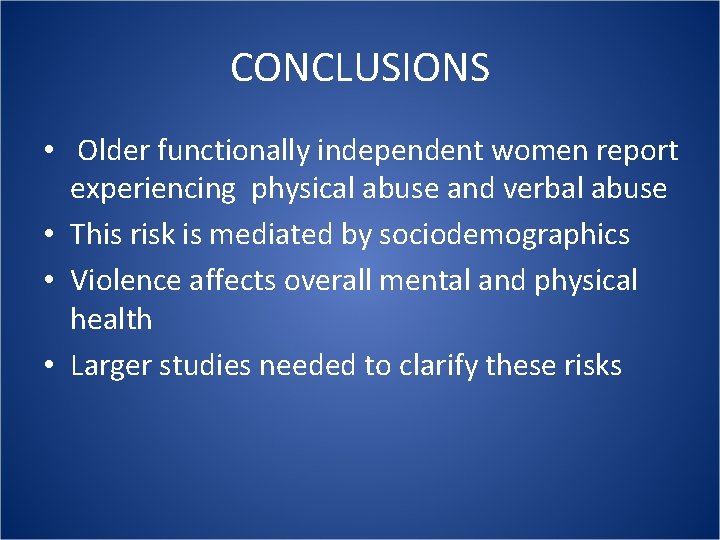
CONCLUSIONS • Older functionally independent women report experiencing physical abuse and verbal abuse • This risk is mediated by sociodemographics • Violence affects overall mental and physical health • Larger studies needed to clarify these risks
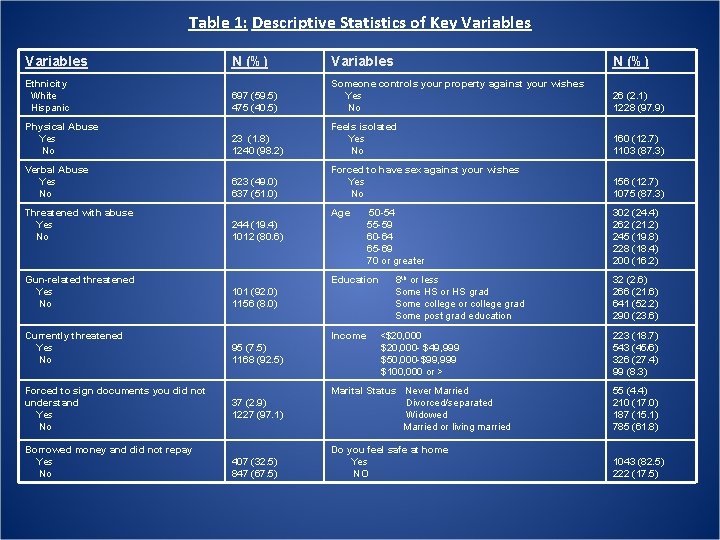
San Antonio Results
Table 1: Descriptive Statistics of Key Variables N (%) Ethnicity White Hispanic 697 (59. 5) 475 (40. 5) Someone controls your property against your wishes Yes No 26 (2. 1) 1228 (97. 9) Physical Abuse Yes No 23 (1. 8) 1240 (98. 2) Feels isolated Yes No 160 (12. 7) 1103 (87. 3) Verbal Abuse Yes No 623 (49. 0) 637 (51. 0) Forced to have sex against your wishes Yes No 156 (12. 7) 1075 (87. 3) Threatened with abuse Yes No 244 (19. 4) 1012 (80. 6) Gun-related threatened Yes No 101 (92. 0) 1156 (8. 0) Currently threatened Yes No 95 (7. 5) 1168 (92. 5) <$20, 000 - $49, 999 $50, 000 -$99, 999 $100, 000 or > 223 (18. 7) 543 (45/6) 326 (27. 4) 99 (8. 3) 37 (2. 9) 1227 (97. 1) Marital Status Never Married Divorced/separated Widowed Married or living married 55 (4. 4) 210 (17. 0) 187 (15. 1) 785 (61. 8) Do you feel safe at home Yes NO 1043 (82. 5) 222 (17. 5) Forced to sign documents you did not understand Yes No Borrowed money and did not repay Yes No Age 50 -54 55 -59 60 -64 65 -69 70 or greater Education Income 407 (32. 5) 847 (67. 5) 8 th or less Some HS or HS grad Some college or college grad Some post grad education 302 (24. 4) 262 (21. 2) 245 (19. 8) 228 (18. 4) 200 (16. 2) 32 (2. 6) 266 (21. 6) 641 (52. 2) 290 (23. 6)
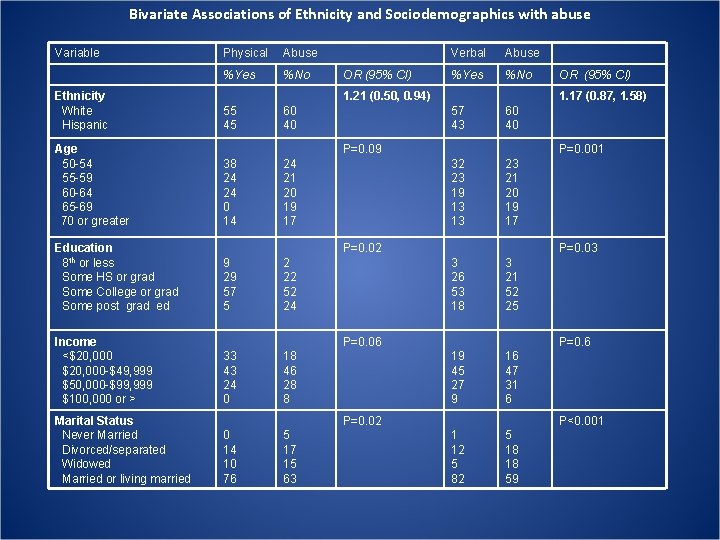
Bivariate Associations of Ethnicity and Sociodemographics with abuse Variable Physical Abuse %Yes %No Ethnicity White Hispanic 55 45 60 40 Age 50 -54 55 -59 60 -64 65 -69 70 or greater 38 24 24 0 14 24 21 20 19 17 Education 8 th or less Some HS or grad Some College or grad Some post grad ed 9 29 57 5 2 22 52 24 OR (95% CI) Verbal Abuse %Yes %No 57 43 60 40 32 23 19 13 13 23 21 20 19 17 3 26 53 18 3 21 52 25 1. 21 (0. 50, 0. 94) 1. 17 (0. 87, 1. 58) P=0. 09 P=0. 001 P=0. 02 Income <$20, 000 -$49, 999 $50, 000 -$99, 999 $100, 000 or > 33 43 24 0 18 46 28 8 Marital Status Never Married Divorced/separated Widowed Married or living married 0 14 10 76 5 17 15 63 OR (95% CI) P=0. 03 P=0. 06 P=0. 6 19 45 27 9 16 47 31 6 1 12 5 82 5 18 18 59 P=0. 02 P<0. 001
Bivariate Associations of Ethnicity and Sociodemographics with abuse Variable Threatened with abuse %Yes %No Ethnicity White Hispanic 52 48 62 38 Age 50 -54 55 -59 60 -64 65 -69 70 or greater 38 19 17 16 10 21 22 20 19 18 2 23 56 19 3 21 51 25 25 45 24 6 17 46 29 8 2 30 11 17 5 14 16 65 Education 8 th or less Some HS or HS grad Some College or college grad Some post grad ed Income <$20, 000 -$49, 999 $50, 000 -$99, 999 $100, 000 or > Marital Status Never Married Divorced/separated Widowed Married or living married OR (95% CI) 1. 50 (1. 11, 2. 01) Gun-related threats %Yes %No 48 52 61 39 38 26 14 14 8 23 21 20 19 17 3 24 54 19 3 22 52 23 26 41 23 10 18 46 28 8 1 26 16 57 5 16 15 64 P<0. 001 OR (95% CI) 1. 64 (1. 07, 2. 49) Currently threatened %Yes %No 42 58 61 39 33 24 21 13 9 24 21 19 19 17 1 32 55 12 3 21 52 24 28 54 15 3 18 45 28 9 2 24 3 17 5 16 16 63 P<0. 001 P=0. 4 P<0. 01 P=0. 3 P=0. 01 2. 18 (1. 41, 3. 37) P=0. 004 P=0. 005 OR (95% CI) P=<0. 001 P=0. 4 P=0. 6
Bivariate Associations of Ethnicity and Sociodemographics with abuse Variable Force to sign documents %Yes %No Ethnicity White Hispanic 35 65 60 40 Age 50 -54 55 -59 60 -64 65 -69 70 or greater 44 22 17 11 6 24 21 20 18 17 Education 8 th or less Some HS or HS grad Some College or grad Some post grad ed 0 28 55 17 3 21 52 24 Income <$20, 000 -$49, 999 $50, 000 -$99, 999 $100, 000 or > 23 49 20 8 18 46 28 8 5 16 15 64 0 44 8 47 Marital Status Never Married Divorced/separated Widowed Married or living married OR (95% CI) 2. 78 (1. 36, 5. 68) Borrowed money %Yes %No 55 45 62 38 28 22 18 17 15 23 20 21 19 17 2 21 53 24 3 22 52 23 20 47 27 6 18 45 28 9 4 15 14 67 5 21 16 57 P=0. 003 Someone else control your property OR (95% CI) 1. 34 (1. 04, 1. 72) %Yes %No 48 52 60 40 33 17 21 12 17 24 21 20 18 16 12 21 50 17 2 22 52 24 22 48 26 4 18 46 28 8 8 17 8 67 4 17 15 64 P=0. 003 P=0. 5 P=0. 09 P=0. 008 P=0. 02 1. 62 (0. 71, 3. 71) P=0. 5 P=0. 2 P=0. 4 OR (95% CI) P=0. 5 P=0. 001 P=0. 8
Bivariate Associations of Ethnicity and Sociodemographics with abuse Variable Feels Isolated %Yes %No Ethnicity White Hispanic 51 49 61 39 Age 50 -54 55 -59 60 -64 65 -69 70 or greater 35 25 20 11 9 23 21 20 19 17 Education 8 th or less Some HS or HS grad Some College or grad Some post grad ed 4 23 50 23 2 21 53 24 Income <$20, 000 -$49, 999 $50, 000 -$99, 999 $100, 000 or > 21 57 19 3 18 44 29 9 4 15 16 64 5 26 10 58 Marital Status Never Married Divorced/separated Widowed Married or living married Forced to have sex against wishes OR (95% CI) 1. 46 (1. 02, 2. 07) %Yes %No 47 53 61 39 34 24 21 11 9 24 21 20 19 16 3 25 49 23 2 21 53 24 26 41 22 11 17 46 29 8 1 17 7 75 5 16 16 63 P<0. 001 OR (95% CI) 1. 72 (1. 20, 2. 46) Safe at home %Yes %No 62 38 49 51 24 16 24 18 18 25 22 19 18 16 2 21 52 24 4 23 53 20 16 46 29 8 31 42 19 8 4 26 19 51 5 15 14 66 P<0. 001 P 0. 4 P=0. 10 P=0. 2 P=0. 02 0. 58 (0. 43, 0. 79) P=0. 3 P=0. 001 OR (95% CI) P<0. 001 P=0. 03 P<0. 001
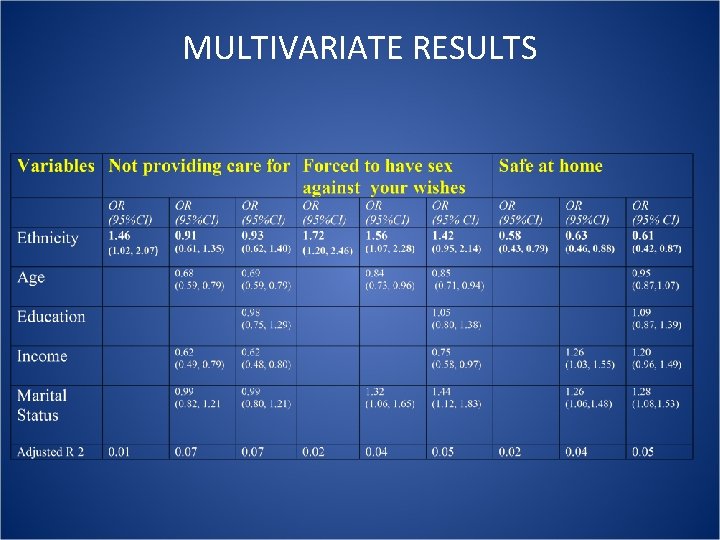
MULTIVARIATE RESULTS
MULTIVARIATE RESULTS
MULTIVARIATE RESULTS
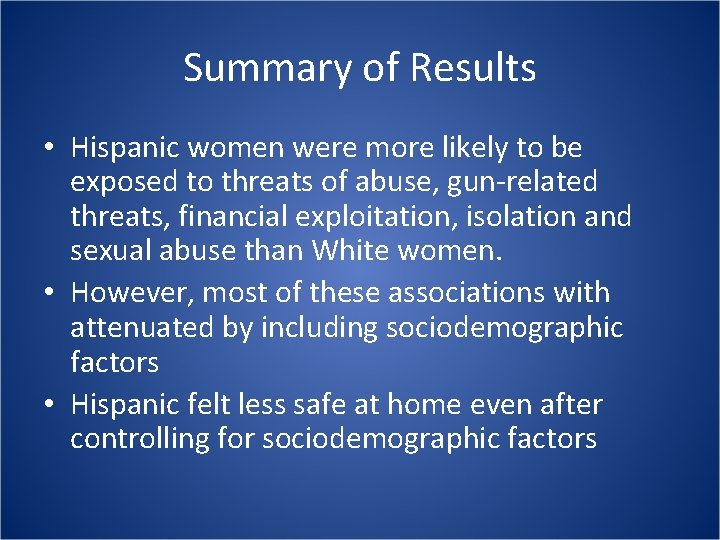
Summary of Results • Hispanic women were more likely to be exposed to threats of abuse, gun-related threats, financial exploitation, isolation and sexual abuse than White women. • However, most of these associations with attenuated by including sociodemographic factors • Hispanic felt less safe at home even after controlling for sociodemographic factors