K12 AND P20 WORKFORCE CONNECTIONS Carol Jenner Washington


- Slides: 23
K-12 AND P-20 WORKFORCE CONNECTIONS Carol Jenner Washington Education Research & Data Center National Forum on Education Statistics Winter Forum Meeting February 21, 2011
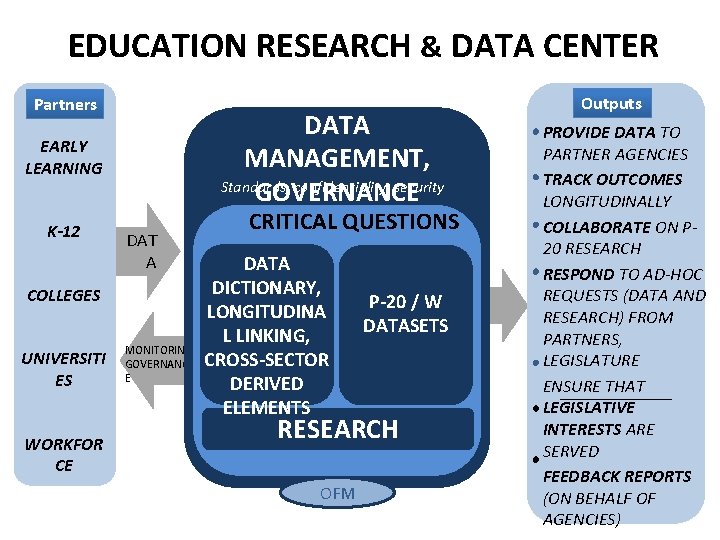
EDUCATION RESEARCH & DATA CENTER Partners DATA MANAGEMENT, Standards, confidentiality, security GOVERNANCE EARLY LEARNING K-12 DAT A COLLEGES UNIVERSITI ES WORKFOR CE MONITORING, GOVERNANC E CRITICAL QUESTIONS DATA DICTIONARY, LONGITUDINA L LINKING, CROSS-SECTOR DERIVED ELEMENTS P-20 / W DATASETS RESEARCH OFM Outputs PROVIDE DATA TO PARTNER AGENCIES TRACK OUTCOMES LONGITUDINALLY COLLABORATE ON P 20 RESEARCH RESPOND TO AD-HOC REQUESTS (DATA AND RESEARCH) FROM PARTNERS, LEGISLATURE ENSURE THAT LEGISLATIVE INTERESTS ARE SERVED FEEDBACK REPORTS (ON BEHALF OF AGENCIES)
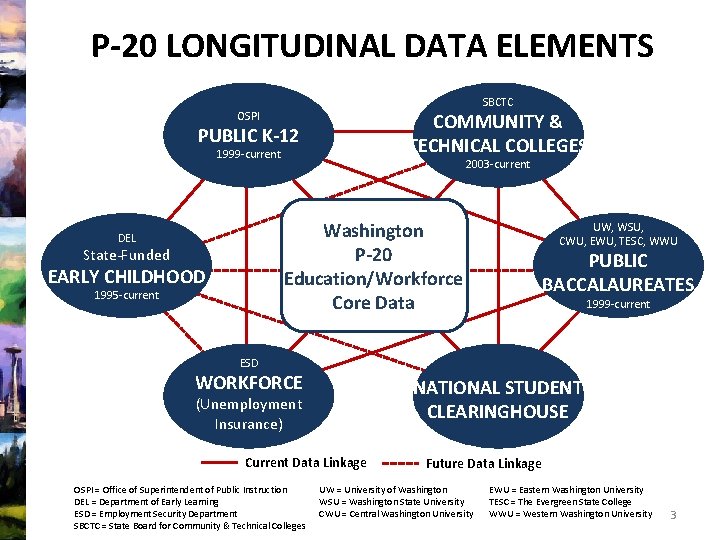
P-20 LONGITUDINAL DATA ELEMENTS SBCTC OSPI COMMUNITY & TECHNICAL COLLEGES PUBLIC K-12 1999 -current 2003 -current Washington P-20 Education/Workforce Core Data DEL State-Funded EARLY CHILDHOOD 1995 -current UW, WSU, CWU, EWU, TESC, WWU PUBLIC BACCALAUREATES 1999 -current ESD WORKFORCE NATIONAL STUDENT CLEARINGHOUSE (Unemployment Insurance) Current Data Linkage OSPI = Office of Superintendent of Public Instruction DEL = Department of Early Learning ESD = Employment Security Department SBCTC = State Board for Community & Technical Colleges Future Data Linkage UW = University of Washington WSU = Washington State University CWU = Central Washington University EWU = Eastern Washington University TESC = The Evergreen State College WWU = Western Washington University 3
WHY LINK TO WORKFORCE INFORMATION? EMPLOYMENT STATUS of students (high school and postsecondary): How many students are employed during the school year? How many hours per week do they work? How much do they earn? How does workforce participation relate to grades, postsecondary enrollment, persistence in postsecondary enrollment? 4
WHY LINK TO WORKFORCE INFORMATION? Employment as an OUTCOME: Do graduates enter the workforce immediately upon graduation? How many college graduates remain in the state for work? How do employment and enrollment after high school relate to employment patterns established during high school? What are the workforce outcomes for completers of a particular program in my school? (Career/Technical Education, for example) 5
WHERE ARE THE WORKFORCE DATA? Education data sources include K-12 student information systems and P-20 data from other sectors (SSN required for linking to workforce) Workforce data from the state agency administering the Unemployment Insurance program (wage and claimant data) Labor Market Information (LMI) directors are helpful in arranging for linking. www. bls. gov/bls/ofolist. htm 6
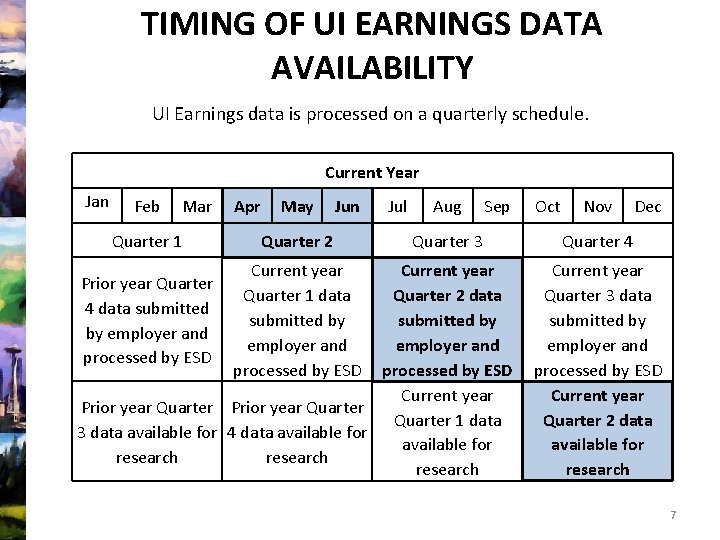
TIMING OF UI EARNINGS DATA AVAILABILITY UI Earnings data is processed on a quarterly schedule. Current Year Jan Feb Mar Quarter 1 Apr May Jun Quarter 2 Aug Sep Quarter 3 Current year Quarter 2 data submitted by employer and processed by ESD Current year Prior year Quarter 1 data 3 data available for 4 data available for research Prior year Quarter 4 data submitted by employer and processed by ESD Current year Quarter 1 data submitted by employer and processed by ESD Jul Oct Nov Dec Quarter 4 Current year Quarter 3 data submitted by employer and processed by ESD Current year Quarter 2 data available for research 7
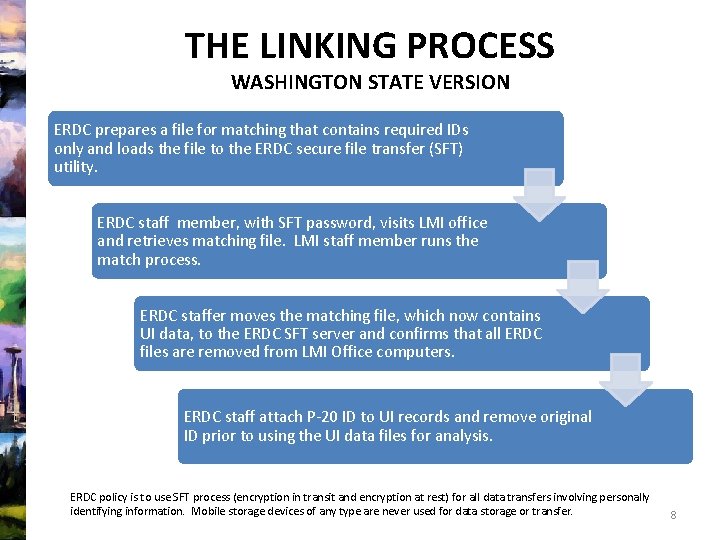
THE LINKING PROCESS WASHINGTON STATE VERSION ERDC prepares a file for matching that contains required IDs only and loads the file to the ERDC secure file transfer (SFT) utility. ERDC staff member, with SFT password, visits LMI office and retrieves matching file. LMI staff member runs the match process. ERDC staffer moves the matching file, which now contains UI data, to the ERDC SFT server and confirms that all ERDC files are removed from LMI Office computers. ERDC staff attach P-20 ID to UI records and remove original ID prior to using the UI data files for analysis. ERDC policy is to use SFT process (encryption in transit and encryption at rest) for all data transfers involving personally identifying information. Mobile storage devices of any type are never used for data storage or transfer. 8
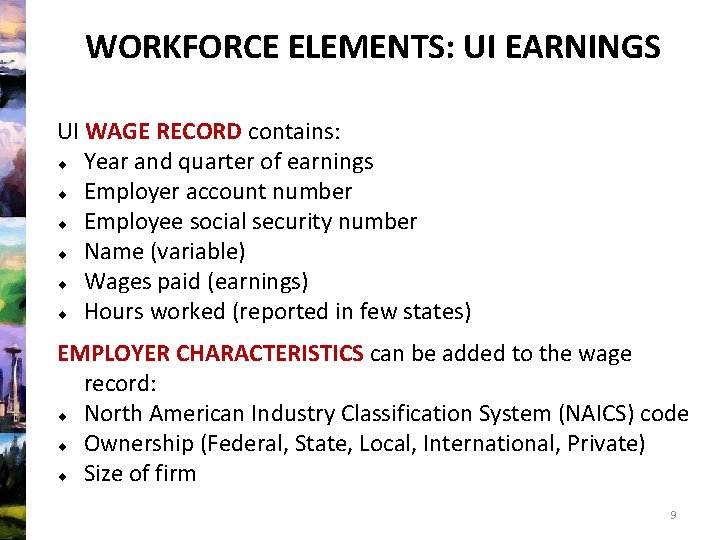
WORKFORCE ELEMENTS: UI EARNINGS UI WAGE RECORD contains: Year and quarter of earnings Employer account number Employee social security number Name (variable) Wages paid (earnings) Hours worked (reported in few states) EMPLOYER CHARACTERISTICS can be added to the wage record: North American Industry Classification System (NAICS) code Ownership (Federal, State, Local, International, Private) Size of firm 9
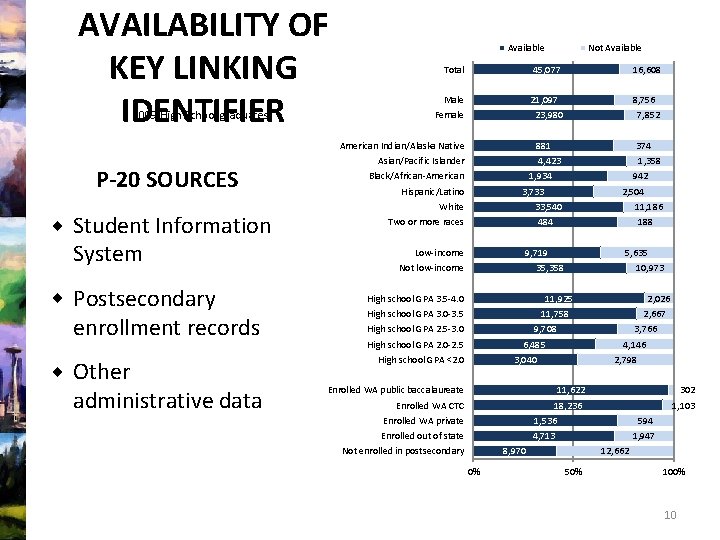
AVAILABILITY OF KEY LINKING IDENTIFIER 2009 High School graduates Available Total 45, 077 16, 608 Male 21, 097 8, 756 Female American Indian/Alaska Native P-20 SOURCES Student Information System Postsecondary enrollment records Other administrative data Not Available 23, 980 7, 852 881 374 Asian/Pacific Islander 4, 423 Black/African-American 1, 358 1, 934 942 3, 733 Hispanic/Latino White 2, 504 33, 540 Two or more races 11, 186 484 Low-income 188 9, 719 5, 635 35, 358 Not low-income High school GPA 3. 5 -4. 0 10, 973 11, 925 High school GPA 3. 0 -3. 5 2, 026 11, 758 High school GPA 2. 5 -3. 0 2, 667 9, 708 High school GPA 2. 0 -2. 5 3, 766 6, 485 High school GPA <2. 0 4, 146 3, 040 2, 798 Enrolled WA public baccalaureate 11, 622 Enrolled WA CTC 302 18, 236 1, 103 Enrolled WA private 1, 536 594 Enrolled out of state 4, 713 1, 947 Not enrolled in postsecondary 8, 970 0% 12, 662 50% 10
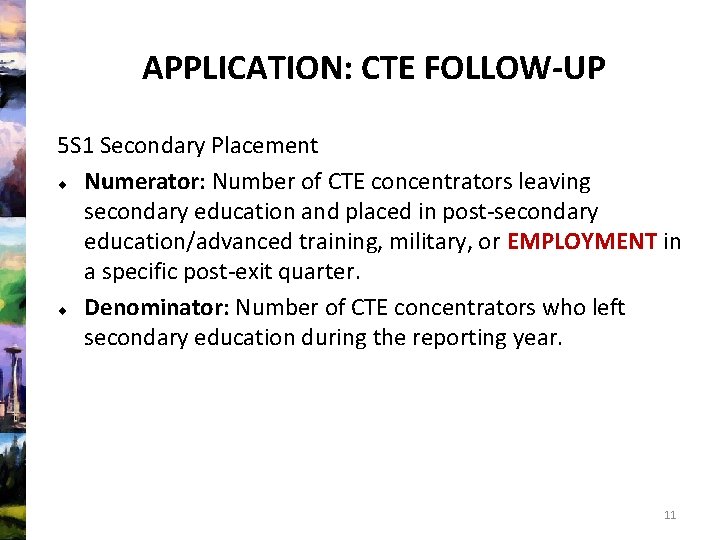
APPLICATION: CTE FOLLOW-UP 5 S 1 Secondary Placement Numerator: Number of CTE concentrators leaving secondary education and placed in post-secondary education/advanced training, military, or EMPLOYMENT in a specific post-exit quarter. Denominator: Number of CTE concentrators who left secondary education during the reporting year. 11
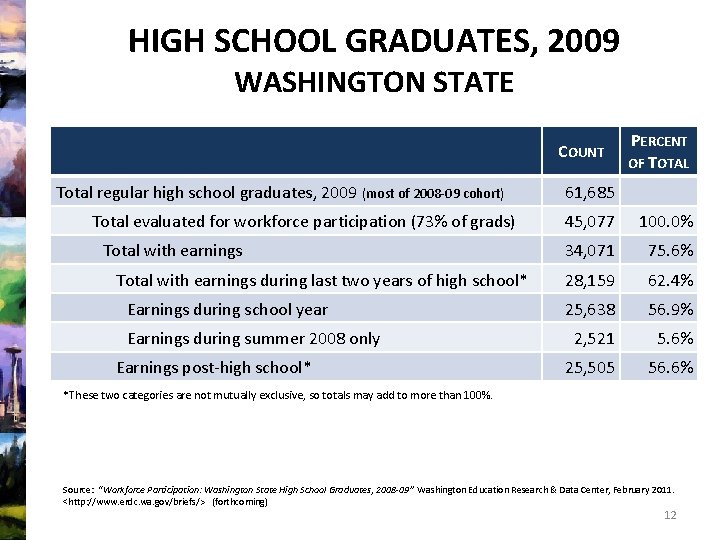
HIGH SCHOOL GRADUATES, 2009 WASHINGTON STATE COUNT Total regular high school graduates, 2009 (most of 2008 -09 cohort) Total evaluated for workforce participation (73% of grads) Total with earnings during last two years of high school* Earnings during school year Earnings during summer 2008 only Earnings post-high school* PERCENT OF TOTAL 61, 685 45, 077 100. 0% 34, 071 75. 6% 28, 159 62. 4% 25, 638 56. 9% 2, 521 5. 6% 25, 505 56. 6% *These two categories are not mutually exclusive, so totals may add to more than 100%. Source: “Workforce Participation: Washington State High School Graduates, 2008 -09” Washington Education Research & Data Center, February 2011. <http: //www. erdc. wa. gov/briefs/> (forthcoming) 12
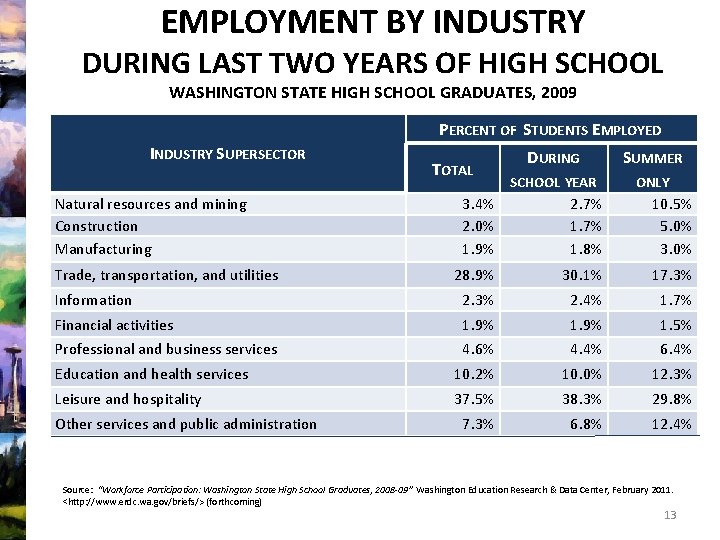
EMPLOYMENT BY INDUSTRY DURING LAST TWO YEARS OF HIGH SCHOOL WASHINGTON STATE HIGH SCHOOL GRADUATES, 2009 PERCENT OF STUDENTS EMPLOYED INDUSTRY SUPERSECTOR Natural resources and mining Construction Manufacturing TOTAL DURING SUMMER SCHOOL YEAR ONLY 3. 4% 2. 0% 1. 9% 2. 7% 1. 8% 10. 5% 5. 0% 3. 0% 28. 9% 30. 1% 17. 3% Information 2. 3% 2. 4% 1. 7% Financial activities 1. 9% 1. 5% Professional and business services 4. 6% 4. 4% 6. 4% Education and health services 10. 2% 10. 0% 12. 3% Leisure and hospitality 37. 5% 38. 3% 29. 8% 7. 3% 6. 8% 12. 4% Trade, transportation, and utilities Other services and public administration Source: “Workforce Participation: Washington State High School Graduates, 2008 -09” Washington Education Research & Data Center, February 2011. <http: //www. erdc. wa. gov/briefs/> (forthcoming) 13
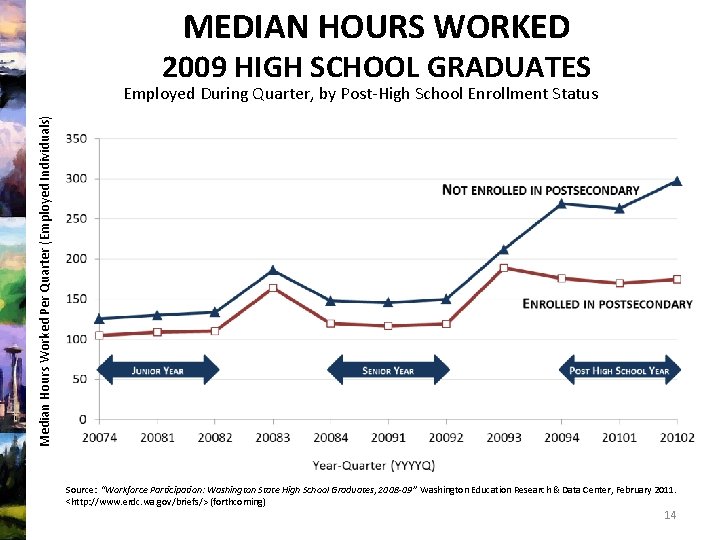
MEDIAN HOURS WORKED 2009 HIGH SCHOOL GRADUATES Median Hours Worked Per Quarter (Employed Individuals) Employed During Quarter, by Post-High School Enrollment Status Source: “Workforce Participation: Washington State High School Graduates, 2008 -09” Washington Education Research & Data Center, February 2011. <http: //www. erdc. wa. gov/briefs/> (forthcoming) 14
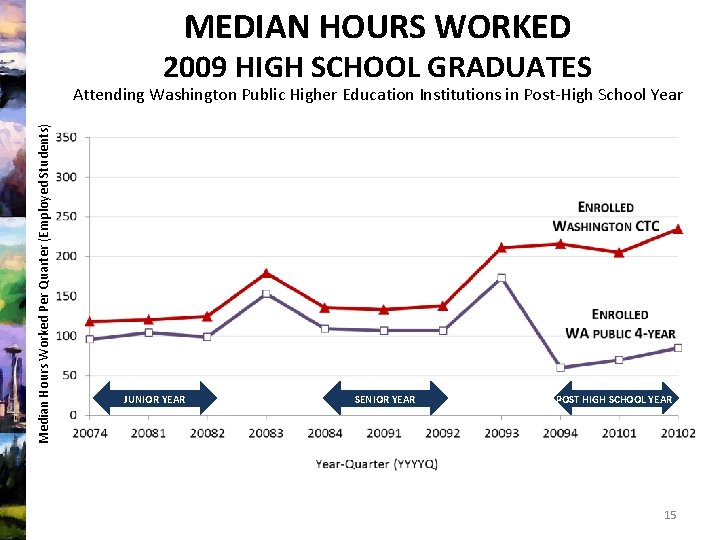
MEDIAN HOURS WORKED 2009 HIGH SCHOOL GRADUATES Median Hours Worked Per Quarter (Employed Students) Attending Washington Public Higher Education Institutions in Post-High School Year JUNIOR YEAR SENIOR YEAR POST HIGH SCHOOL YEAR 15
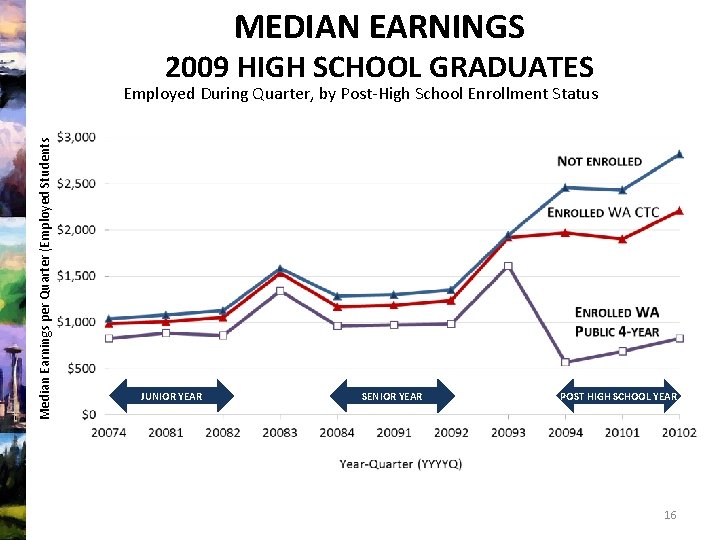
MEDIAN EARNINGS 2009 HIGH SCHOOL GRADUATES Median Earnings per Quarter (Employed Students Employed During Quarter, by Post-High School Enrollment Status JUNIOR YEAR SENIOR YEAR POST HIGH SCHOOL YEAR 16
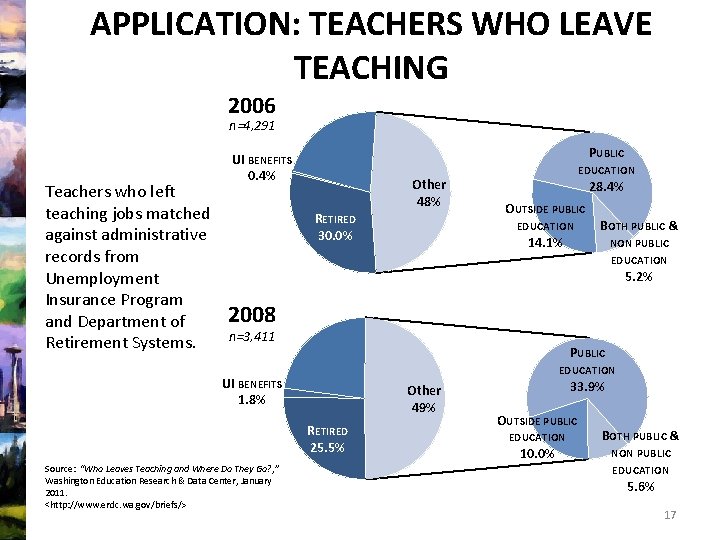
APPLICATION: TEACHERS WHO LEAVE TEACHING LOCATED 2006 NOT 21. 9% n=4, 291 Teachers who left teaching jobs matched against administrative records from Unemployment Insurance Program and Department of Retirement Systems. PUBLIC UI BENEFITS 0. 4% Other 48% RETIRED 30. 0% EDUCATION 28. 4% OUTSIDE PUBLIC EDUCATION 14. 1% BOTH PUBLIC & NON PUBLIC EDUCATION 5. 2% NOT LOCATED 2008 n=3, 41123. 2% PUBLIC EDUCATION UI BENEFITS 1. 8% Other 49% RETIRED 25. 5% Source: “Who Leaves Teaching and Where Do They Go? , ” Washington Education Research & Data Center, January 2011. <http: //www. erdc. wa. gov/briefs/> 33. 9% OUTSIDE PUBLIC EDUCATION BOTH PUBLIC & 10. 0% NON PUBLIC EDUCATION 5. 6% 17
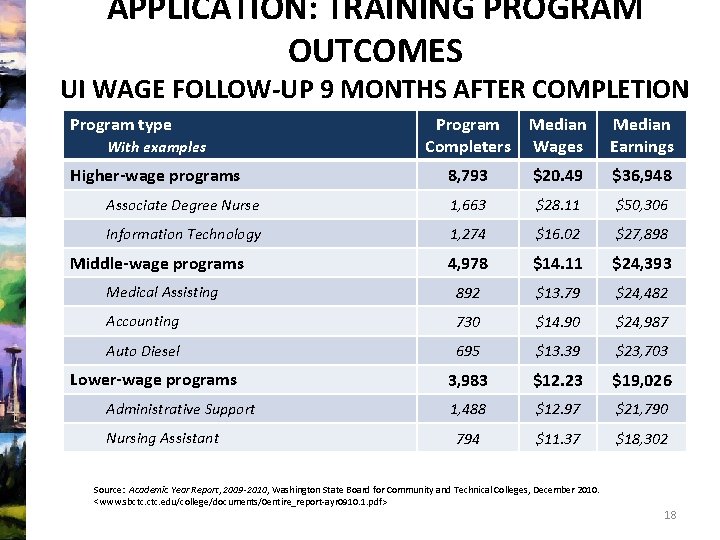
APPLICATION: TRAINING PROGRAM OUTCOMES UI WAGE FOLLOW-UP 9 MONTHS AFTER COMPLETION Program type With examples Program Completers Median Wages Median Earnings Higher-wage programs 8, 793 $20. 49 $36, 948 Associate Degree Nurse 1, 663 $28. 11 $50, 306 Information Technology 1, 274 $16. 02 $27, 898 4, 978 $14. 11 $24, 393 Medical Assisting 892 $13. 79 $24, 482 Accounting 730 $14. 90 $24, 987 Auto Diesel 695 $13. 39 $23, 703 3, 983 $12. 23 $19, 026 1, 488 $12. 97 $21, 790 794 $11. 37 $18, 302 Middle-wage programs Lower-wage programs Administrative Support Nursing Assistant Source: Academic Year Report, 2009 -2010, Washington State Board for Community and Technical Colleges, December 2010. <www. sbctc. edu/college/documents/0 entire_report-ayr 0910. 1. pdf> 18
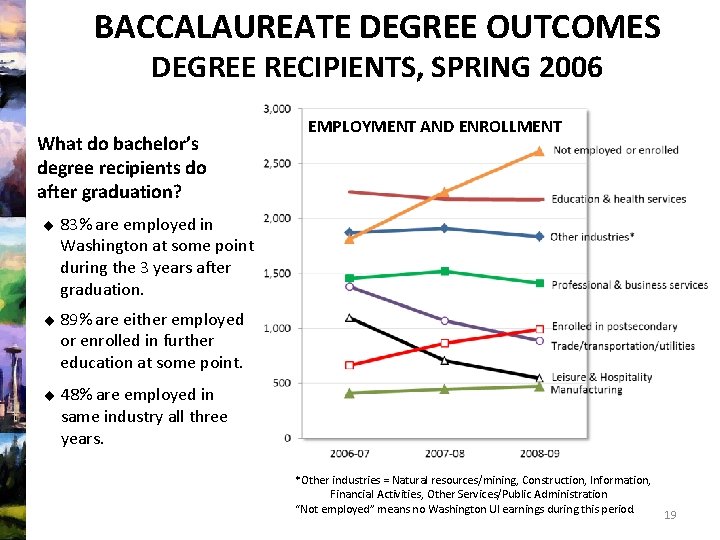
BACCALAUREATE DEGREE OUTCOMES DEGREE RECIPIENTS, SPRING 2006 What do bachelor’s degree recipients do after graduation? EMPLOYMENT AND ENROLLMENT 83% are employed in Washington at some point during the 3 years after graduation. 89% are either employed or enrolled in further education at some point. 48% are employed in same industry all three years. *Other industries = Natural resources/mining, Construction, Information, Financial Activities, Other Services/Public Administration “Not employed” means no Washington UI earnings during this period. 19
DATA-SHARING, DATA GOVERNANCE What is the governance process for the linked data? Currently, a case-by-case basis An ARRA grant project deliverable How are requests for the linked data handled? Currently, evaluated on a case-by-case basis Most requests involve summary data 20
FUTURE EDUCATION/WORKFORCE PLANS DROP-OUTS AND STOP-OUTS H. S. GRADUATING CLASS COHORTS - Analysis incorporating: Full-time/part-time enrollment status Financial aid information POSTSECONDARY Routine follow-up of graduates (10 years) into employment and further education “Swirl” study (outcomes for those who follow non-linear paths through postsecondary education) WORKFORCE Explore worker classification from Workers’ Compensation Expand data sources 21
ADDITIONAL WORKFORCE DATA SOURCES Federal Employment Data Exchange System (FEDES) – contains federal civilian employees, U. S. Postal Service employees, and Department of Defense active duty personnel. Operated by the Jacob France Institute at the University of Baltimore. http: //www. bls. gov/web/empsit/cestn 2. htm Wage Record Interchange System (WRIS) – a multistate collaborative that facilitates the exchange of wage data among participating states. http: //www. doleta. gov/performance/WRIS. cfm Administrative Data Research and Evaluation (ADARE) – a multi-state alliance (currently 9 state partners covering 43 percent of the U. S. civilian labor force) that facilitates access to administrative data for authorized research and evaluation purposes. Managed by the Jacob France Institute at the University of Baltimore. http: //www. ubalt. edu/jfi/adare/index. cfm Local Employment Dynamics (LED) program – a partnership between states and the U. S. Census Bureau that provides summary information on employment and earnings at local level. http: //lehd. did. census. gov/led/led. html 22
WASHINGTON EDUCATION RESEARCH & DATA CENTER 210 11 th Ave SW, Room 318 P. O. Box 43113 Olympia, WA 98504 -3113 Phone: (360) 902 -0599 www. erdc. wa. gov 23