Julio Auto julio funny a julioauto com Triaging
- Slides: 25
Julio Auto [julio {funny a} julioauto com] Triaging Bugs with Dynamic Dataflow Analysis
Agenda �The Problem �The Solution �Demo �Solution Details �What’s Next? �Greetings & References
Preface �We will be talking about analyzing closed- source software here �Absolutely no debugging information needed �However. . . �Depending on the complexity of the bug, even people with the source might opt for this analysis too E. g. Vendors receiving crash reports
The Problem �Sometimes people just have to analyze bugs in closed-source software �These bugs may come from: A fuzzing session Contributor-sent Proof-of-Concept codes In-the-wild exploit code Etc. . . �As varying as the sources of bugs are the reasons why one wants to analyze them, but this is irrelevant. The fact is. . .
The Problem (2) �ANALYZING BUGS CAN BE HARD! �A seasoned reverse engineer may take weeks to get somewhere If the target software is too big If the data consumed is in a very complex and/or undisclosed format If bugs in this target are so rare that your reversing team has no previous experience with it �But which bugs do we mostly care for?
The Problem (3) �“Analyzing bugs” is very broad No. /write-me-a-very-detailed-advisory �We will concentrate in answering one question: what exact part of my data made the program crash? �Understanding that and how such data is transformed is primordial
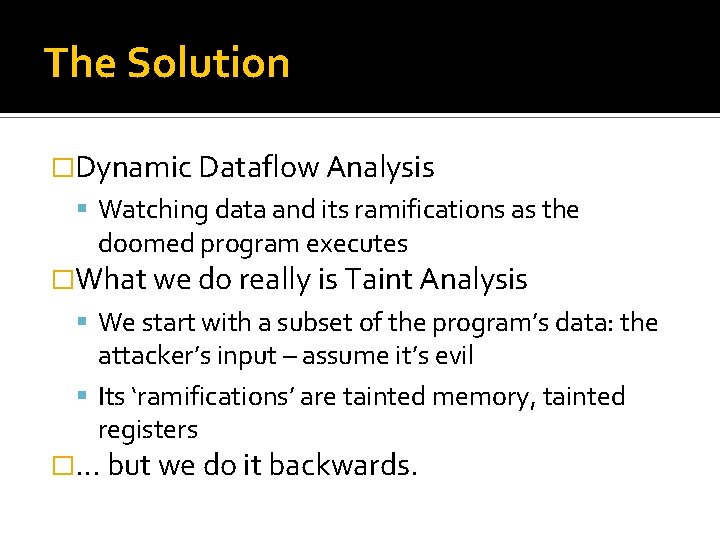
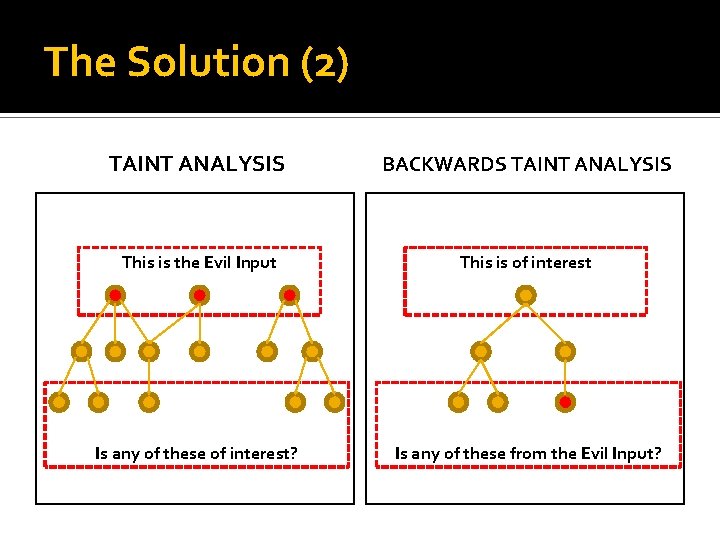
The Solution �Dynamic Dataflow Analysis Watching data and its ramifications as the doomed program executes �What we do really is Taint Analysis We start with a subset of the program’s data: the attacker’s input – assume it’s evil Its ‘ramifications’ are tainted memory, tainted registers �. . . but we do it backwards.
The Solution (2) TAINT ANALYSIS BACKWARDS TAINT ANALYSIS This is the Evil Input This is of interest Is any of these of interest? Is any of these from the Evil Input?
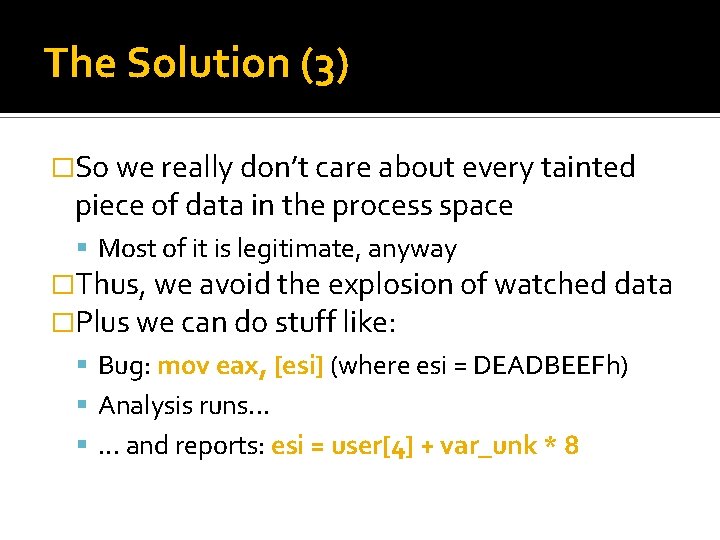
The Solution (3) �So we really don’t care about every tainted piece of data in the process space Most of it is legitimate, anyway �Thus, we avoid the explosion of watched data �Plus we can do stuff like: Bug: mov eax, [esi] (where esi = DEADBEEFh) Analysis runs. . . . and reports: esi = user[4] + var_unk * 8
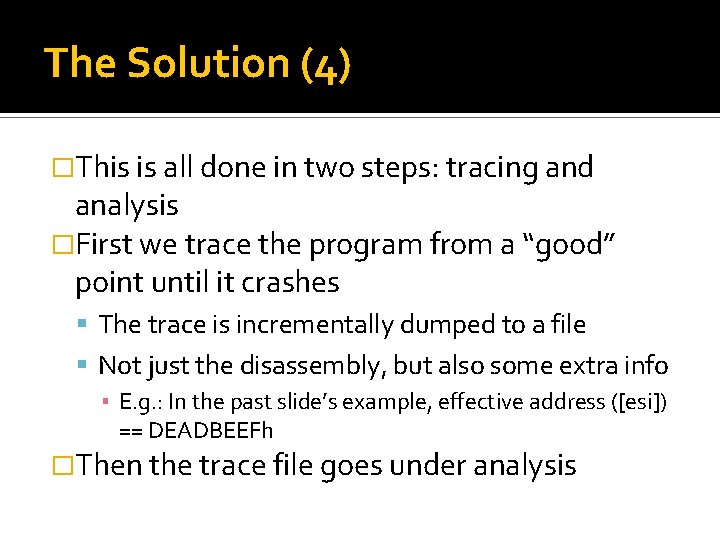
The Solution (4) �This is all done in two steps: tracing and analysis �First we trace the program from a “good” point until it crashes The trace is incrementally dumped to a file Not just the disassembly, but also some extra info ▪ E. g. : In the past slide’s example, effective address ([esi]) == DEADBEEFh �Then the trace file goes under analysis
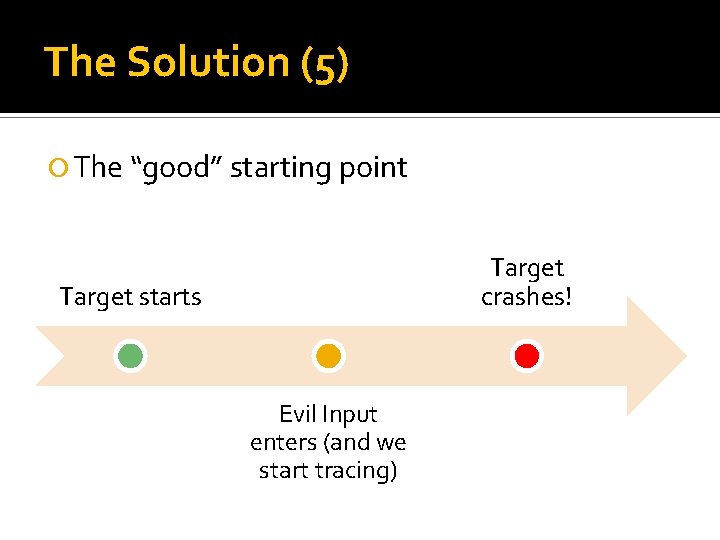
The Solution (5) The “good” starting point Target crashes! Target starts Evil Input enters (and we start tracing)
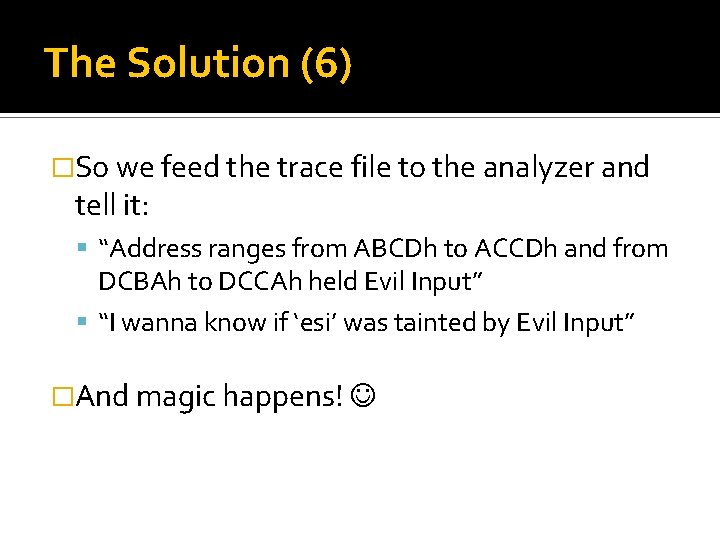
The Solution (6) �So we feed the trace file to the analyzer and tell it: “Address ranges from ABCDh to ACCDh and from DCBAh to DCCAh held Evil Input” “I wanna know if ‘esi’ was tainted by Evil Input” �And magic happens!
The Solution (7) �Considerations Tracing is very time-consuming ▪ For the bug I’ll analyze as an example, it takes about 2 hours to dump the 650, 000+ instructions it executes The analysis. . . not so much ▪ 1 to 2 minutes May sound like much, but how long would take to do it manually? ▪ Plus, you can always use this time to do something else while the computer is working for you
Demo �Introducing. . . Visual Data Tracer!
Solution Details �The VDT Tracer is implemented as a Win. Dbg extension Because Win. Dbg is free and it’s a great debugger �The VDT Analyzer is a stand-alone C++ app �The tracer needs to understand some simple instruction “semantics” E. g. : The source and destination operands Currently only the basic x 86 subset is implemented (no x 87, MMX, etc)
Solution Details (2) �The semantic rules are simplified to avoid dumping useless info to the trace file E. g. : a ‘push’ does not meaninfgully change ‘esp’ (same for ‘inc’, ‘dec’, and their destination ops) �They are also written to fit the very simplistic format of the trace file entries �All of this makes the analysis easier, thus faster, and yet useful
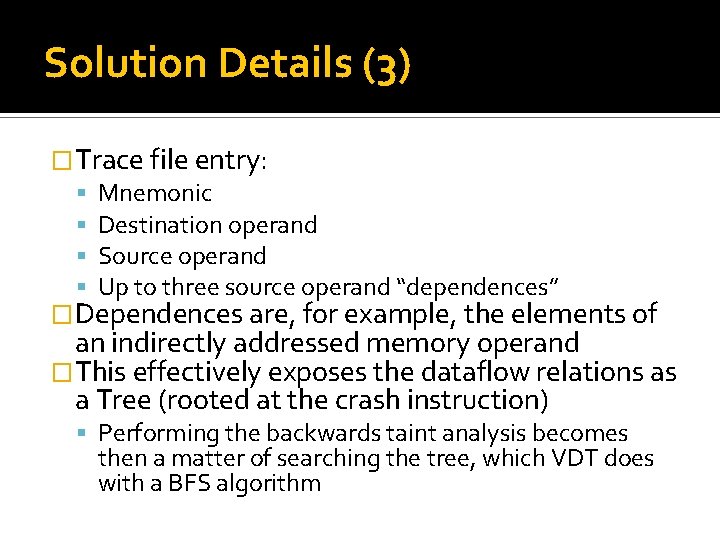
Solution Details (3) �Trace file entry: Mnemonic Destination operand Source operand Up to three source operand “dependences” �Dependences are, for example, the elements of an indirectly addressed memory operand �This effectively exposes the dataflow relations as a Tree (rooted at the crash instruction) Performing the backwards taint analysis becomes then a matter of searching the tree, which VDT does with a BFS algorithm
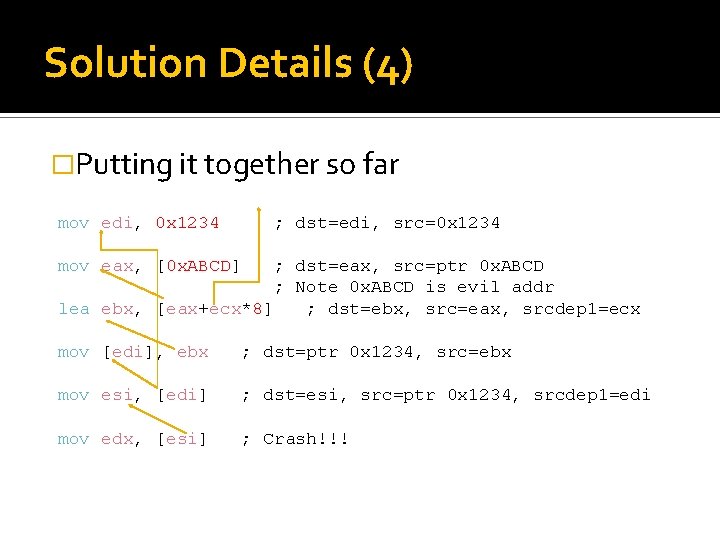
Solution Details (4) �Putting it together so far mov edi, 0 x 1234 ; dst=edi, src=0 x 1234 mov eax, [0 x. ABCD] ; dst=eax, src=ptr 0 x. ABCD ; Note 0 x. ABCD is evil addr lea ebx, [eax+ecx*8] ; dst=ebx, src=eax, srcdep 1=ecx mov [edi], ebx ; dst=ptr 0 x 1234, src=ebx mov esi, [edi] ; dst=esi, src=ptr 0 x 1234, srcdep 1=edi mov edx, [esi] ; Crash!!!
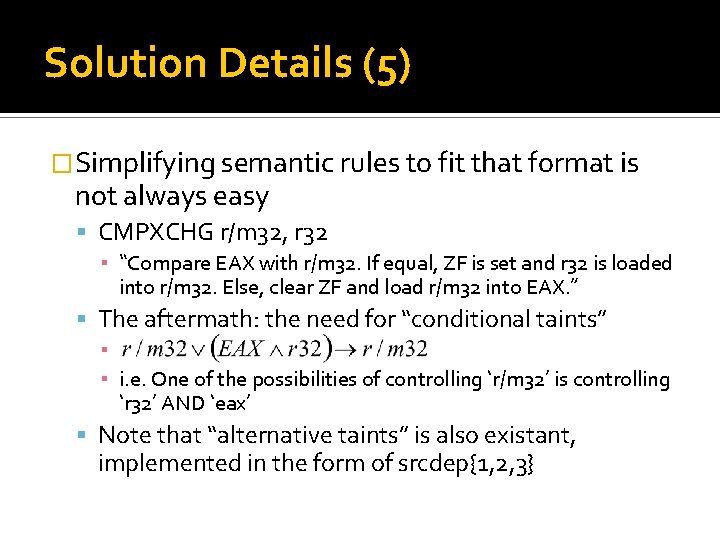
Solution Details (5) �Simplifying semantic rules to fit that format is not always easy CMPXCHG r/m 32, r 32 ▪ “Compare EAX with r/m 32. If equal, ZF is set and r 32 is loaded into r/m 32. Else, clear ZF and load r/m 32 into EAX. ” The aftermath: the need for “conditional taints” ▪ ▪ i. e. One of the possibilities of controlling ‘r/m 32’ is controlling ‘r 32’ AND ‘eax’ Note that “alternative taints” is also existant, implemented in the form of srcdep{1, 2, 3}
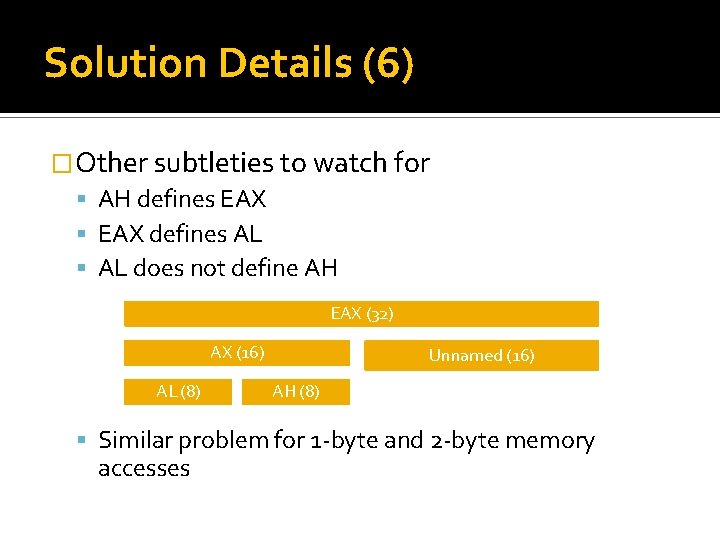
Solution Details (6) �Other subtleties to watch for AH defines EAX defines AL does not define AH EAX (32) AX (16) AL (8) Unnamed (16) AH (8) Similar problem for 1 -byte and 2 -byte memory accesses
Release �This is a private tool �Have not gone under public release so far �SOURCE attendees will get it, though PLEASE, do not redistribute �In the next few hours, downloadable at: http: //www. julioauto. com/VDT. zip �After I remove it from there, you can get it by e-mailing me
What’s Next? �Extending the coverage of x 86 �Enhancing speed God knows how. . . �Heuristically detecting user input e. g. By making the tracer understand Create. File() �Automatic exploit generation �What else? Any ideas, let me know. . .
References �Spider. Pig Project - http: //piotrbania. com/all/spiderpig/ Very similar ideas, different approach �!exploitable - http: //www. codeplex. com/msecdbg A more superficial (but much faster) tool for bug triaging If you have many bugs to triage, you can first run !exploitable on them and, then, use VDT on those that seem really interesting
Greetings �i. Sight Partners For sponsoring this work! �Julien Vanegue For all the lecturing, motivating and supporting �Piotr Bania For discussing DDF analysis and much more �People from PSV (http: //www. unprotectedhex. com/psv) For letting me idle on IRC, leeching their knowledge �Everyone else who talks to me about security and similarly cool stuff
Julio Auto [julio {funny a} julioauto com] Triaging Bugs with Dynamic Dataflow Analysis