
Electrical Activity of the Heart Introduction Where does







- Slides: 55
Electrical Activity of the Heart
Introduction ✦ Where does the “electro” in electrocardiography come from?
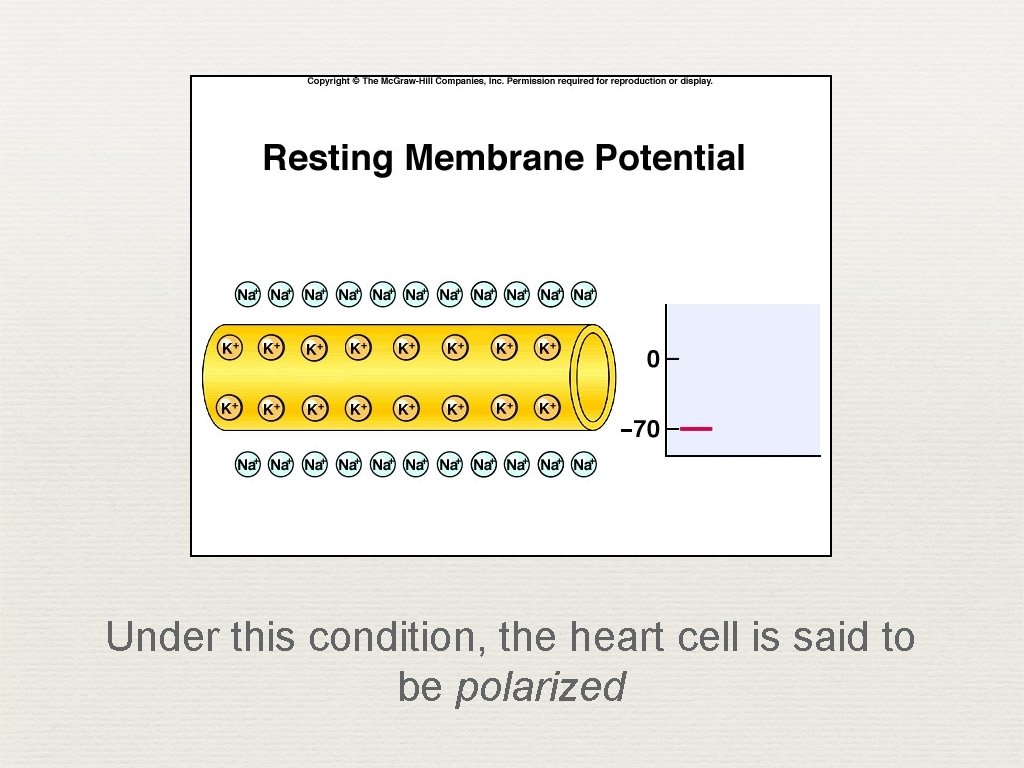
Under this condition, the heart cell is said to be polarized
Polarization ✦ ✦ ✦ Imagine two micro-electrodes; one outside the cell, one inside the cell Difference between the two equals -90 m. V inside The cell is said to be ‘polarized’
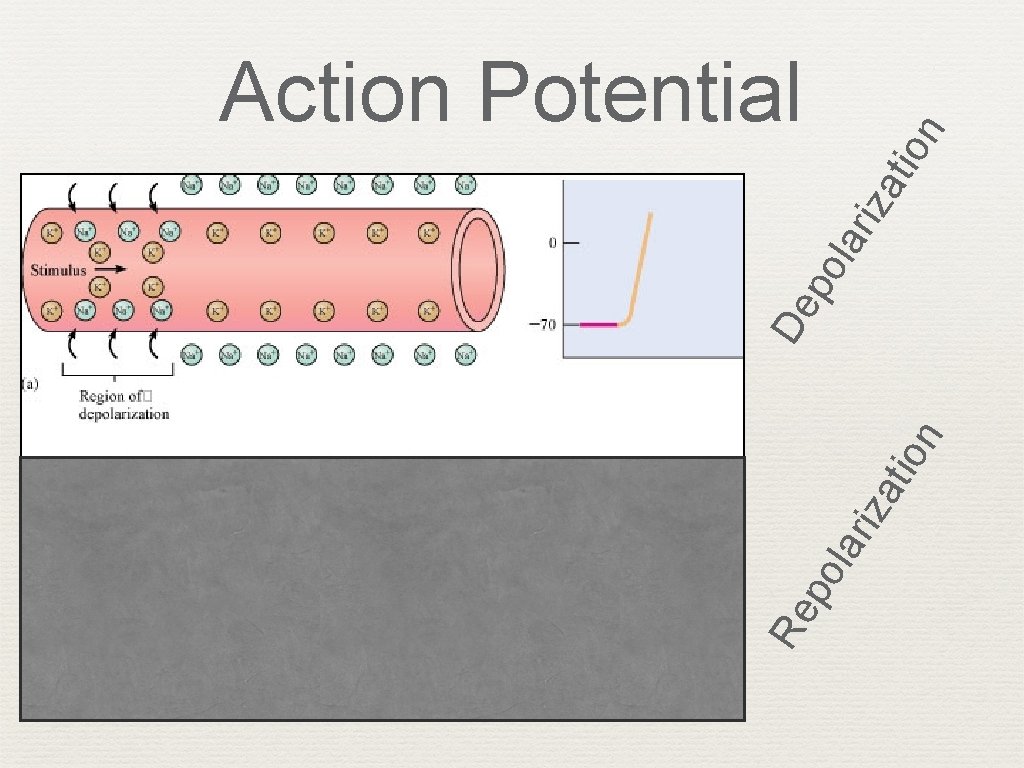
n tio iza lar po Re n tio lar iza po De Action Potential
Action Potential in Skeletal Muscle Fiber closed gates opene d gates
Action Potential Skeletal Cardiac
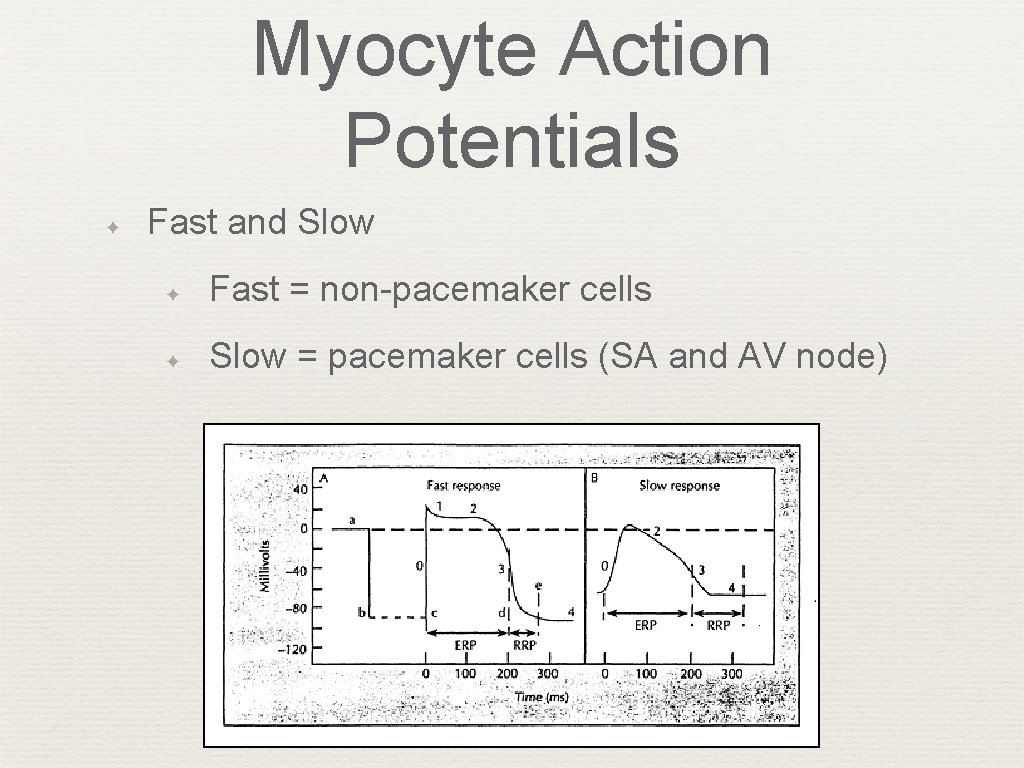
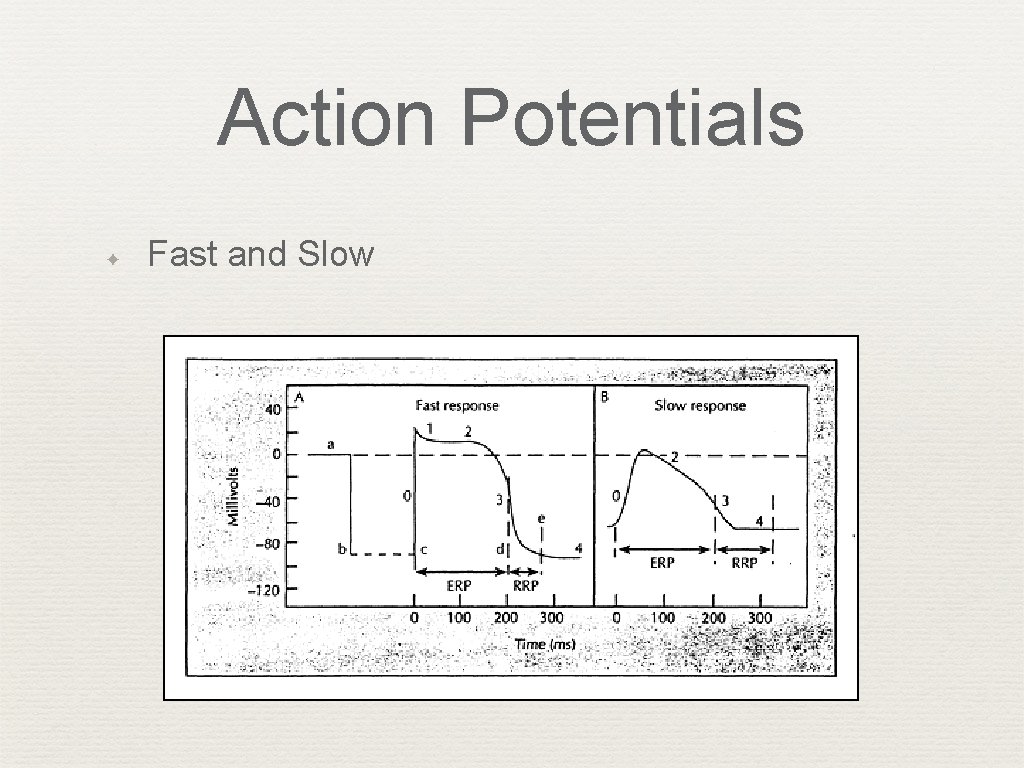
Myocyte Action Potentials ✦ Fast and Slow ✦ Fast = non-pacemaker cells ✦ Slow = pacemaker cells (SA and AV node)
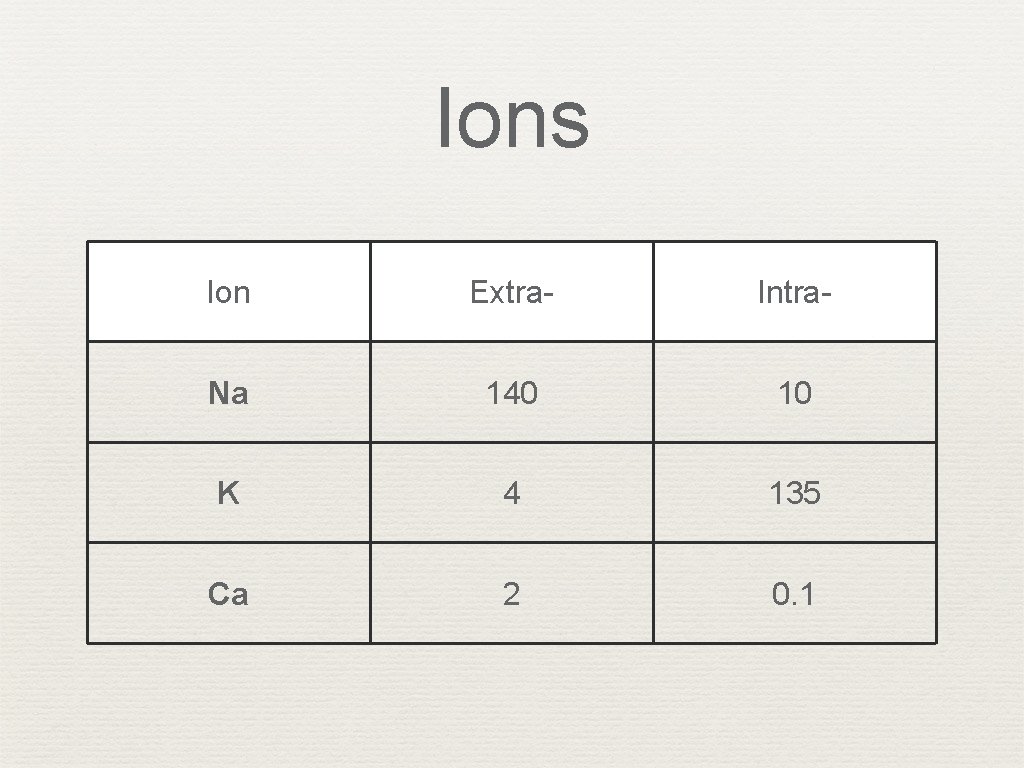
Ions Ion Extra- Intra- Na 140 10 K 4 135 Ca 2 0. 1
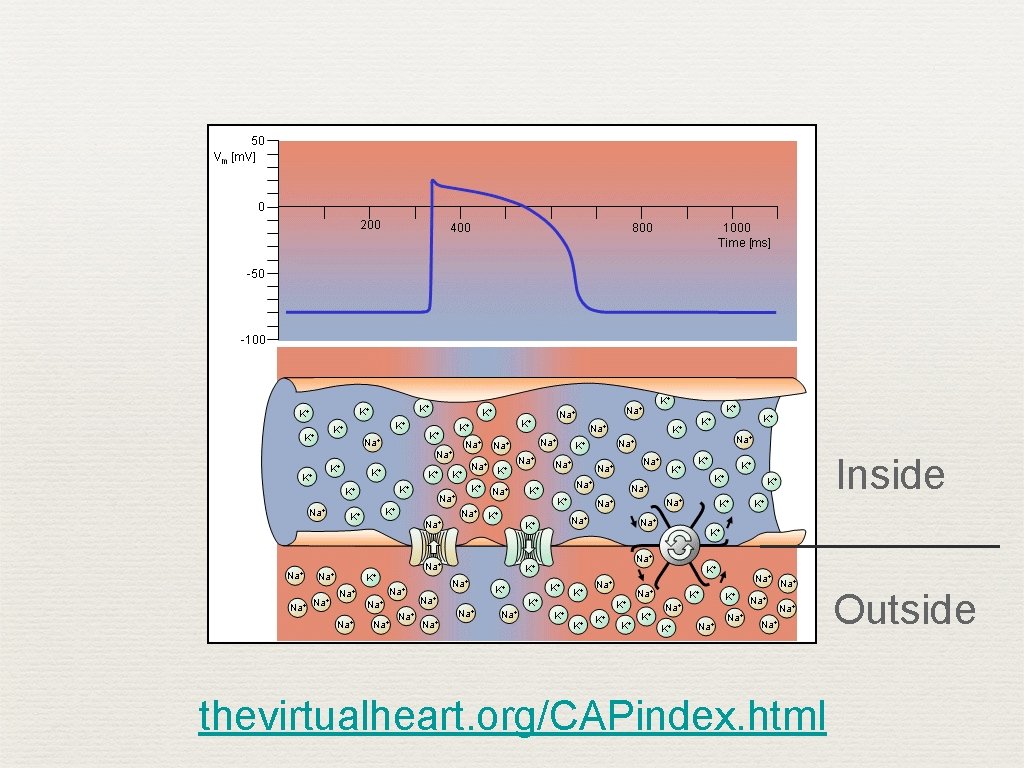
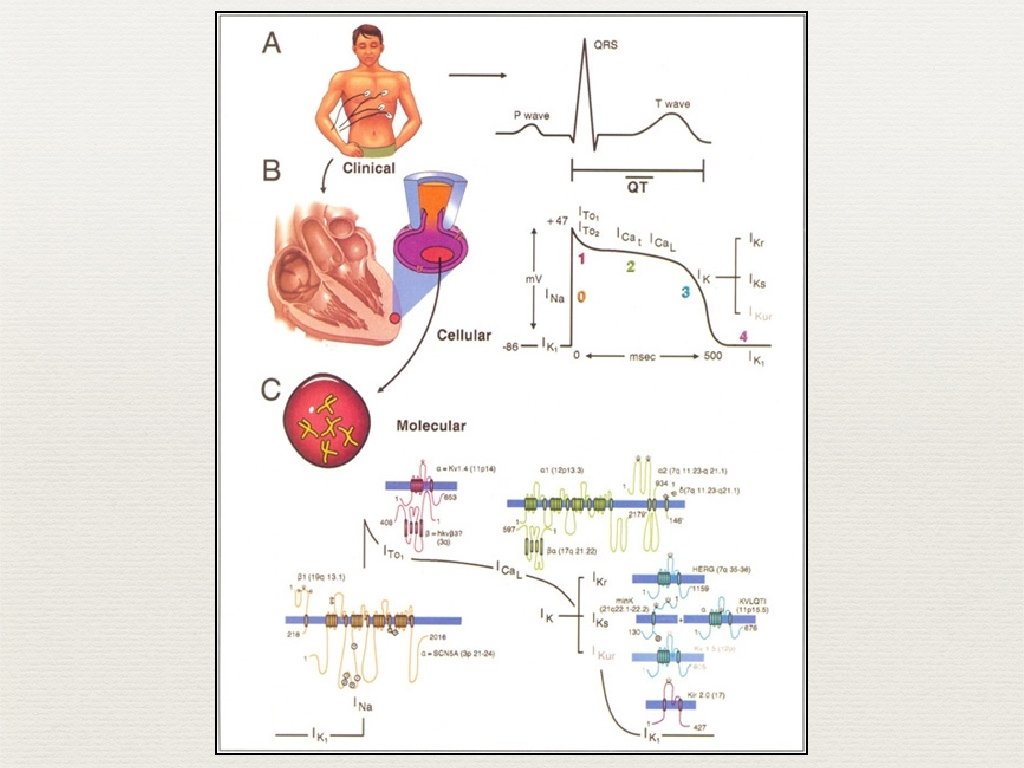
Action Potential ✦ Ion influx ✦ Na channels (fast and slow) ✦ K channels ✦ Ca channels
Inside Outside thevirtualheart. org/CAPindex. html
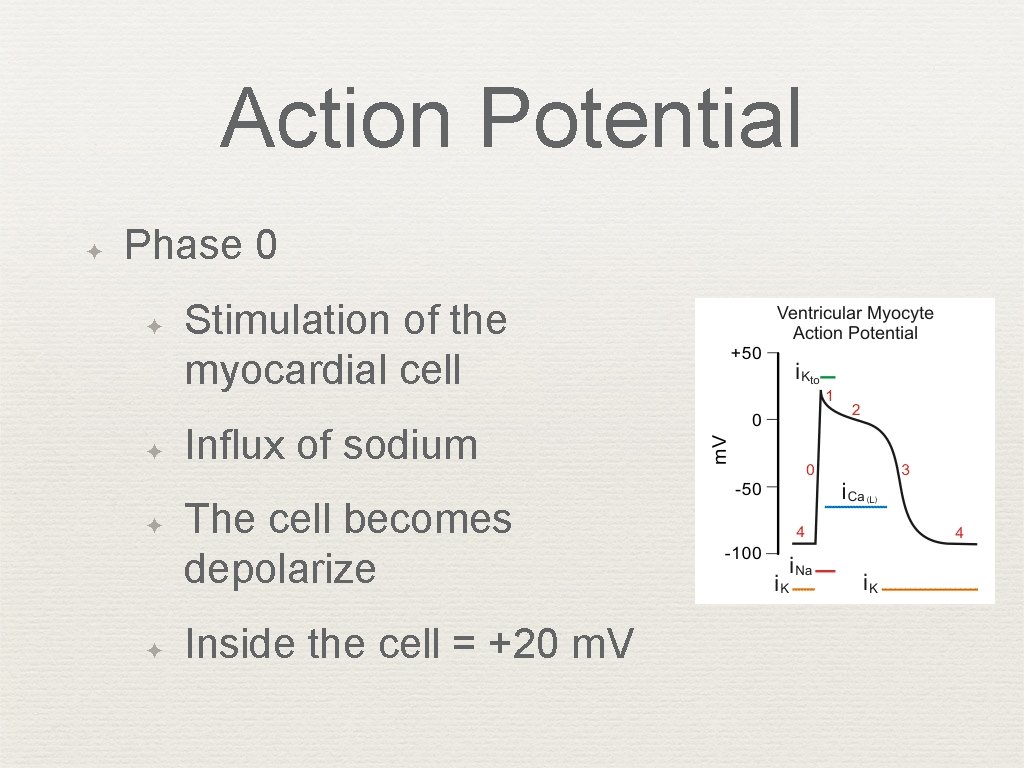
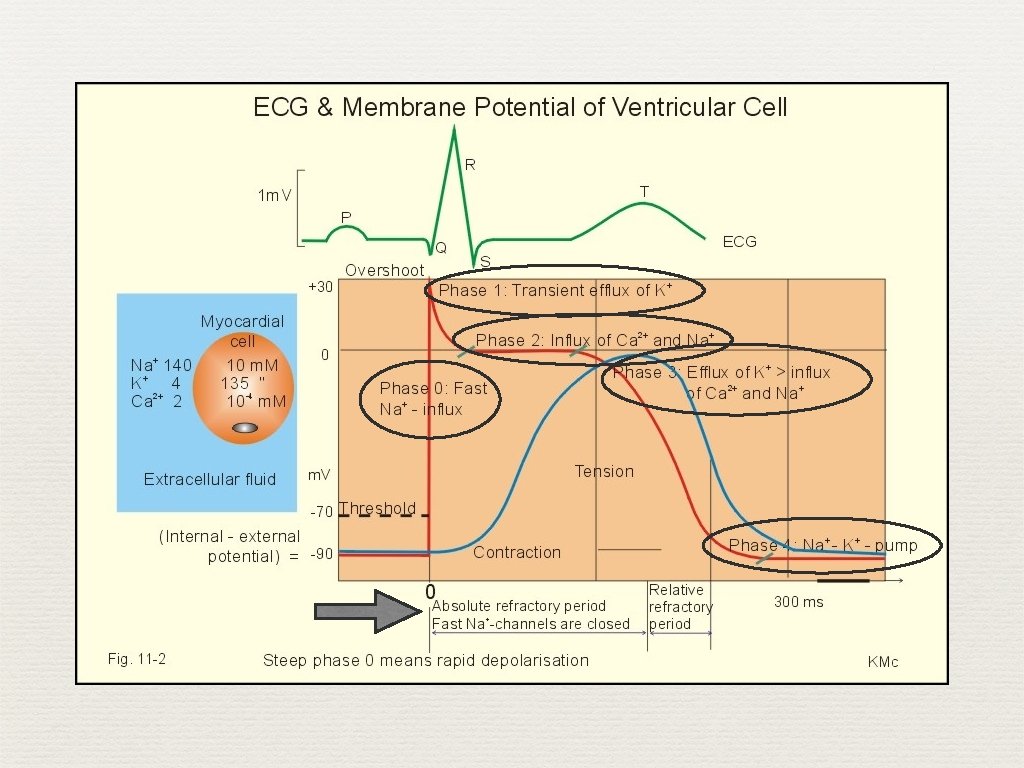
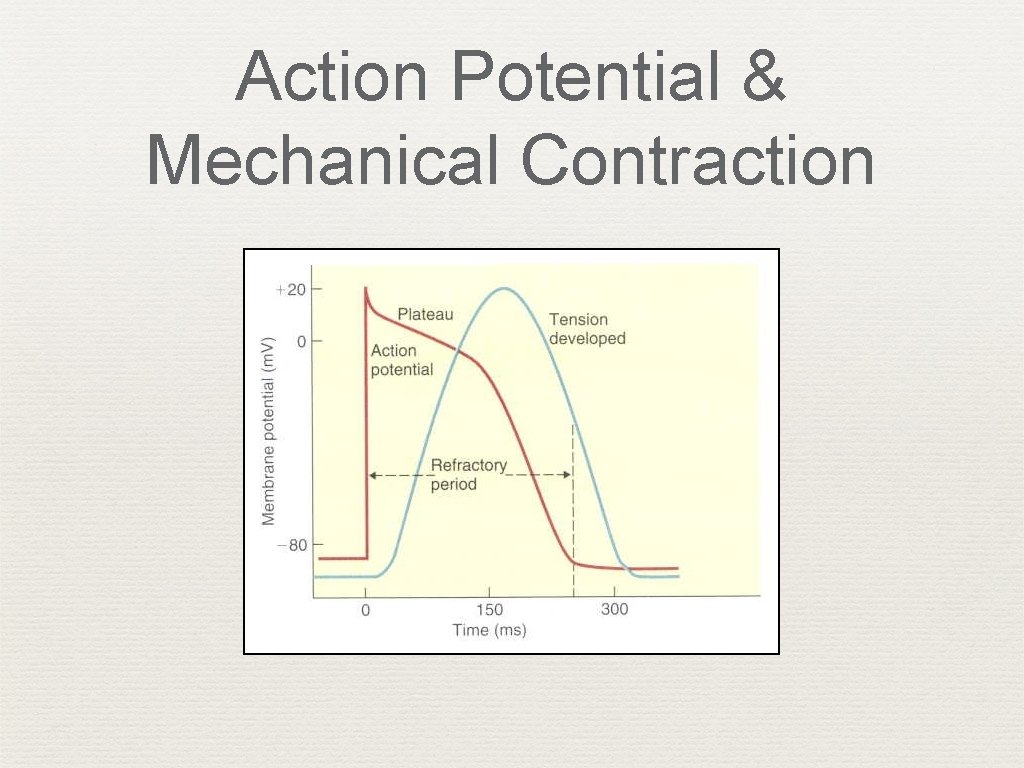
Action Potential ✦ Phase 0 ✦ ✦ Stimulation of the myocardial cell Influx of sodium The cell becomes depolarize Inside the cell = +20 m. V
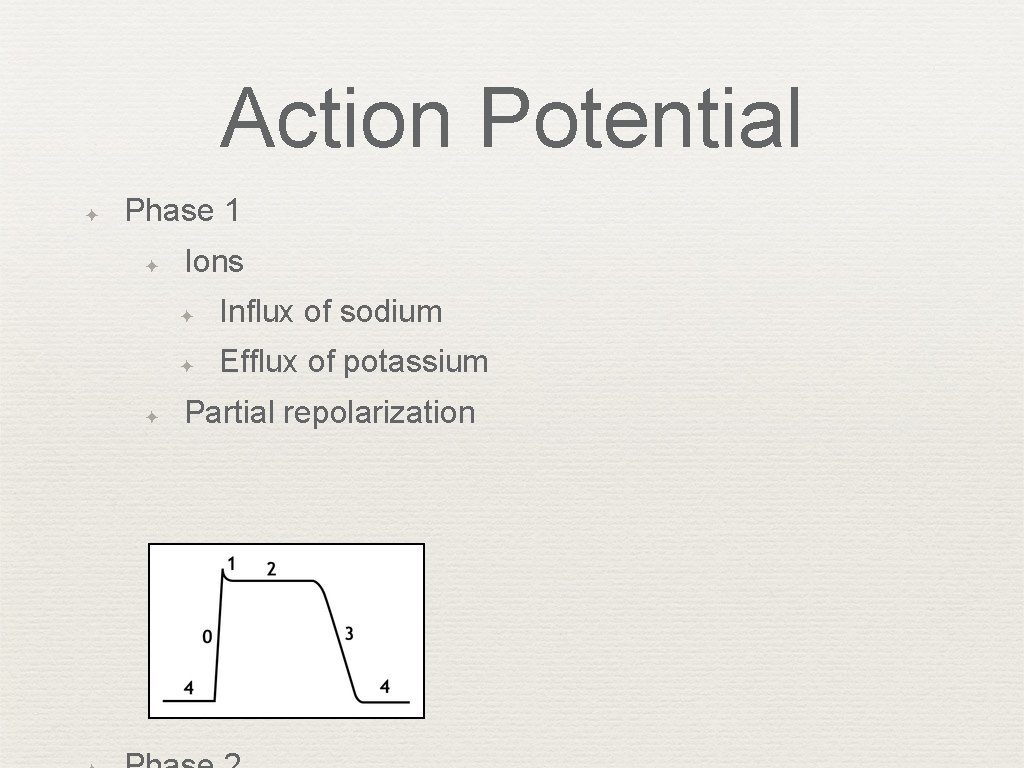
Action Potential ✦ Phase 1 ✦ ✦ Ions ✦ Influx of sodium ✦ Efflux of potassium Partial repolarization
Action Potential ✦ Phase 3 ✦ ✦ ✦ Ions ✦ Efflux of potassium* ✦ Influx of calcium Repolarization (slower process than depolarization) Phase 4 ✦ ✦ Interval between repolarization to the next action potential Pumps restore ionic concentrations
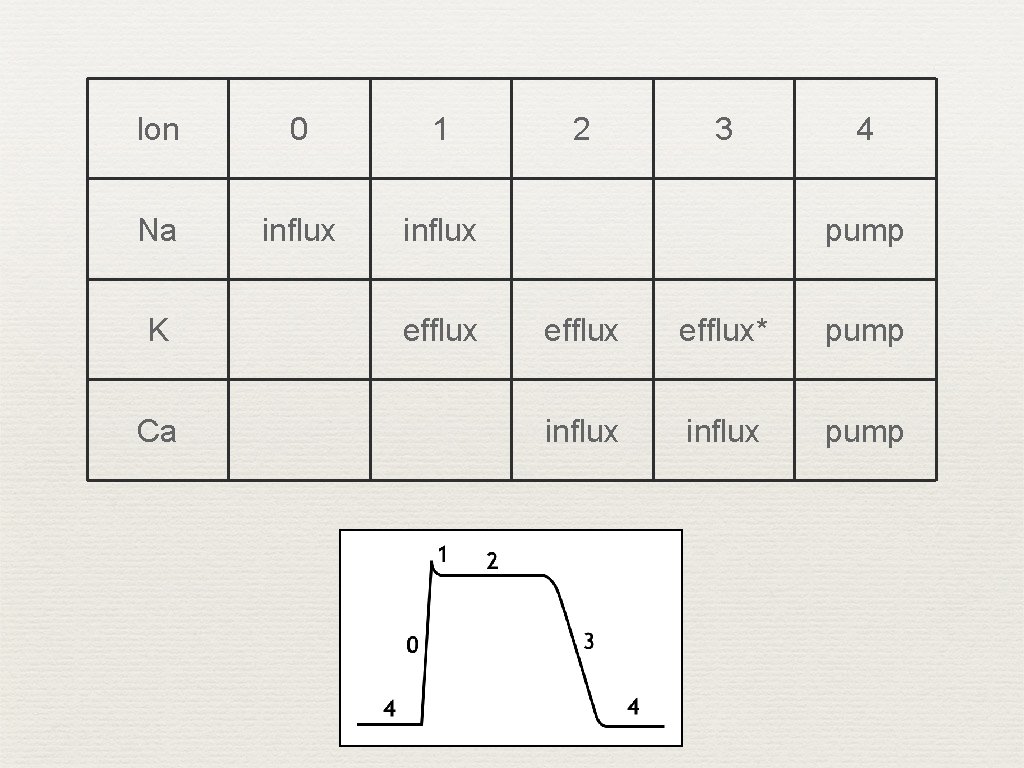
Ion 0 1 Na influx K Ca efflux 2 3 4 pump efflux* pump influx pump
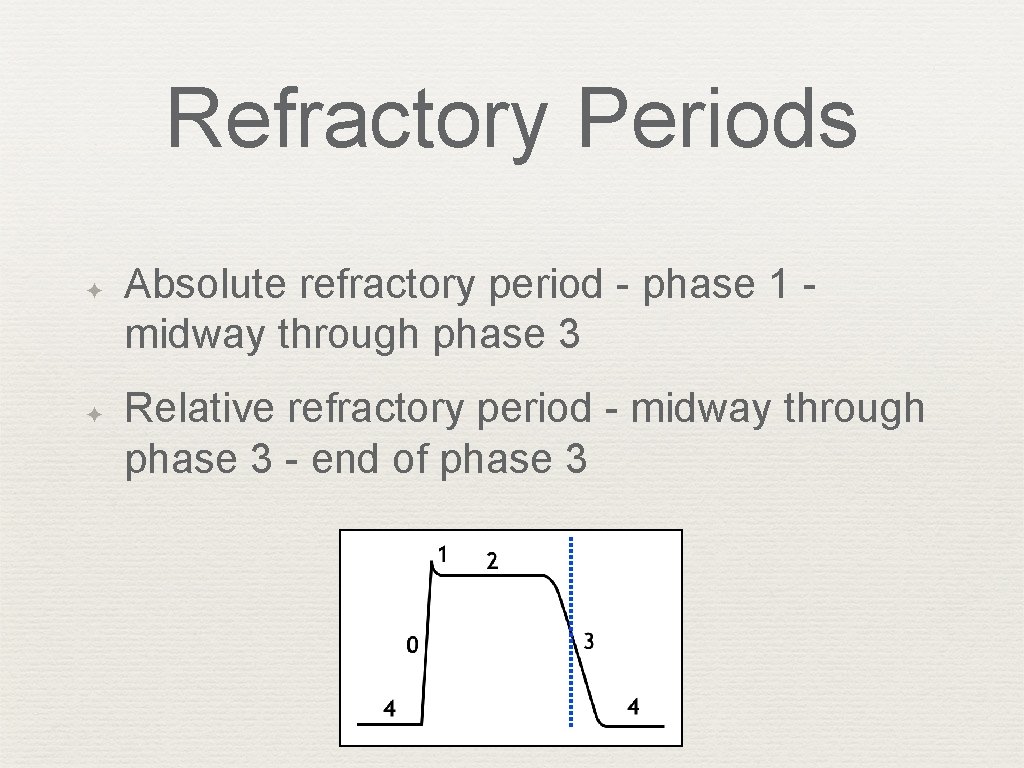
Refractory Periods ✦ ✦ Absolute refractory period - phase 1 - midway through phase 3 Relative refractory period - midway through phase 3 - end of phase 3
SA Node Action Potential ✦ “Funny” currents (phase 4); slow Na channels that initiate spontaneous depolarization ✦ No fast sodium channels ✦ Calcium channels (slow) ✦ ✦ Long-lasting, L-type ✦ Transient, T-type Potassium channels
Action Potentials ✦ Fast and Slow
Action Potentials It is important to note that non-pacemaker action potentials can change into pacemaker cells under certain conditions. For example, if a cell becomes hypoxic, the membrane depolarizes, which closes fast Na+ channels. At a membrane potential of about – 50 m. V, all the fast Na+ channels are inactivated. When this occurs, action potentials can still be elicited; however, the inward current are carried by Ca++ (slow inward channels) exclusively. These action potentials resemble those found in pacemaker cells located in the SA node, and can sometimes display spontaneous depolarization and automaticity. This mechanism may serve as the electrophysiological mechanism behind certain types of ectopic beats and arrhythmias, particularly in ischemic heart disease and following myocardial infarction.
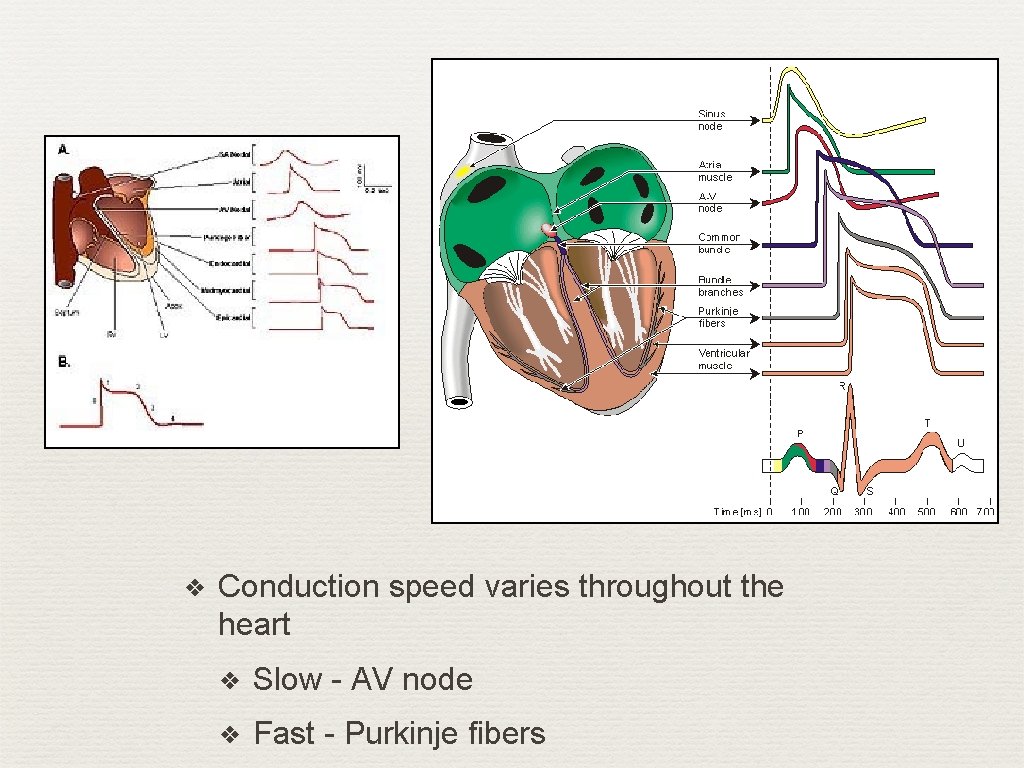
❖ Conduction speed varies throughout the heart ❖ Slow - AV node ❖ Fast - Purkinje fibers
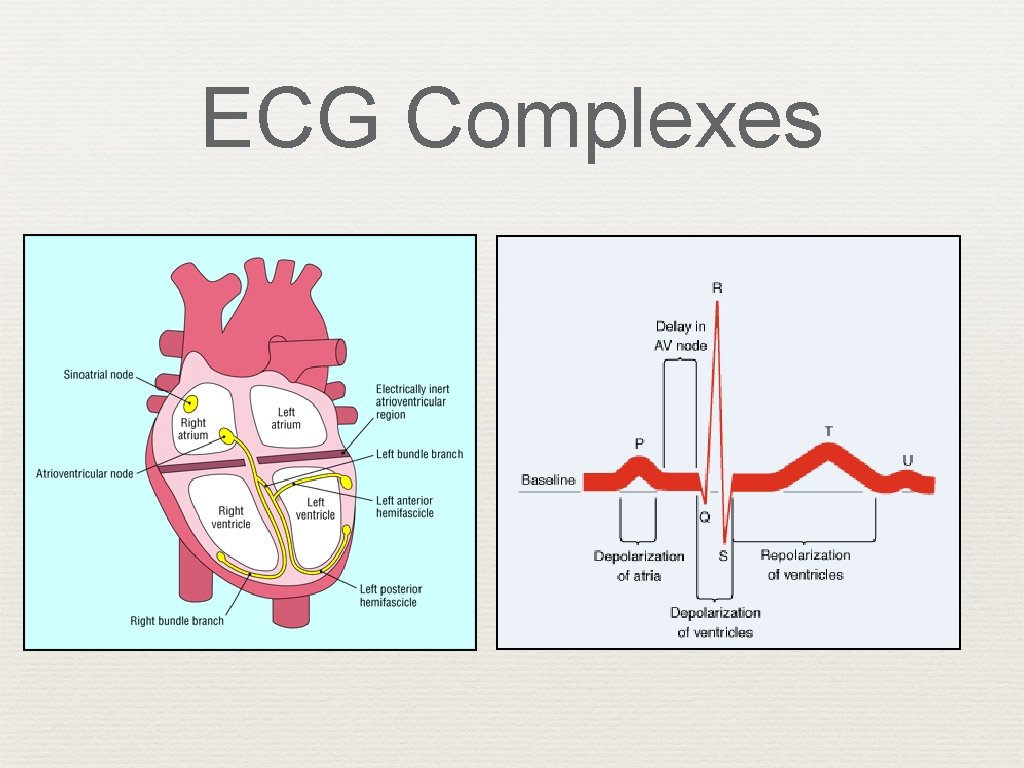
Action Potential ✦ ECG records depolarization and repolarization ✦ Atrial depolarization ✦ Ventricular depolarization ✦ ✦ Atrial repolarization Ventricular repolarization
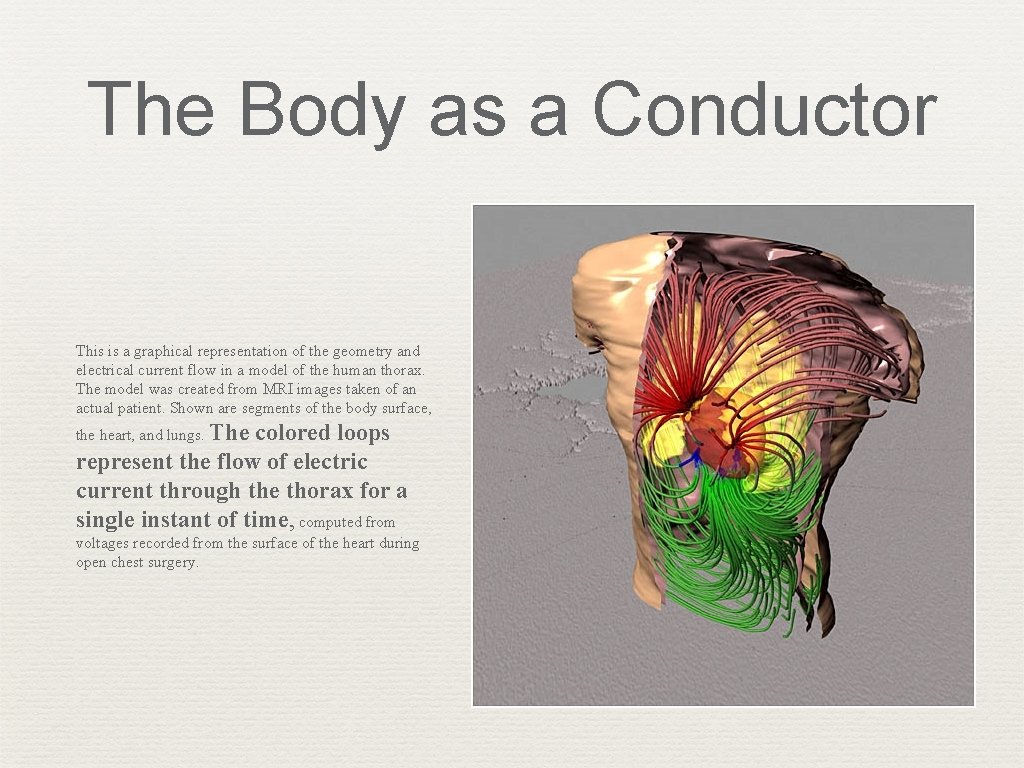
The Body as a Conductor This is a graphical representation of the geometry and electrical current flow in a model of the human thorax. The model was created from MRI images taken of an actual patient. Shown are segments of the body surface, the heart, and lungs. The colored loops represent the flow of electric current through the thorax for a single instant of time, computed from voltages recorded from the surface of the heart during open chest surgery.
Assignment ✦ Read “Non-pacemaker Action Potentials” ✦ Read “SA node action potentials”
Basic ECG Waves Chapter 2
ECG Complexes
ECG Complexes
Action Potential & Mechanical Contraction
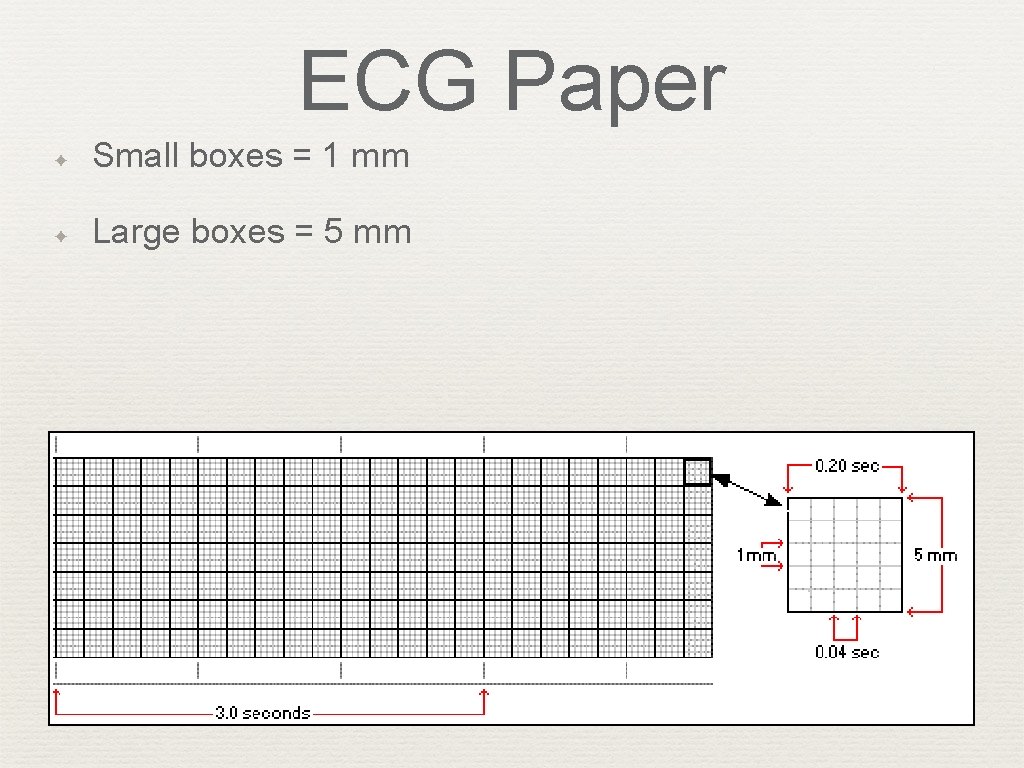
ECG Paper ✦ Small boxes = 1 mm ✦ Large boxes = 5 mm ✦ Small boxes = 0. 04 seconds ✦ Large boxes = 0. 20 seconds ✦ 5 large boxes = 1. 0 second ✦ Paper speed = 25 mm / sec
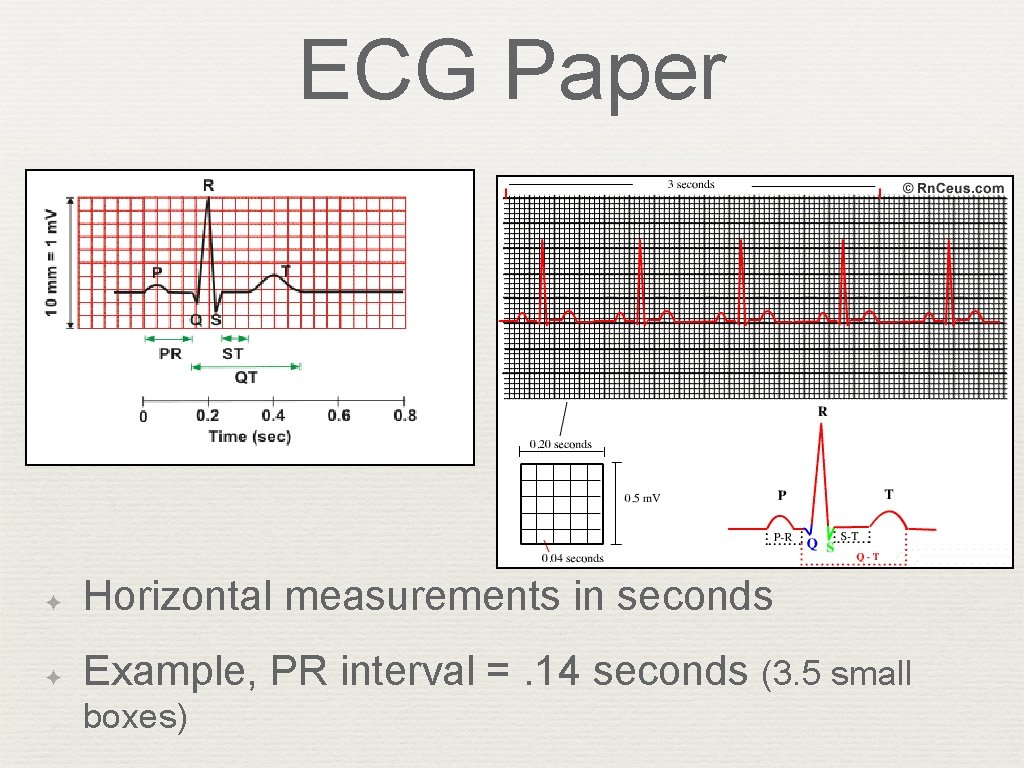
ECG Paper ✦ Horizontal measurements in seconds ✦ Example, PR interval =. 14 seconds (3. 5 small boxes)
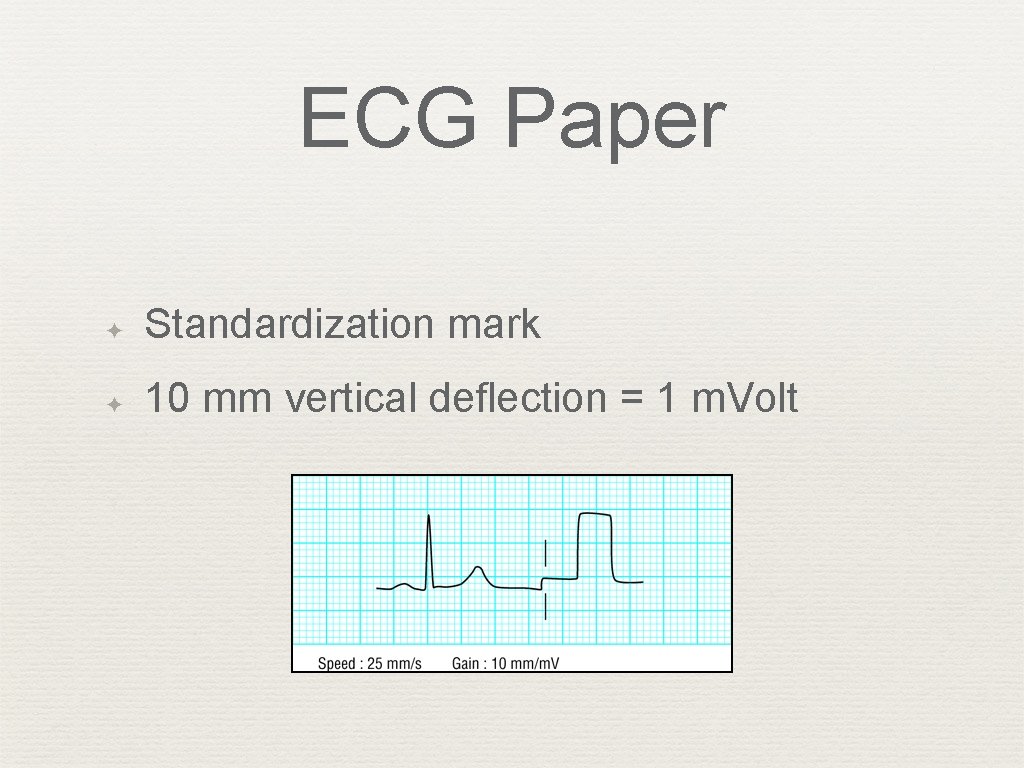
ECG Paper ✦ Standardization mark ✦ 10 mm vertical deflection = 1 m. Volt
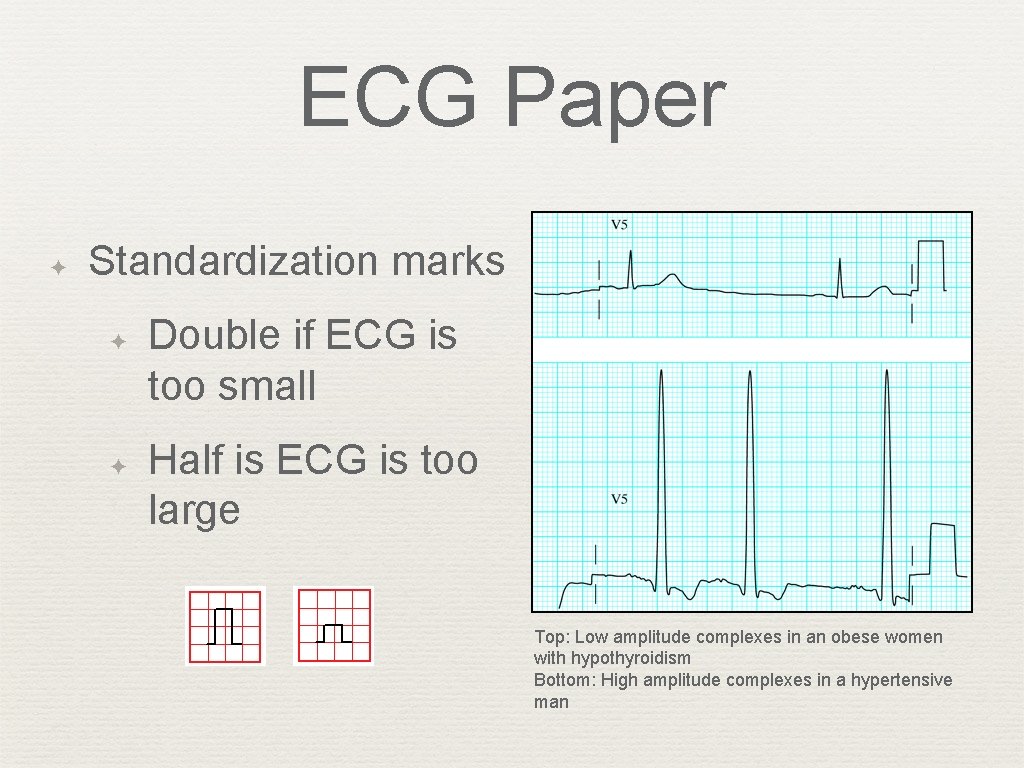
ECG Paper ✦ Standardization marks ✦ ✦ Double if ECG is too small Half is ECG is too large Top: Low amplitude complexes in an obese women with hypothyroidism Bottom: High amplitude complexes in a hypertensive man
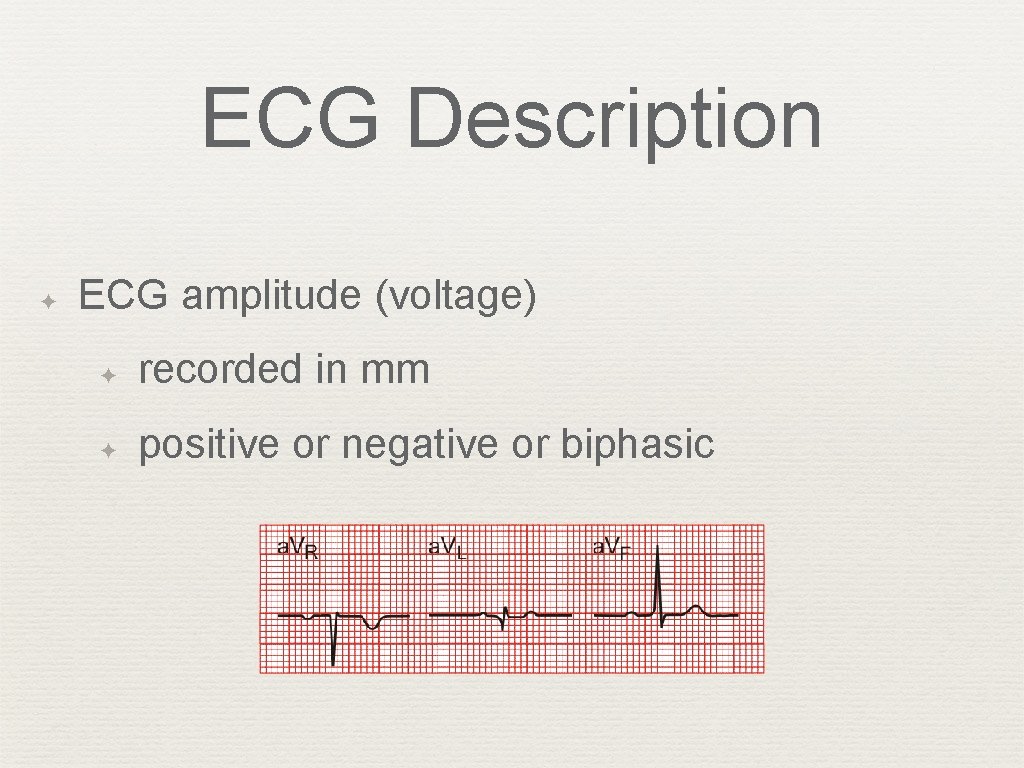
ECG Description ✦ ECG amplitude (voltage) ✦ recorded in mm ✦ positive or negative or biphasic
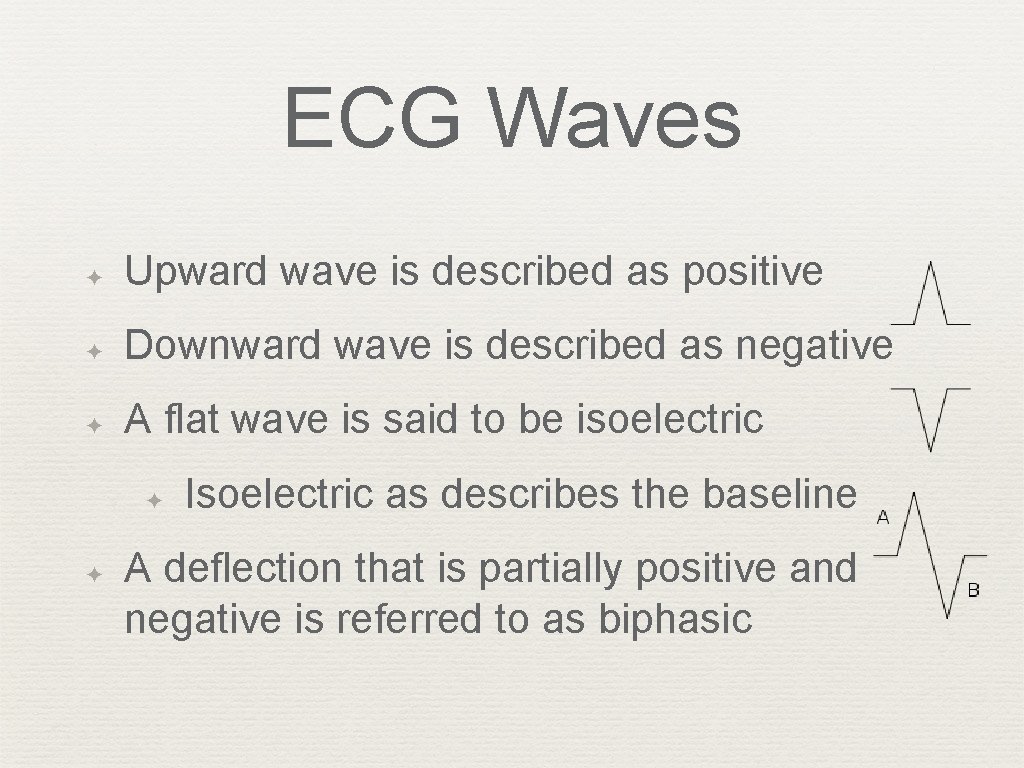
ECG Waves ✦ Upward wave is described as positive ✦ Downward wave is described as negative ✦ A flat wave is said to be isoelectric ✦ ✦ Isoelectric as describes the baseline A deflection that is partially positive and negative is referred to as biphasic
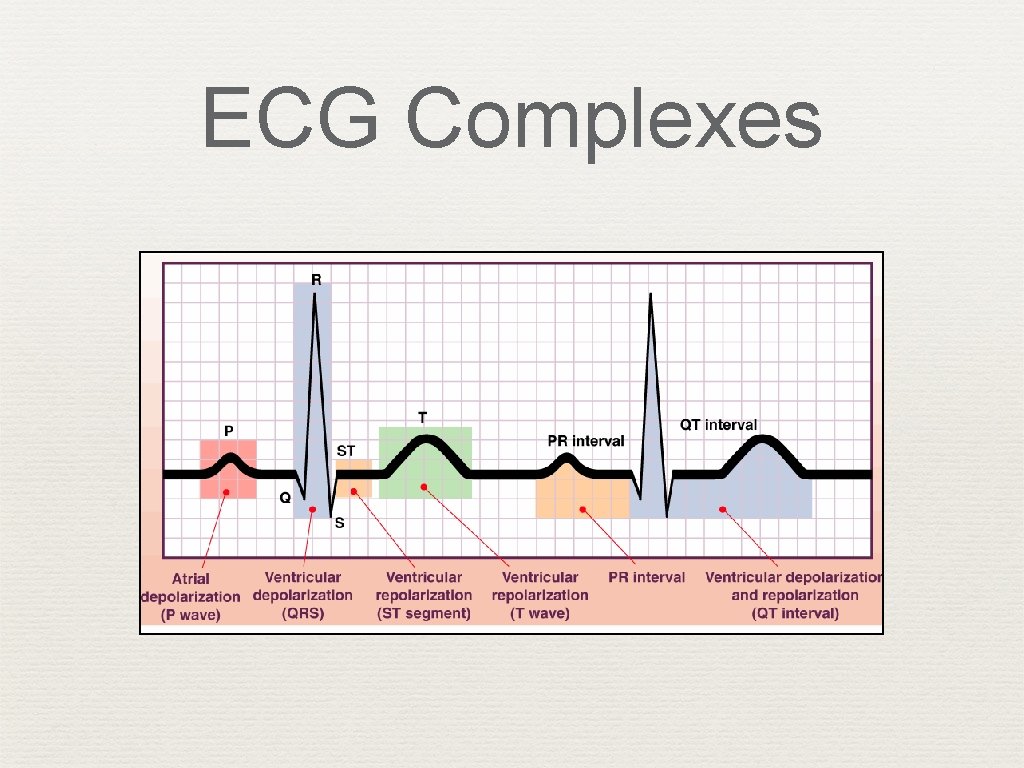
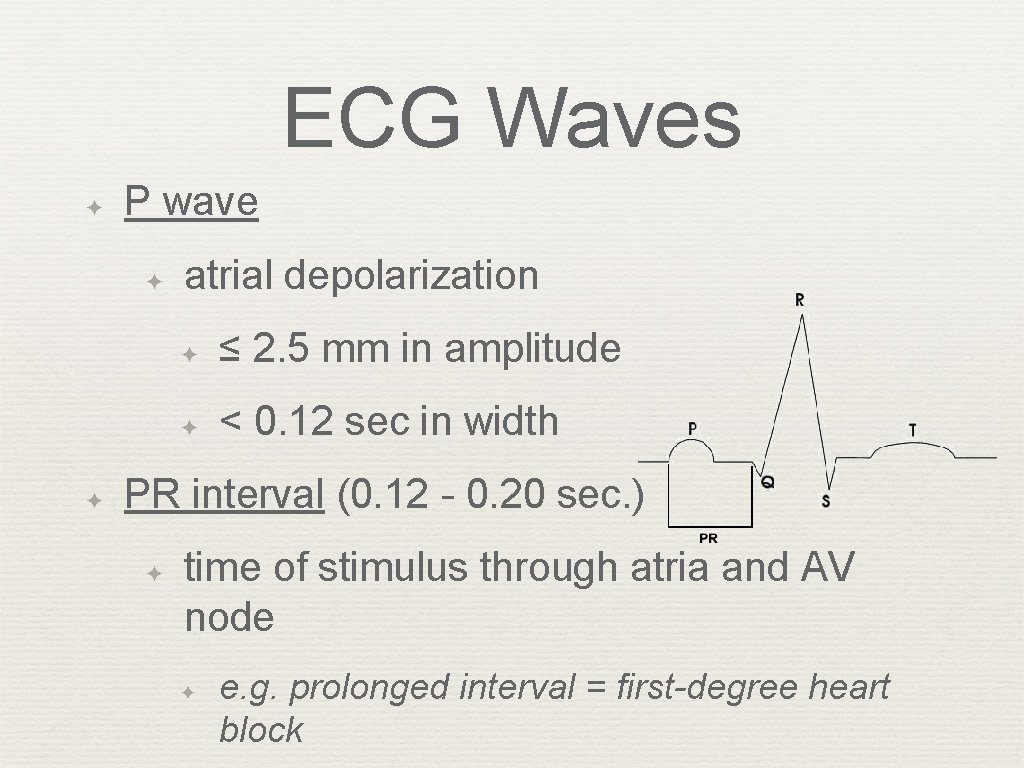
ECG Waves ✦ P wave ✦ ✦ atrial depolarization ✦ ≤ 2. 5 mm in amplitude ✦ < 0. 12 sec in width PR interval (0. 12 - 0. 20 sec. ) ✦ time of stimulus through atria and AV node ✦ e. g. prolonged interval = first-degree heart block
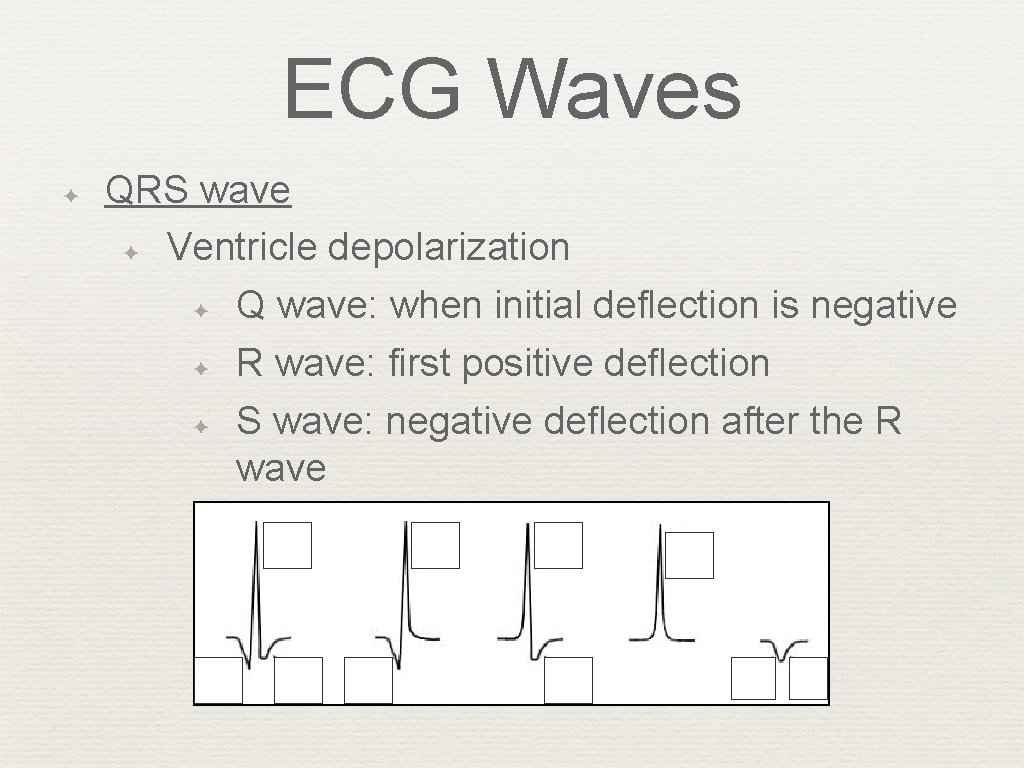
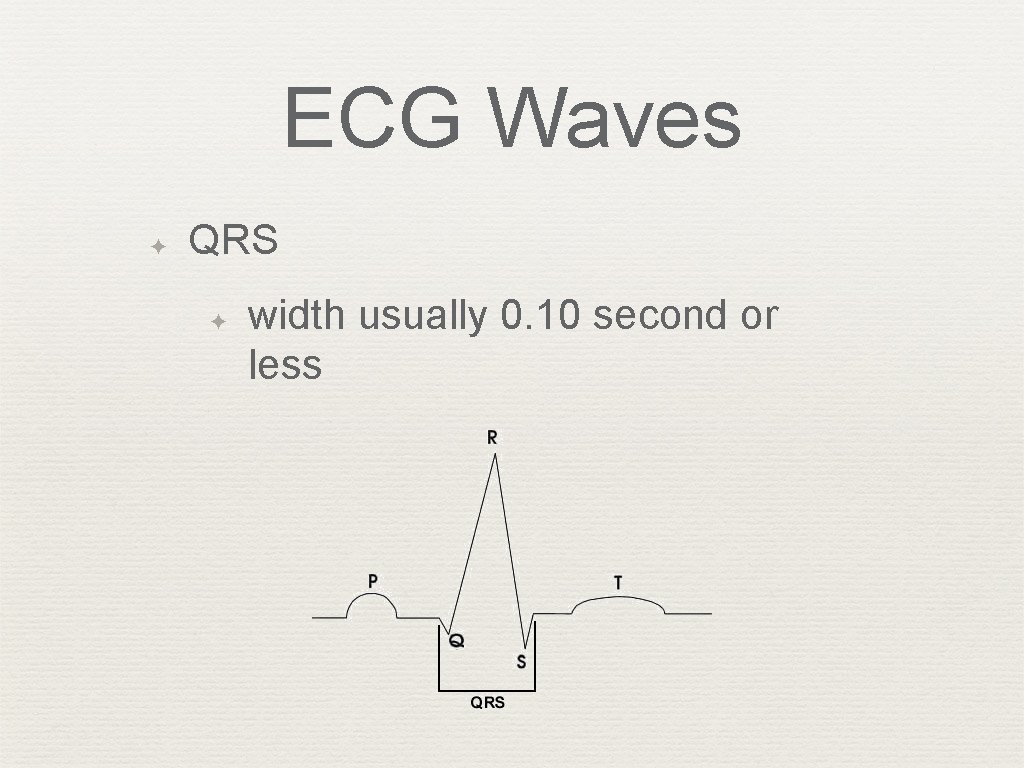
ECG Waves ✦ QRS wave ✦ Ventricle depolarization ✦ Q wave: when initial deflection is negative ✦ R wave: first positive deflection ✦ S wave: negative deflection after the R wave
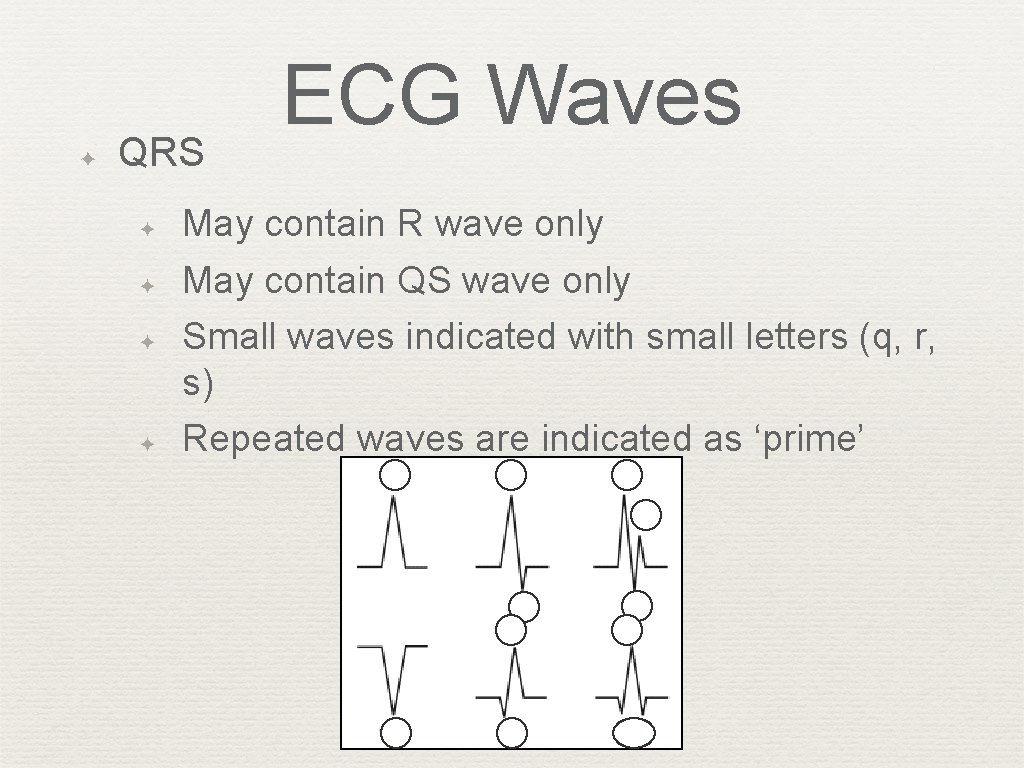
✦ QRS ✦ ✦ ECG Waves May contain R wave only May contain QS wave only Small waves indicated with small letters (q, r, s) Repeated waves are indicated as ‘prime’
ECG Waves ✦ QRS ✦ width usually 0. 10 second or less
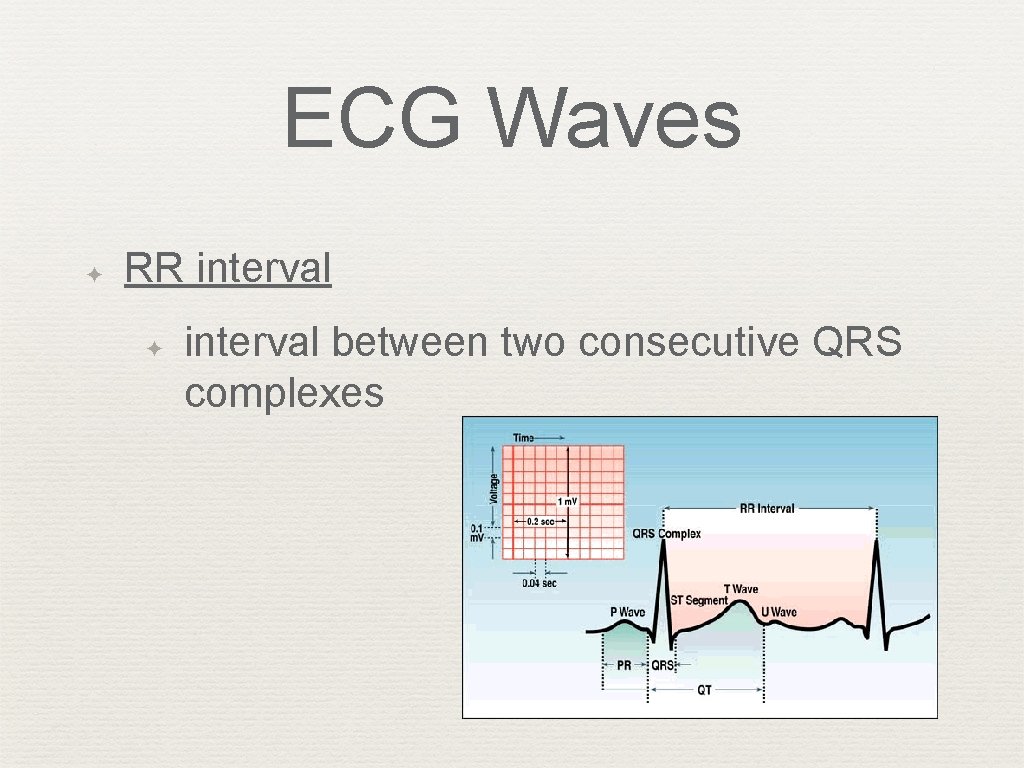
ECG Waves ✦ RR interval ✦ interval between two consecutive QRS complexes
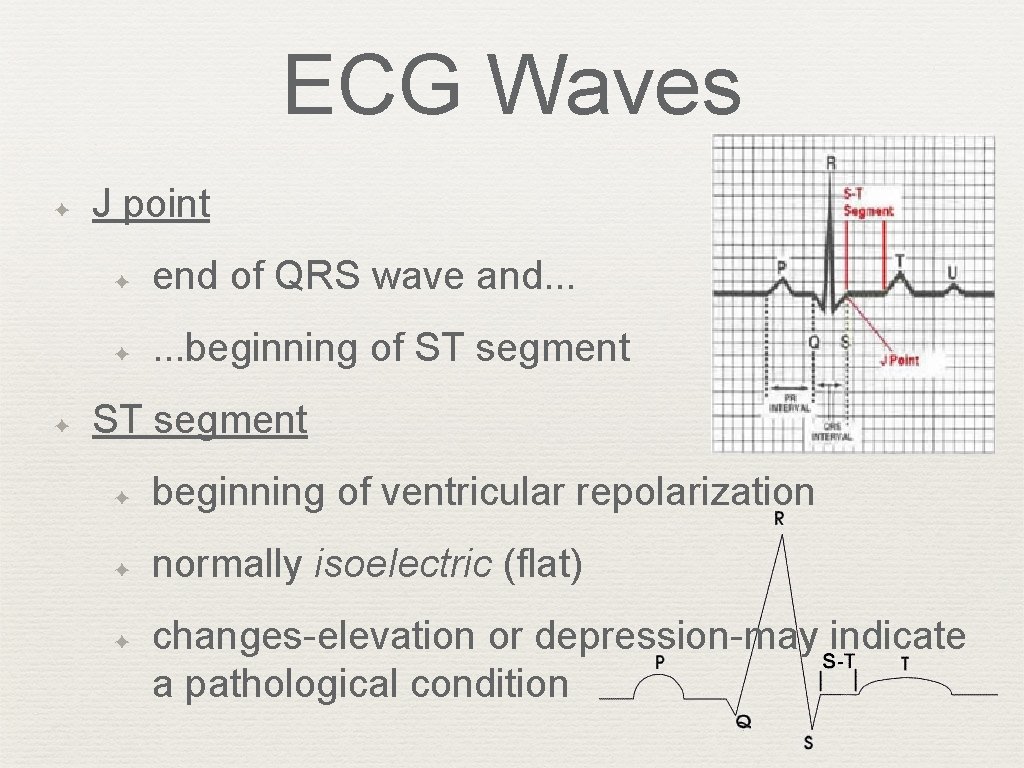
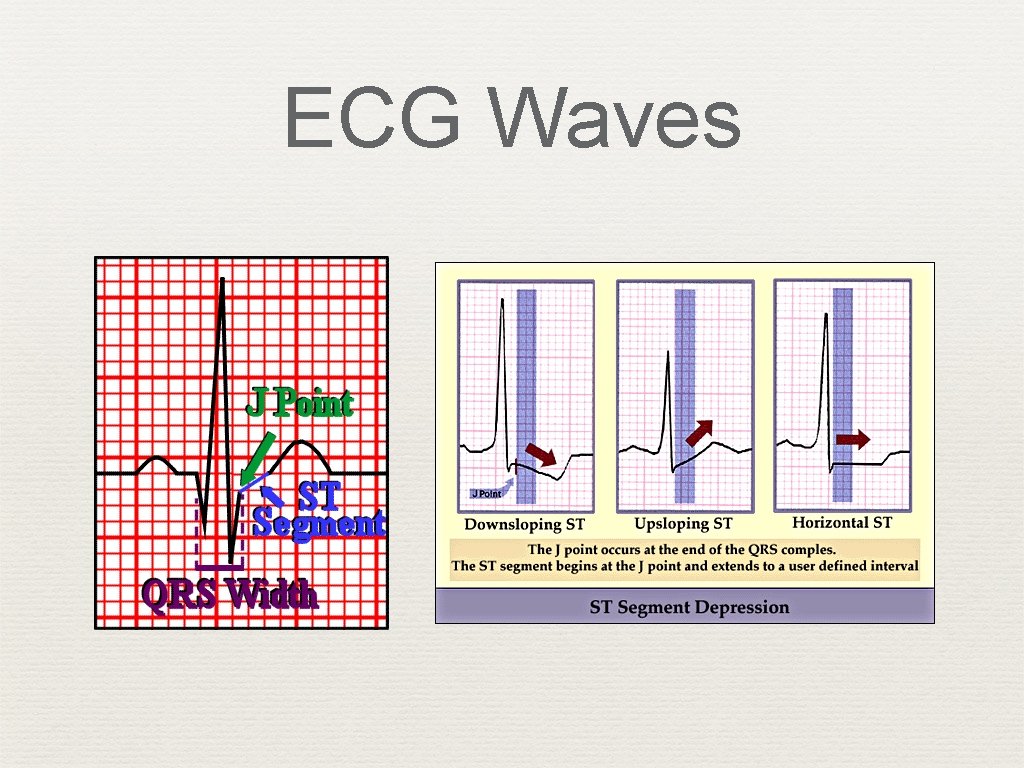
ECG Waves ✦ ✦ J point ✦ end of QRS wave and. . . ✦ . . . beginning of ST segment ✦ beginning of ventricular repolarization ✦ normally isoelectric (flat) ✦ changes-elevation or depression-may indicate a pathological condition
ECG Waves
ECG Waves ✦ T wave ✦ part of ventricular repolarization ✦ asymmetrical shape ✦ usually not measured
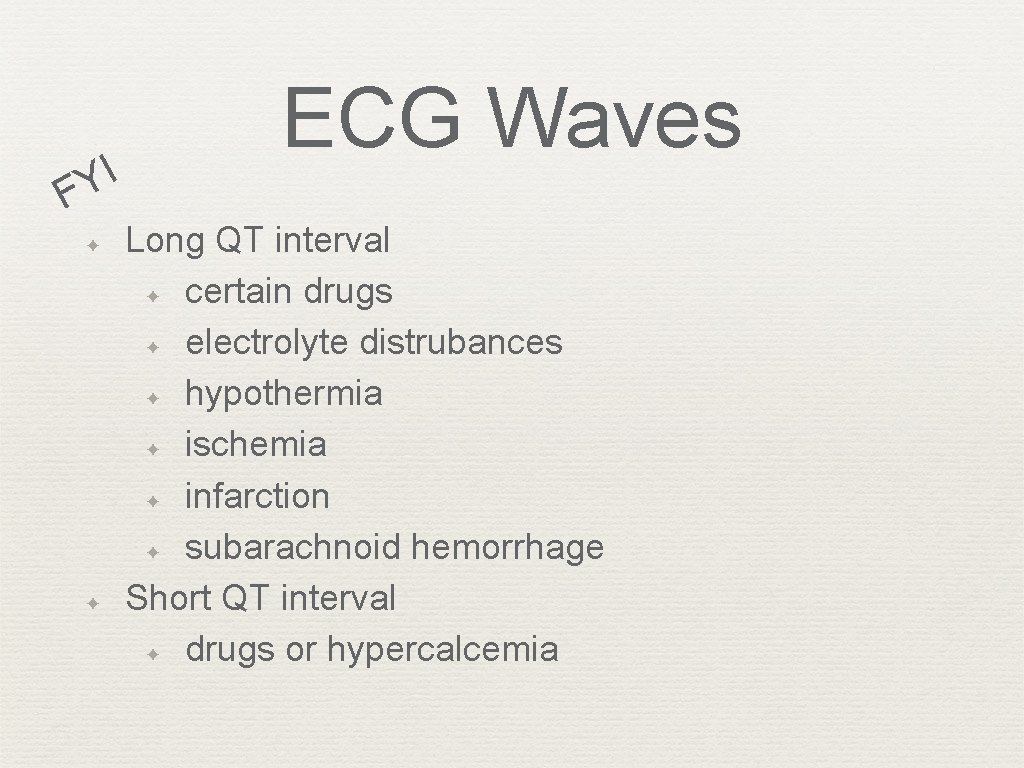
ECG Waves ✦ QT interval ✦ from beginning of QRS to the end of the T wave ✦ ventricular depolarization & repolarization ✦ length varies with heart rate (table 2. 1) ✦ ✦ long QT intervals occur with ischemia, infarction, and hemorrhage short QT intervals occur with certain medications and hypercalcemia
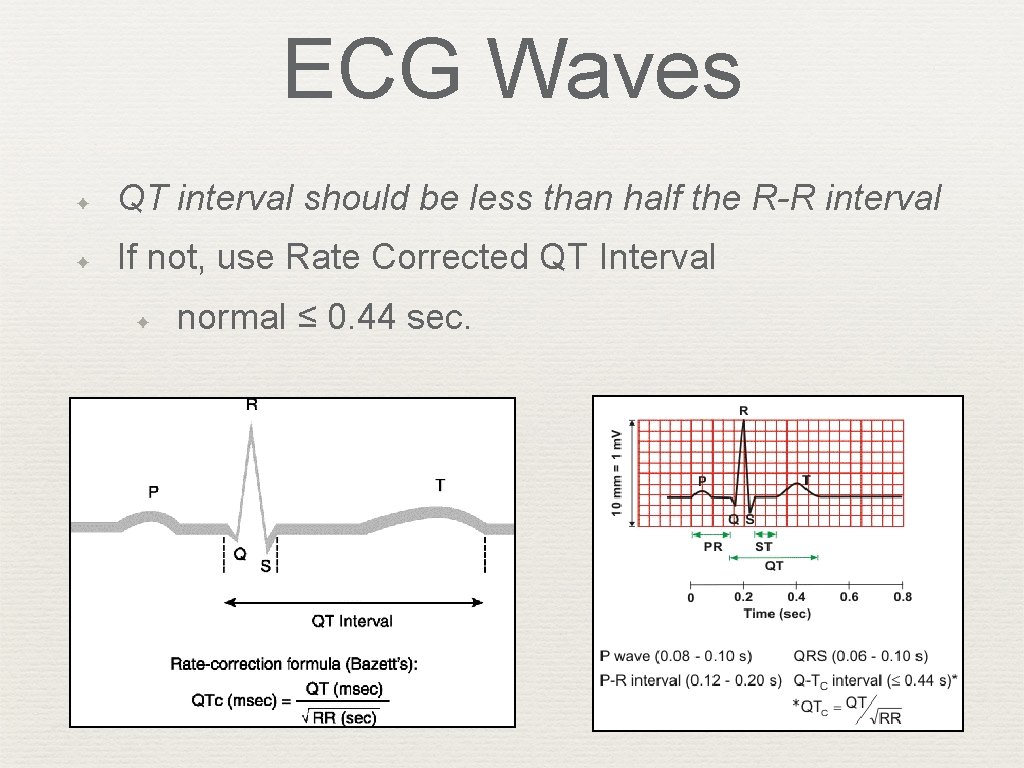
ECG Waves ✦ QT interval should be less than half the R-R interval ✦ If not, use Rate Corrected QT Interval ✦ normal ≤ 0. 44 sec.
I Y F ✦ ✦ ECG Waves Long QT interval ✦ certain drugs ✦ electrolyte distrubances ✦ hypothermia ✦ ischemia ✦ infarction ✦ subarachnoid hemorrhage Short QT interval ✦ drugs or hypercalcemia
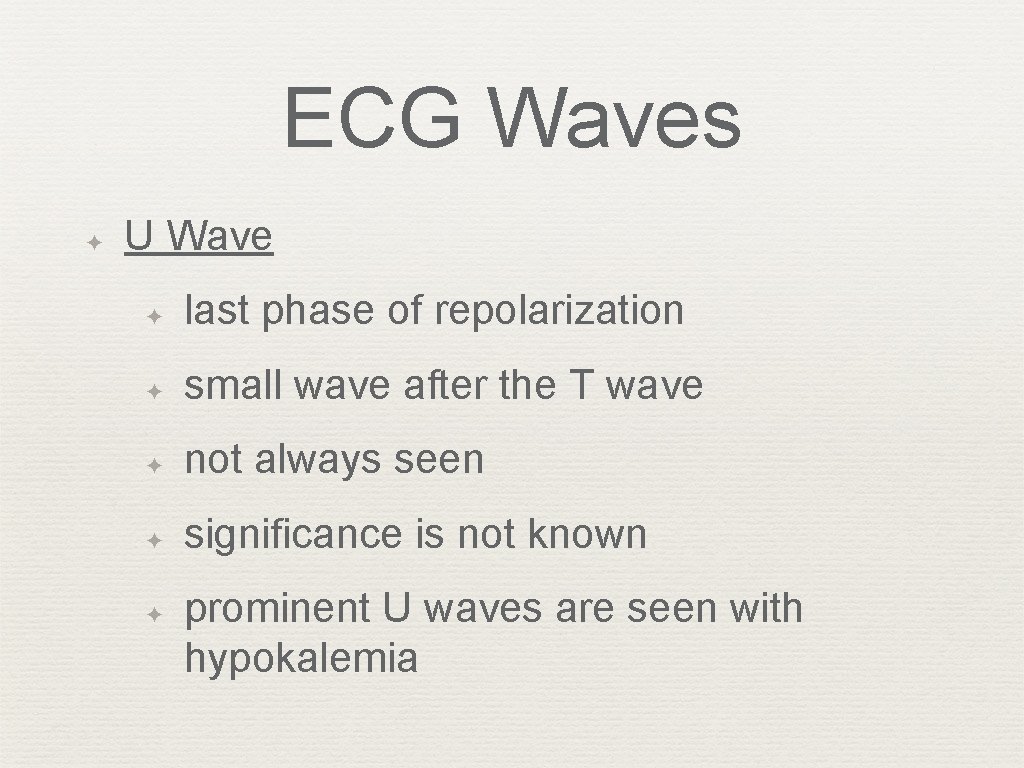
ECG Waves ✦ U Wave ✦ last phase of repolarization ✦ small wave after the T wave ✦ not always seen ✦ significance is not known ✦ prominent U waves are seen with hypokalemia
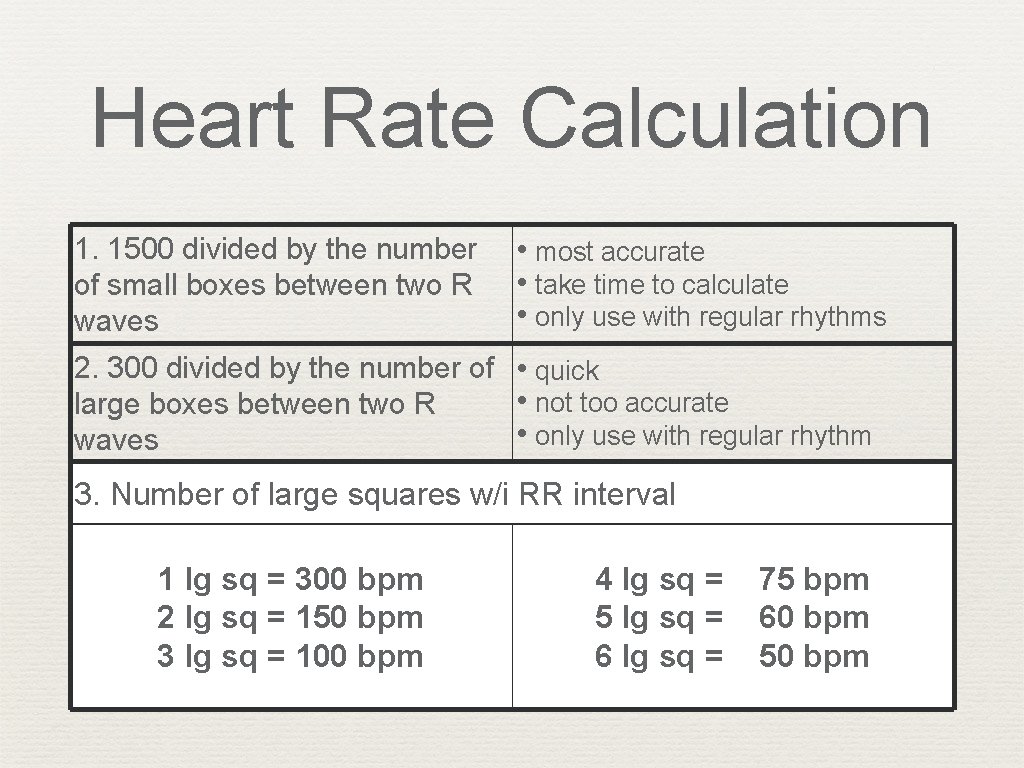
Heart Rate Calculation 1. 1500 divided by the number of small boxes between two R waves • most accurate • take time to calculate • only use with regular rhythms 2. 300 divided by the number of • quick • not too accurate large boxes between two R • only use with regular rhythm waves 3. Number of large squares w/i RR interval 1 lg sq = 300 bpm 2 lg sq = 150 bpm 3 lg sq = 100 bpm 4 lg sq = 5 lg sq = 6 lg sq = 75 bpm 60 bpm 50 bpm
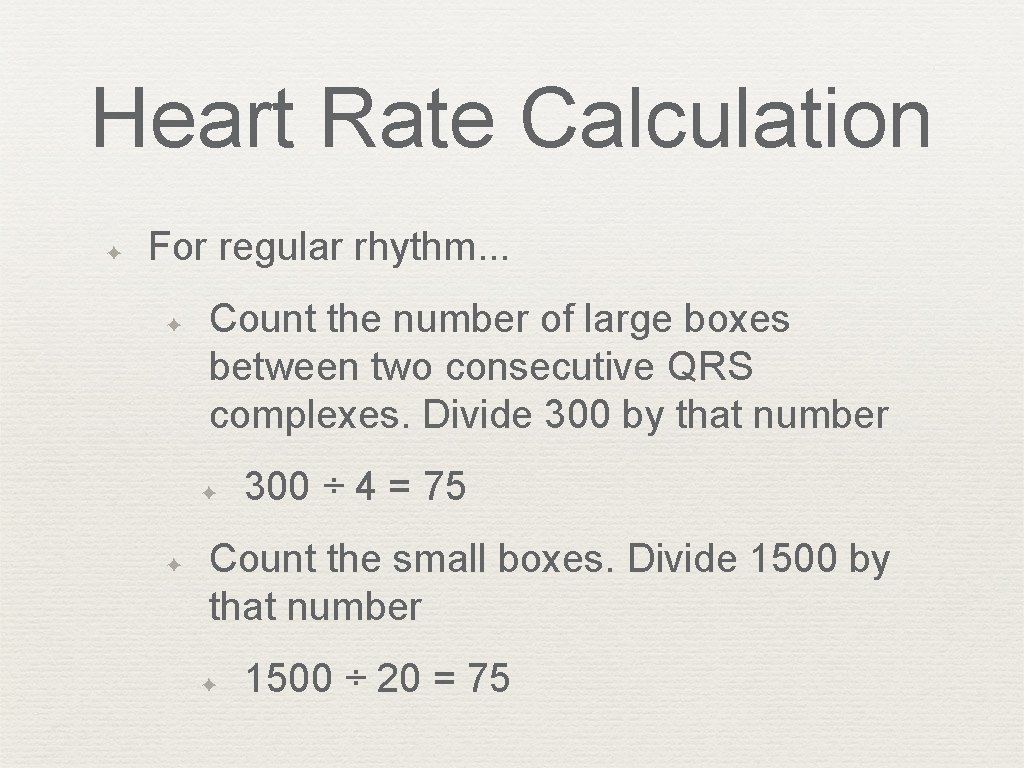
Heart Rate Calculation ✦ For regular rhythm. . . ✦ Count the number of large boxes between two consecutive QRS complexes. Divide 300 by that number ✦ ✦ 300 ÷ 4 = 75 Count the small boxes. Divide 1500 by that number ✦ 1500 ÷ 20 = 75
Heart Rate Calculation ✦ ✦ For irregular rhythms… Count the number of cardiac cycles in 6 seconds and multiple this by 10. (Figure 2. 15)
The ECG as a Combination of Atrial and Ventricular Parts ✦ Atrial ECG = P wave ✦ Ventricular ECG = QRS-T waves ✦ Normally, sinus node paces the heart and P wave precedes QRS ✦ ✦ P-QRS-T Sometimes, atria and ventricles paced separately (e. g. complete heart block)
ECG in Perspective 1. ECG recording of electrical activity not the mechanical function 2. ECG is not a direct depiction of abnormalities 3. ECG does not record all the heart’s electrical activity
Questions ✦ End of chapter 2, questions 1 -5 and 7.