Jotters Closed Weather Circles Quiz Depressions v Anticyclones


 –")


 1 okta of cloud cover")


- Slides: 60
Jotters Closed – Weather Circles Quiz!
Depressions v Anticyclones
What you need to know? • What a depression and anticyclone are? • Be able to read and understand a synoptic chart. • Explain what weather each one brings and the impacts that this may bring.
What is a depression? • A depression is an area of low pressure which moves from west to east in the northern hemisphere. • Low pressure = air is rising.
What is an anticyclone? • When air sinks we call this high pressure. • Areas of high pressure are called anticyclones. • Anticyclones bring different types of weather to the UK.
Air Pressure Basics • Low Pressure = Air Rising = RAIN = DEPRESSION (below 1000 mb) = ISOBARS ARE GOING UP THE WAY (900, 904, 908) • High Pressure = Air Sinking = DRY = ANTICYCLONE (above 1000 mb) = ISOBARS ARE GOING DOWN (1016, 1012, 1008)
Depression v anticyclone Features Depression Anticyclone Air Rising Falling Isobars Close together = numbers Far apart = numbers are rising decreasing (1000, 1002, 1004 etc. ) (1000, 998, 996). Winds Windy – anticlockwise. Lack of wind – clockwise. Clouds Cloudy Clear Temperature Cold in cold sector. Warm in warm sector. Warm. Precipitation Yes – especially at fronts. No Fronts? Yes No
Depression v anticyclone Features Depression Anticyclone Air Rising Sinking Isobars Close together (windy) – numbers are rising (1000, 1002) – tend to be near 1000 or below. Far apart – numbers are falling (1006, 1004) – tend to be above 1000. Winds Anticlockwise Clouds Lots of clouds Clear skies Temperature Cold in the cold sector. Warm in the warm sector. Warm Precipitation Rain (especially at fronts) Dry Fronts? Yes No
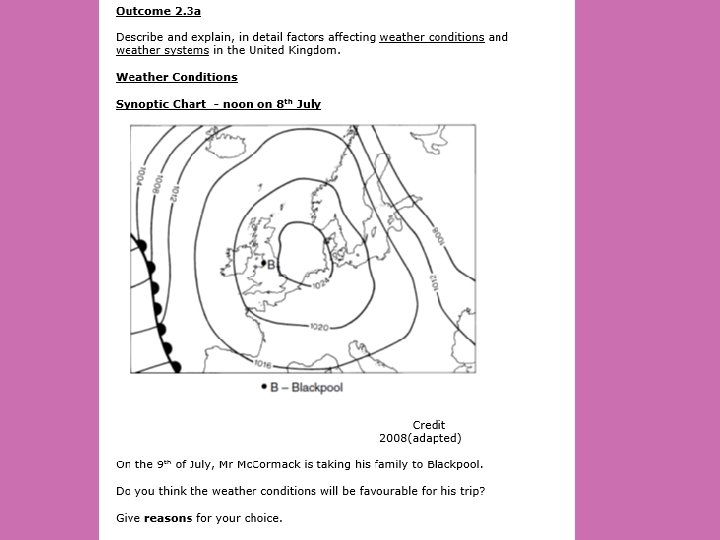
Weather – Synoptic Chart
BBC Weather • https: //www. youtube. com/watch? v=l. ITCF 3 UPVu 4 • https: //www. youtube. com/watch? v=VM 3 R Wkya. N 8 I
What are they? • Synoptic charts = a weather map. • What do they show: • Air pressure – high (air is sinking = anticyclone) or low (air is rising = depression) – show by isobars. • Fronts – cold, warm, occluded.
Isobars • Isobars are lines on a weather map joining together places of equal atmospheric pressure (in millibars) • Isobars close together = high wind • If isobars are increasing (middle circle is highest) = high pressure. If isobars are decreasing (middle circle is lowest number) = low pressure (depressions) • Can be used to show wind direction – air moves anti clockwise around the isobars – use this to show what direction the wind is coming from.
Drawing Time! Get red and blue pencils/pens if you can!
Labels • Isobars: lines joining places with the same air pressure • Wind speed: isobars close together show strong winds (depression), isobars wide apart show gentle winds. (anticyclone) • Wind direction: winds blow in an anticlockwise direction around and towards the low pressure(depression). • Cold front: where cold air is undercutting warm air • Warm front: where the warm air rises over cold air • Warm sector: a wedge of warm air • 1024: unit of air pressure, in millibars (mb)
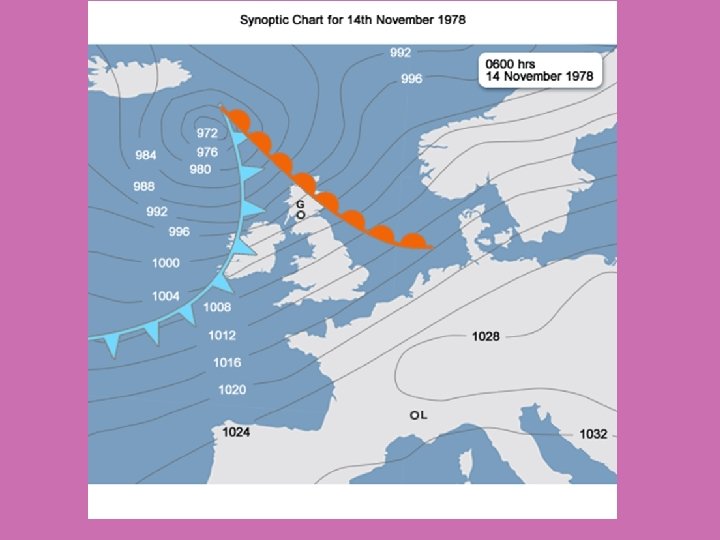
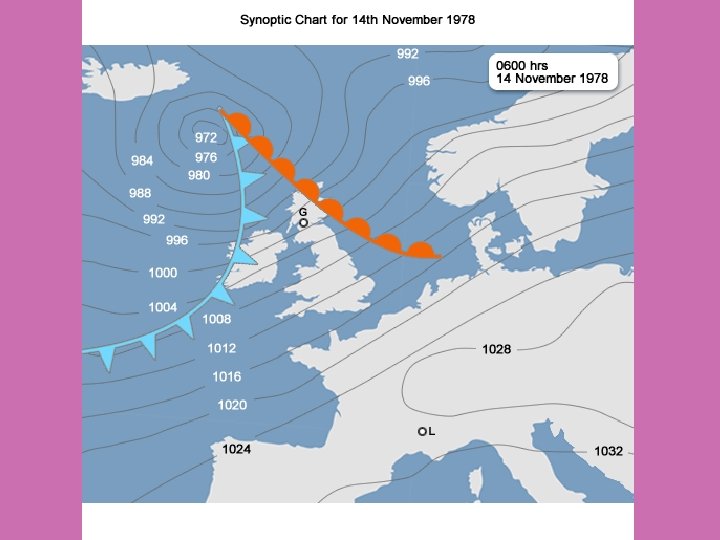
Tell me 5 things about this Synoptic chart.
Passage of Depressions
Learning Intentions • Describe and explain the passage of a depression.
What you need? • • Sheet of blank paper. Blue pen/pencil. Red pen/pencil. Normal pen/pencil.
The Weather in a Depression Copy Picture A from Page 12 of Key Geog 2
What is happening at the fronts? • At the cold front – cold air is more dense so undercuts the warm air – causing it to rise and clouds to form = heavy rain. • At the warm front – warm air is forced to rise over cold air – causing clouds to form and rain = prolonged steady rain.
What weather do they bring?
Part of the Depression Precipitation Temperature Wind Direction Cloud Cover Cold SE Few high clouds (Cirrus). 1 In the cold air sector Dry (before depression) 2 Warm Front Prolonged Rain Becoming (front so warm Warm air forced up by cold air – cool and condenses) SE Cirrus + Nimbostratus 3 Warm Sector Rain turns to drizzle Warm SW Sparse stratus – mainly clear skies 4 At the cold front Heavy Rain Becoming Cold NW Cumulonimbu s 5 Cold Sector Rain ease off. Cold NW Fewer clouds (few high cirrus)
Part of the Depression Precipitation Temperature Wind Direction Cloud Cover 1 In the cold air sector Dry (before depression) Cold SE Few high clouds (cirrus – the whispy ones) 2 At the warm front Prolonged rain (warm air forced up by cold air – cooling and condensing) Becoming warm SE Cirrus + Nimbostratus 3 Warm Sector Rain turns to drizzle Warm SW Sparse stratus – mainly clear skies 4 At the cold front Heavy rain Becoming cold NW Cumulonimbu s 5 Cold Sector Rain eases Cold NW Fewer clouds (few high cirrus clouds)
Occluded Front Where cold front and warm front catch up with each other = Sudden downpours of heavy rain
Human Passage of a Depression!
Table Graffiti • Draw a depression your table – include warm front and a cold front. • Label the weather at each section: • Cold Sector • Before Cold Front • Warm Sector. • Warm Front
The passage of a depression – the clouds!
CIRRUS CLOUDS
Stratus
Cumulus
Cumulonimbus
Write your own weather report for London. Fort William Edinburgh Belfast London
• London is currently in the warm sector. This means that the temperature will be warm as it is warm air in this sector. The rain will be drizzle or none at all as front has just passed. • The cold front will then hit which brings heavy rain as hot air rises over cold air. The temperature will start become cold and more cumulonimbus clouds will appear due to air being forced up. • After the cold front will be the cold sector which will bring cold air meaning temperature will decrease. The rain will begin to ease leaving some high cirrus clouds.
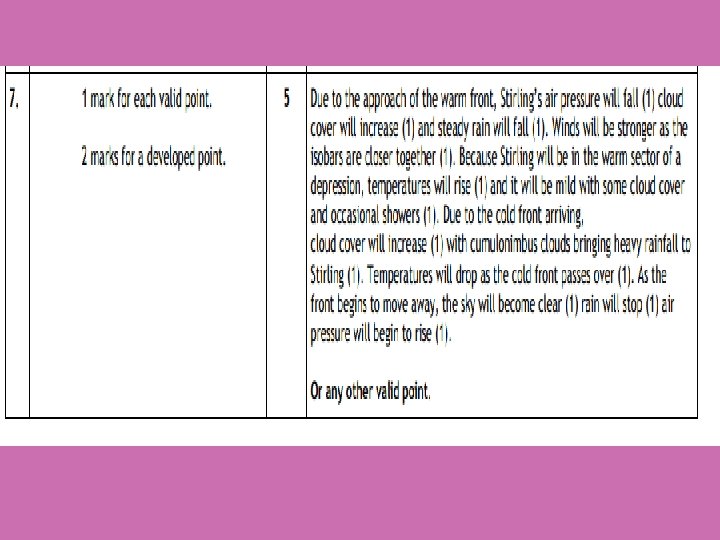
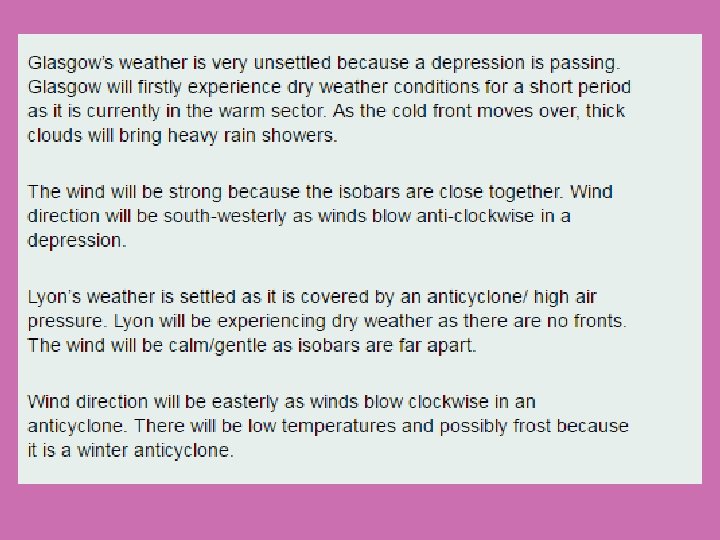
Explain the changes which will take place in Glasgow’s weather over the next 24 hours (6)
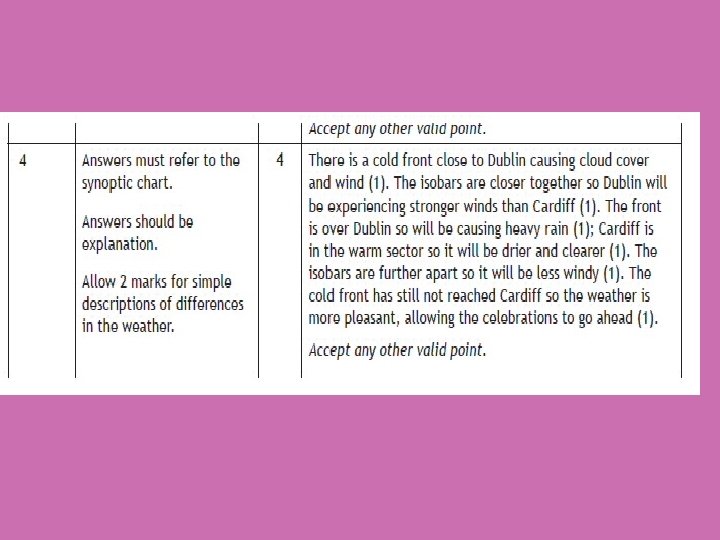
• Explain why Cardiff’s New Years eve celebrations went ahead while Dublin was cancelled (4).
• The temperature in Cardiff is warmer than Dublin as Cardiff is in warm sector and Dublin is on the Cold Front (1). • As it on the cold front, Dublin will get heavy rain whereas Cardiff will be drizzle/lack of rain (1). • Due to this rain, Dublin will have lots of cloud cover (1). • Dublin is windier as isobars are closer together than Cardiff (1).
Specimen Paper https: //www. sqa. org. uk/files_ccc /Geography. SQPRN 5. pdf
Anticyclones
Learning Intentions • Describe weather associated with high pressure. • Explain the difference between high pressure in winter and summer.
Anticyclone - Summer v Winter Summer Winter Precipitation None Winds Gentle winds Cloud Cover Clear Sky Temperature during day Hot Cold Temperature at night Falls rapidly Frost at night Weather (fog, thunderstorms etc. ) Sunny, Occasional Thunderstorms, Morning Mist Early morning Fog Use page 15 of Key Geog 2 to complete this table.
In the Summer. . . • • • Dry = air is sinking. Light winds or calm = isobars are widely spaced. Sunny, few clouds = air is sinking. Hot during day because of few clouds. Cool at night because of few clouds Early morning dew -= air next to the ground cools, condensation occurs. • Occasional thunderstorms = heat from ground begins to rise, cools and condenses. • Coastal Mist.
In the winter. . . • Dry = air is sinking. • Light winds or calm = isobars widely spaced. • Sunny, few clouds = air is sinking. • Cool during day • Frost at night = few clouds. • Early morning fog = especially on low ground.
Anticyclone on a Synoptic Chart
Weather Circle Question • It is summer in an anti cyclone. Explain the weather shown by the weather circle on the board (5).
Anticyclone - describe and explain Describe Explain (why? ) 1 okta of cloud cover High pressure system which means the air is going down so cannot rise to form clouds. 5 knots of wind Anticyclones are slow moving and stable. (isobars far apart) 20 o Celsius Summer. No clouds to block the sunlight. No precipitation No clouds to produce precipitation. NW wind Winds go clockwise in anticyclone.
6
Venice Synoptic Chart – Venice – 22 nd July 2018. 1. Describe the current weather being experienced in Venice (4). 2. Explain the impacts of this on the people of Venice (4).
Outcome 1. 1 b
Being a weather forecaster
Things you may not have known… • Weather reporters work long hours – they need to interpret the met office data to create weather reports. • Nobody in the room, just themselves and a camera. • Weather reports need to be an exact time – not a second over or under – as they are live. • On at end of news as its the bit everyone wants to see.
They can’t see what they are pointing to as use a green screen.
Weather Videos • https: //www. youtube. com/watch? v=HZb. S R_R 76 GY • https: //www. youtube. com/watch? v=EZb. SR 4 Tn. TE • https: //www. youtube. com/watch? v=54 FKp 4 Ib 4 Kk