IOT Measurements Amplifier Improvements at Diamond Peter Marten


- Slides: 26
IOT Measurements & Amplifier Improvements at Diamond Peter Marten Senior RF Technician Diamond RF Group 15 th ESLS-RF Meeting, October 5 -6 th, ESRF
Agenda Ø IOT Statistics Ø Amplifier Trips Ø IOT Measurements Ø Amplifier Faults Ø Modifications Ø Current Projects
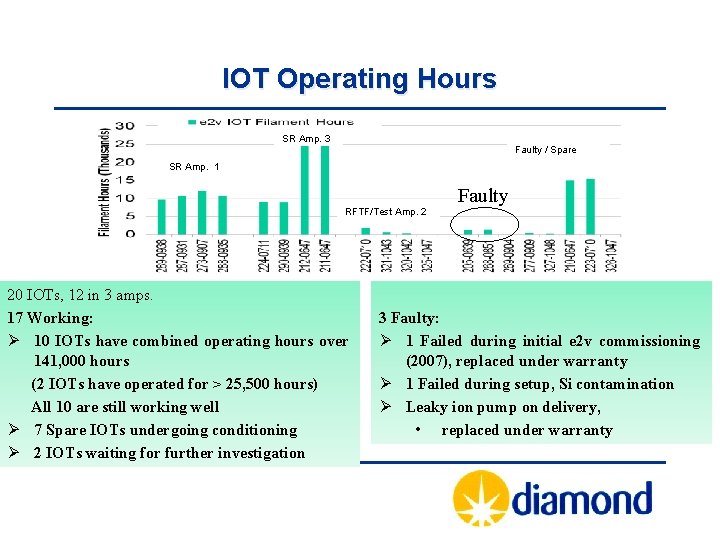
IOT Operating Hours SR Amp. 3 Faulty / Spare SR Amp. 1 RFTF/Test Amp. 2 20 IOTs, 12 in 3 amps. 17 Working: Ø 10 IOTs have combined operating hours over 141, 000 hours (2 IOTs have operated for > 25, 500 hours) All 10 are still working well Ø 7 Spare IOTs undergoing conditioning Ø 2 IOTs waiting for further investigation Faulty 3 Faulty: Ø 1 Failed during initial e 2 v commissioning (2007), replaced under warranty Ø 1 Failed during setup, Si contamination Ø Leaky ion pump on delivery, • replaced under warranty
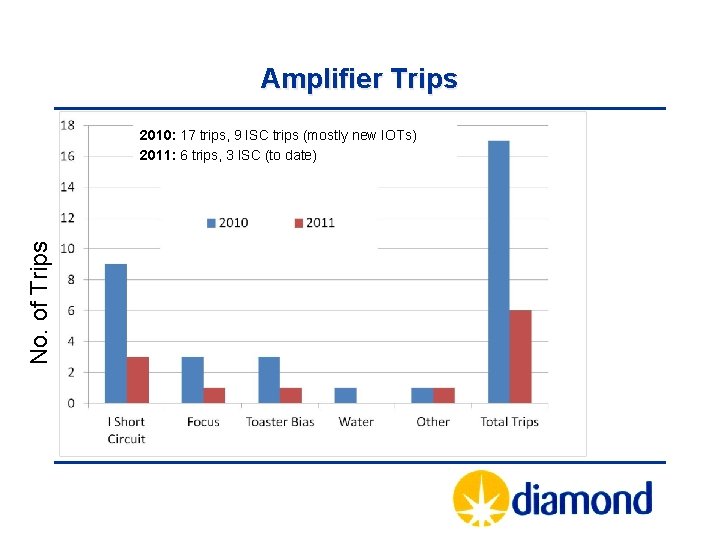
Amplifier Trips No. of Trips 2010: 17 trips, 9 ISC trips (mostly new IOTs) 2011: 6 trips, 3 ISC (to date)
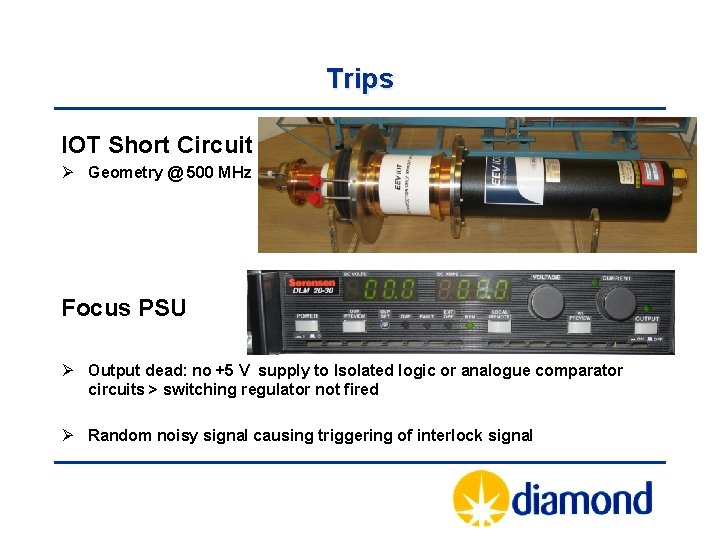
Trips IOT Short Circuit Ø Geometry @ 500 MHz Focus PSU Ø Output dead: no +5 V supply to Isolated logic or analogue comparator circuits > switching regulator not fired Ø Random noisy signal causing triggering of interlock signal
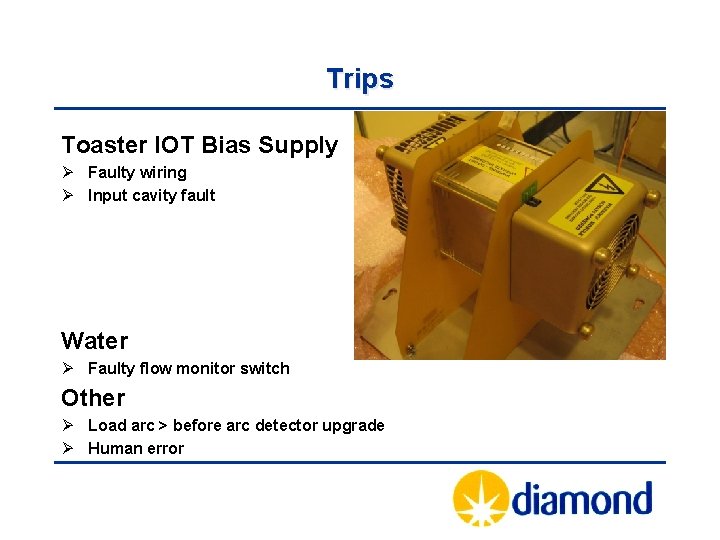
Trips Toaster IOT Bias Supply Ø Faulty wiring Ø Input cavity fault Water Ø Faulty flow monitor switch Other Ø Load arc > before arc detector upgrade Ø Human error
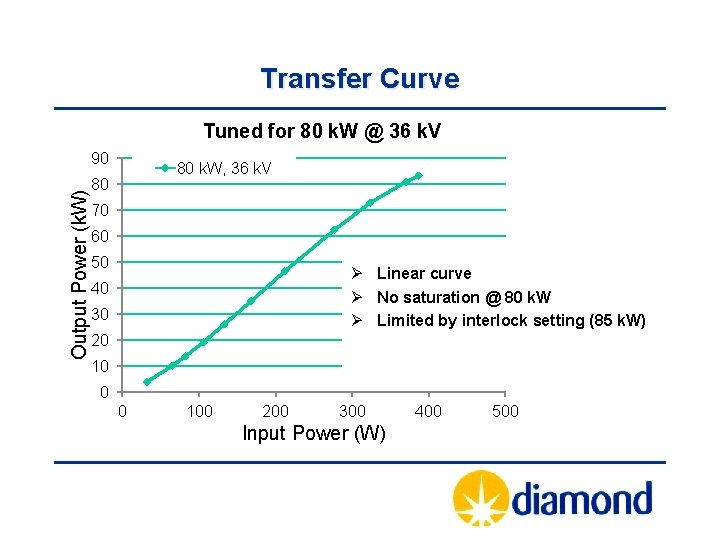
Transfer Curve Tuned for 80 k. W @ 36 k. V Output Power (k. W) 90 80 k. W, 36 k. V 80 70 60 50 Ø Linear curve Ø No saturation @ 80 k. W Ø Limited by interlock setting (85 k. W) 40 30 20 10 0 0 100 200 300 Input Power (W) 400 500
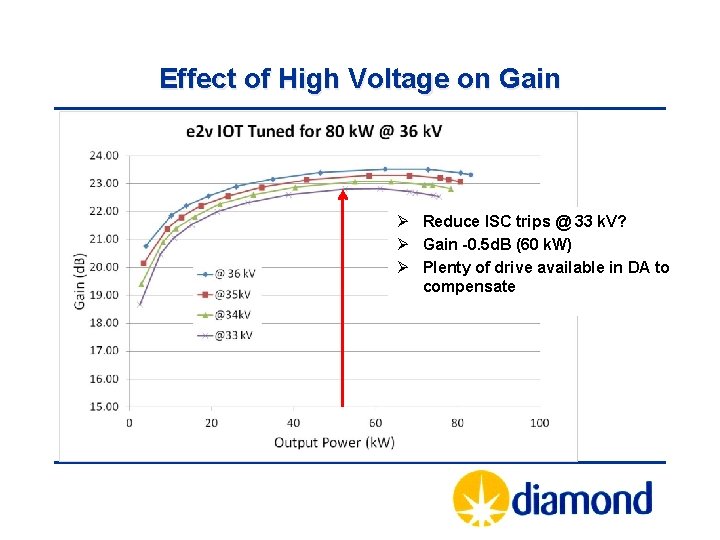
Effect of High Voltage on Gain Ø Reduce ISC trips @ 33 k. V? Ø Gain -0. 5 d. B (60 k. W) Ø Plenty of drive available in DA to compensate
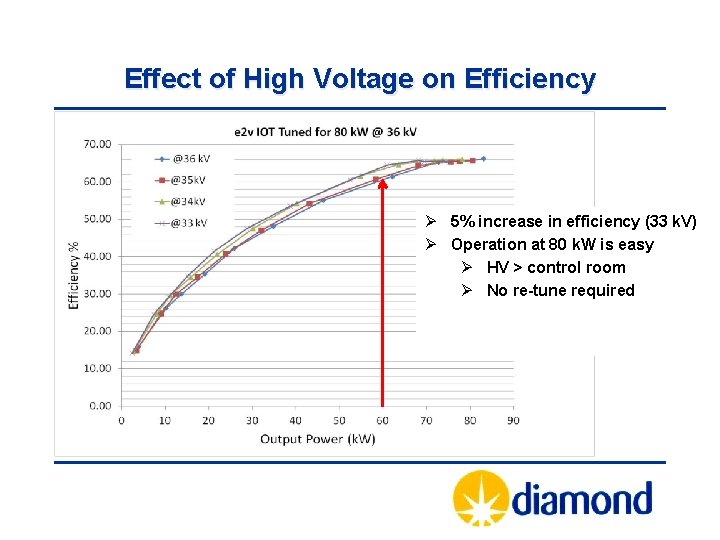
Effect of High Voltage on Efficiency Ø 5% increase in efficiency (33 k. V) Ø Operation at 80 k. W is easy Ø HV > control room Ø No re-tune required
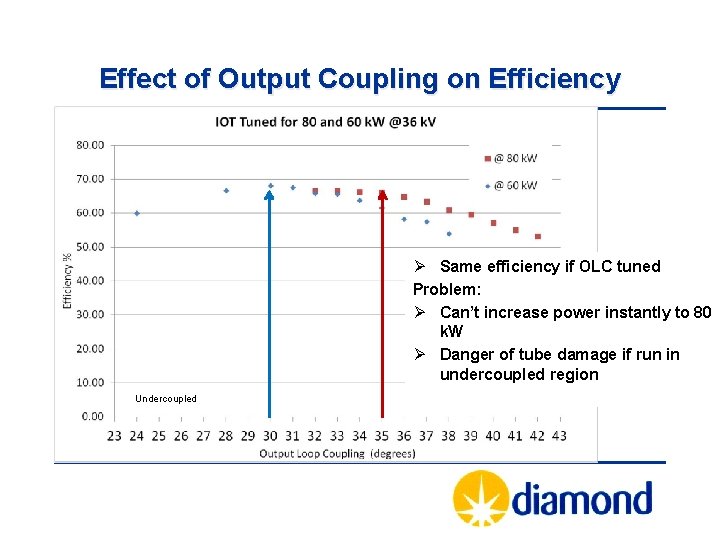
Effect of Output Coupling on Efficiency Ø Same efficiency if OLC tuned Problem: Ø Can’t increase power instantly to 80 k. W Ø Danger of tube damage if run in undercoupled region Undercoupled
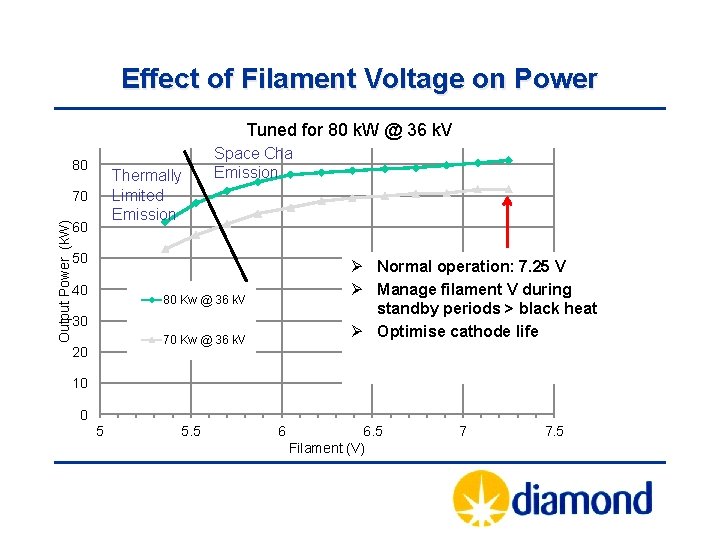
Effect of Filament Voltage on Power Tuned for 80 k. W @ 36 k. V 80 Thermally Limited Emission Output Power (k. W) 70 60 Space Charge Limited Emission 50 40 Ø Normal operation: 7. 25 V Ø Manage filament V during standby periods > black heat Ø Optimise cathode life 80 Kw @ 36 k. V 30 70 Kw @ 36 k. V 20 10 0 5 5. 5 6 6. 5 Filament (V) 7 7. 5
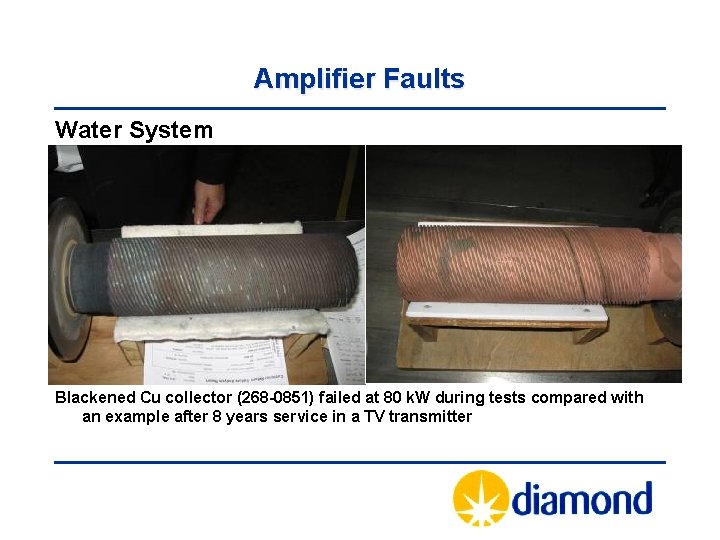
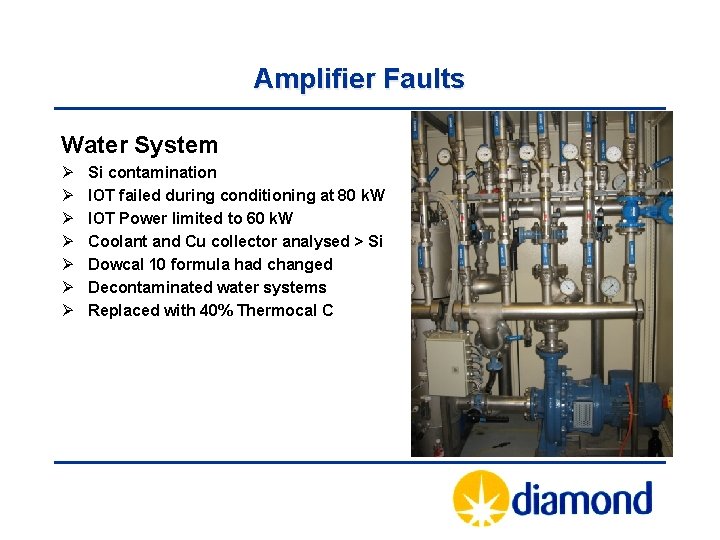
Amplifier Faults Water System Blackened Cu collector (268 -0851) failed at 80 k. W during tests compared with an example after 8 years service in a TV transmitter
Amplifier Faults Water System Ø Ø Ø Ø Si contamination IOT failed during conditioning at 80 k. W IOT Power limited to 60 k. W Coolant and Cu collector analysed > Si Dowcal 10 formula had changed Decontaminated water systems Replaced with 40% Thermocal C
Modifications ØPSM AHU belts replaced (Optibelt) ØSmoke detectors installed inside HVPS ØPSM PSI 04 current measurement board modified ØSecond AHU for rack and IOT cooling ØDrive amplifier coax upgraded (<loss, RF, life)
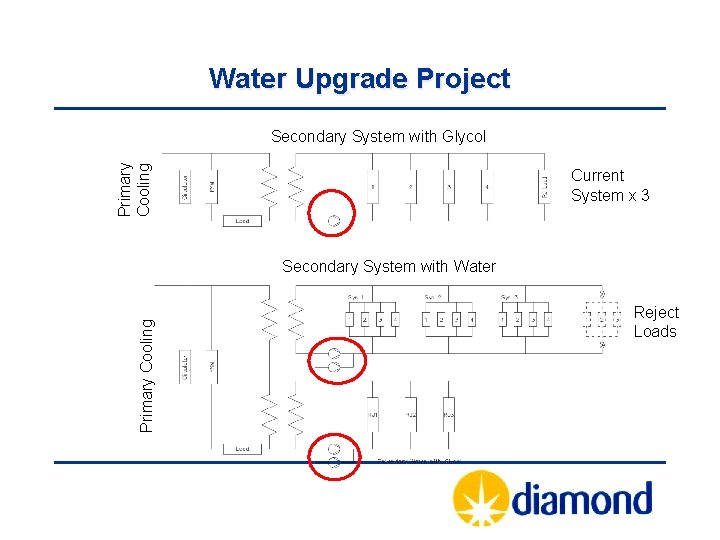
Water Upgrade Project Primary Cooling Secondary System with Glycol Current System x 3 Primary Cooling Secondary System with Water Reject Loads
Water Upgrade Project Ø Provide duty and standby pumps Ø Eliminate glycol from IOT cooling Ø Improve present water system (disturbance during repairs often causes unrelated leaks) Ø Ideally remove Glycol requirement from reject loads (H & S, messy, reduced cooling efficiency) Ø Simplify design to cool all three systems from one secondary water system (R. load modelling)
The Water Load Development
The Water Load Ø The present load uses a mixture of 40% Glycol and 60% Water Ø Need to maintain a separate circuit(? ) Ø The new load will use pure water Ø Easier maintenance
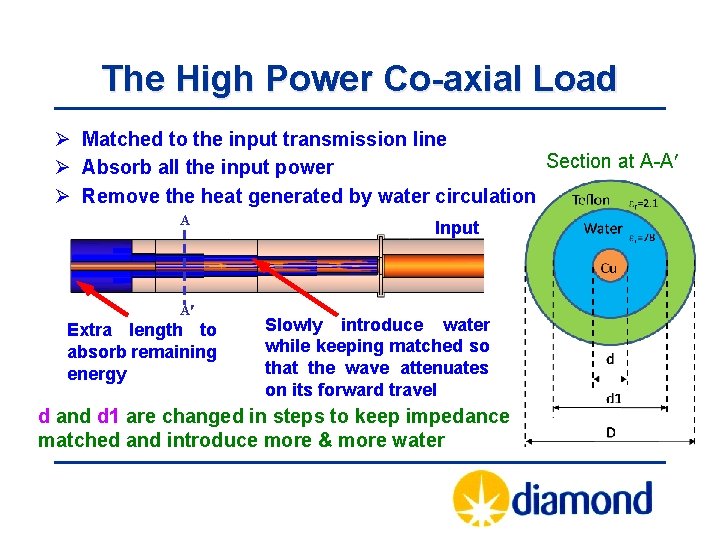
The High Power Co-axial Load Ø Matched to the input transmission line Section at A-A Ø Absorb all the input power Ø Remove the heat generated by water circulation A A Extra length to absorb remaining energy Input Slowly introduce water while keeping matched so that the wave attenuates on its forward travel d and d 1 are changed in steps to keep impedance matched and introduce more & more water
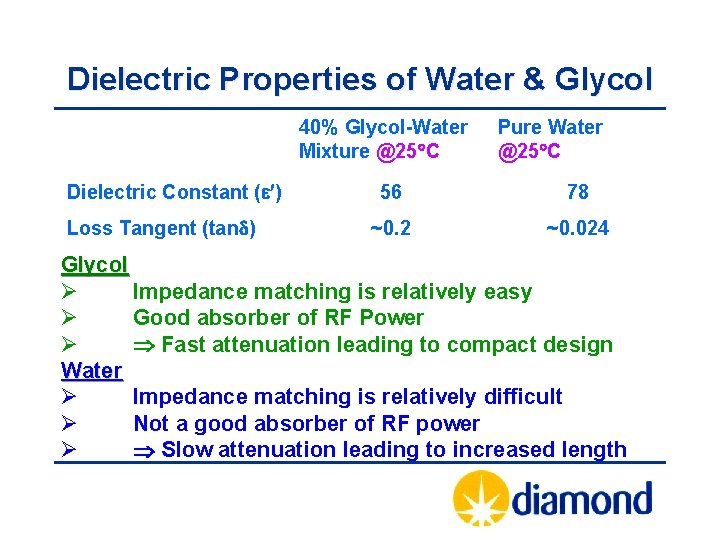
Dielectric Properties of Water & Glycol 40% Glycol-Water Mixture @25 C Dielectric Constant ( ) Loss Tangent (tand) Pure Water @25 C 56 78 ~0. 2 ~0. 024 Glycol Ø Impedance matching is relatively easy Ø Good absorber of RF Power Ø Fast attenuation leading to compact design Water Ø Impedance matching is relatively difficult Ø Not a good absorber of RF power Ø Slow attenuation leading to increased length
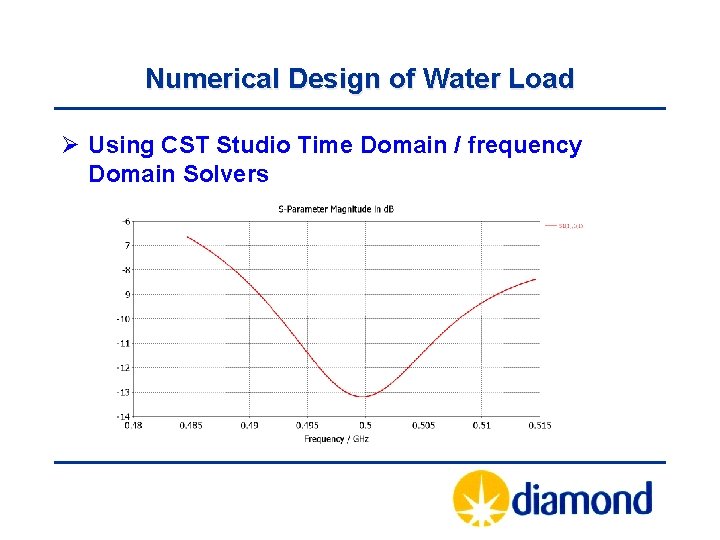
Numerical Design of Water Load Ø Using CST Studio Time Domain / frequency Domain Solvers
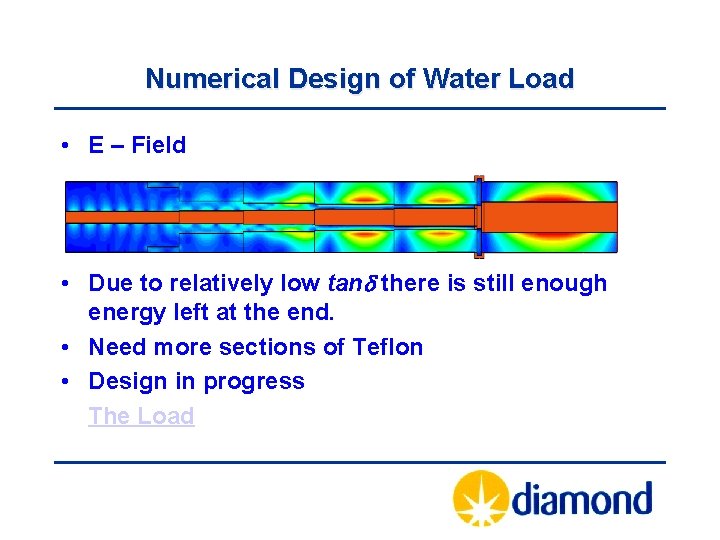
Numerical Design of Water Load • E – Field • Due to relatively low tand there is still enough energy left at the end. • Need more sections of Teflon • Design in progress The Load
Fast IOT Fault Detection and Isolation Purpose Ø IOT breakdown is single largest amplifier fault Ø Fault on one IOT isolates HV for all 4 IOTs Ø Typically 10 -15 trips per year / 8 IOTs in operation Ø Recovery is fast – but beam is lost Possible solution Ø Detect IOT fault (µs) Ø Isolate IOT HV (dissipated energy < 9 J) Ø Maintain beam –> Other IOTs to ramp up Ø Re-instate IOT -> Other IOTs ramps down
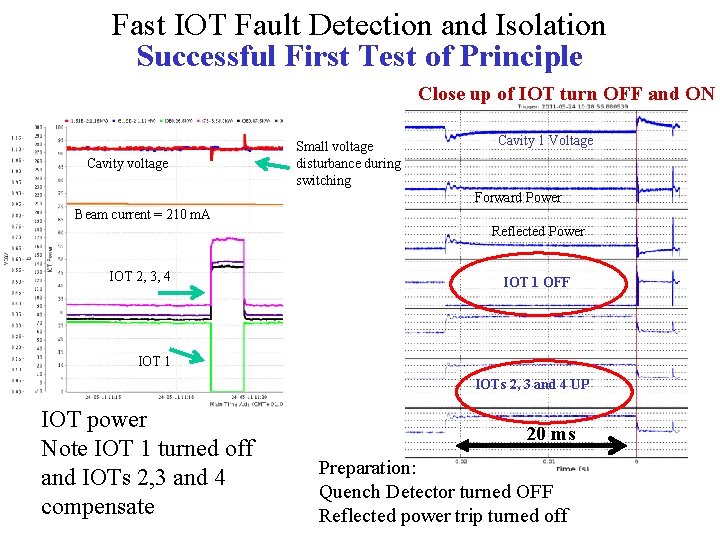
Fast IOT Fault Detection and Isolation Successful First Test of Principle Close up of IOT turn OFF and ON Cavity voltage Small voltage disturbance during switching Cavity 1 Voltage Forward Power Beam current = 210 m. A Reflected Power IOT 2, 3, 4 IOT 1 OFF IOT 1 IOTs 2, 3 and 4 UP IOT power Note IOT 1 turned off and IOTs 2, 3 and 4 compensate 20 ms Preparation: Quench Detector turned OFF Reflected power trip turned off
Ongoing Work Ø Signal debounce and first fault reporting Ø Filament management Ø HV PSM regulation investigation at certain loads
On behalf of the RF Group Morten Jensen Pengda Gu Matt Maddock Peter Marten Shivaji Pande Simon Rains Adam Rankin David Spink Alun Watkins Thank you for your attention