Introduction to Mass Spectrometry cont Principles of ElectronImpact


- Slides: 13

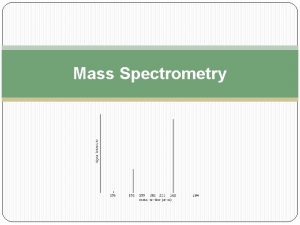
Introduction to Mass Spectrometry (cont) Principles of Electron-Impact Mass Spectrometry: Ø A mass spectrometer produces a spectrum of masses based on the structure of a molecule Ø A mass spectrum is a plot of the distribution of ion masses corresponding to the formula weight of a molecule and/or fragments derived from it Ø The x-axis of a mass spectrum represents the masses of ions Ø The y-axis represents the relative abundance of each ion Ø The pattern of ions obtained and their abundance is characteristic of the structure of a particular molecule MC 13. 3 Spectroscopy, Pt III continue…. .

Introduction to Mass Spectrometry (cont) Principles of Electron-Impact Mass Spectrometry (cont): Ø If the only ion that is present is the molecular ion, mass spectrometry provides a way to measure the molecular weight of a compound and is often used for this purpose. Ø However, the molecular ion often fragments to a mixture of species of lower m/z continue…. .

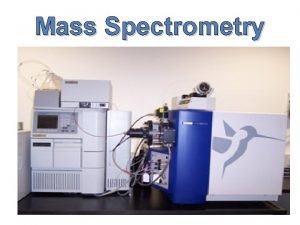
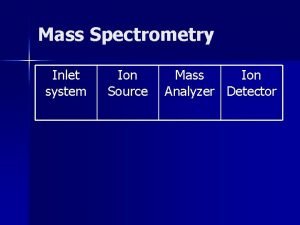
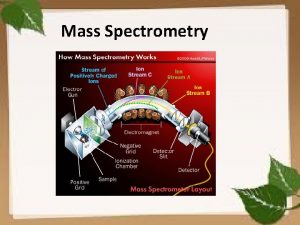
Introduction to Mass Spectrometry (cont) The Mass Spectrometer Performs Several Functions: 1) Elevated temperatures and reduced pressures convert solids and liquids to gases 2) Gaseous molecules are ionized to positively charged species as they interact with a high energy electron beam 3) Electric and magnetic fields separate these positively charged ions into a spectrum according to their mass-to-charge ratio 4) A mass detector connected to a computer measures, records and stores the spectrum MC 13. 3 Spectroscopy, Pt III continue…. .

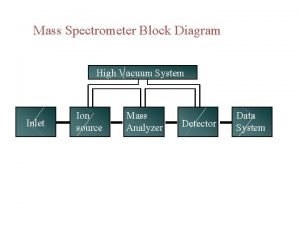
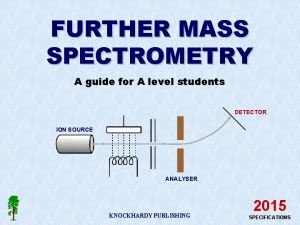
Introduction to Mass Spectrometry (cont) The Mass Spectrometer: MC 13. 3 Spectroscopy, Pt III continue…. .

Introduction to Mass Spectrometry (cont) The Mass Spectrometer: MC 13. 3 Spectroscopy, Pt III continue…. .

Interpreting Mass Spectral Data Some molecules undergo very little fragmentation: Ø Benzene is an example. The major peak corresponds to the molecular ion Relative intensity continue…. . 100 80 m/z = 78 60 40 20 40 60 80 100 120 m/z

Interpreting Mass Spectral Data (cont) Isotopic Clusters: Ø The natural distribution of isotopes gives rise to specific ion clusters H H H H 79 79 78 H H H H H 93. 4% 6. 5% 0. 1% All H are 1 H and all C are 12 C One C is 13 C One H is 2 H continue…. .

Interpreting Mass Spectral Data (cont) Isotopic Clusters in Chlorobenzene: 35 Cl Relative Abundance of Chlorine Isotopes 35 Cl Relative intensity 37 Cl = 37 Cl 100 32. 5 100 112 80 60 114 40 m/z 20 0 20 40 60 80 100 120 continue…. .

Interpreting Mass Spectral Data (cont) Isotopic Clusters in Chlorobenzene (cont): Ø No m/z 77, 79 pair; Ø Therefore ion responsible for m/z 77 peak does not contain Cl + H H H Relative intensity H 100 80 77 60 40 m/z 20 0 20 40 60 80 100 H 120 continue…. .

Interpreting Mass Spectral Data (cont) Alkanes undergo extensive fragmentation: CH 3—CH 2—CH 2—CH 3 43 57 71 Relative intensity 85 99 100 80 Decane 60 40 20 0 142 20 40 60 m/z 80 100 120 continue…. .

Interpreting Mass Spectral Data (cont) Propylbenzene fragments at the benzylic position: CH 2 — CH 2 CH 3 91 Relative intensity 100 91 80 60 40 120 m/z 20 0 20 40 60 80 100 120 continue…. .

Interpreting Mass Spectral Data (cont) Molecular Formula: A Clue to Structure: Ø One of the first pieces of information we try to obtain when determining a molecular structure is the molecular formula Ø However, we can gain some information from the molecular weight Ø Mass spectrometry makes it relatively easy to determine molecular weights. MC 13. 3 Spectroscopy, Pt III continue…. .

Interpreting Mass Spectral Data (cont) Exact Molecular Weights: Ø The exact mass of certain nuclides is shown below MC 13. 3 Spectroscopy, Pt III end…. .
 Cont or cont'd
 Cont or cont'd
 Mass spectrometer schematic diagram
 How to read mass spectrometry graph
 Applications of mass spectroscopy
 Batch inlet system in mass spectrometry
 Mass spectrometry in forensic science
 Nitrogen rule in mass spectrometry
 Butyl isopropyl ether
 Mass
Mass Dating
 Mass spectrometry problem set
 Rule of thirteen mass spectrometry
 Mass spectrometry data acquisition for gc/ms
