International Workshop on Population Projections using Census Data
- Slides: 44
International Workshop on Population Projections using Census Data 14 – 16 January 2013 Beijing, China
Session III: Establishing the base population • Detecting errors in data • Correcting distorted or incomplete data
Detecting Errors in Age and Sex Distribution Data • Basic tools • Graphical analysis - Focus of the presentation - Population by age and sex determined by fertility, mortality and migration, follows fairly recognizable patterns • Population pyramids • Graphical cohort analysis • Age and sex ratios • Summary indices of error in age-sex data • Whipple’s index • Myers’ Blended Method • United Nations Age-sex accuracy index • Use of stable population theory • Uses of consecutive censuses
What to Look For at the Evaluation • Possible data errors in the age-sex structure • Age misreporting (age heaping and/or age exaggeration) • Coverage errors – net under- or over-count (by age or sex) • Significant discrepancies in age-sex structure due to extraordinary events • High migration, war, famine, HIV/AIDS epidemic etc
Collecting Information on Age and Quality • Age - the interval of time between the date of birth and the date of the census, expressed in completed solar years • The date of birth (year, month and day) - more precise information and is preferred • Completed age (age at the individual’s last birthday) – less accurate • • Misunderstanding: the last, the next or the nearest birthday? Rounding to nearest age ending in 0 or 5 (age heaping) Children under 1 - may be reported as 1 year of age Use of different calendars in the same country– western, Islamic or Lunar
Basic Graphical Analysis - Population Pyramid • Basic procedure for assessing the quality of census data on age and sex • Displays the size of population enumerated in each age group (or cohort) by sex • The base of the pyramid is mainly determined by the level of fertility in the population, while how fast it converges to peak is determined by previous levels of mortality and fertility • The levels of migration by age and sex also affect the shape of the pyramid
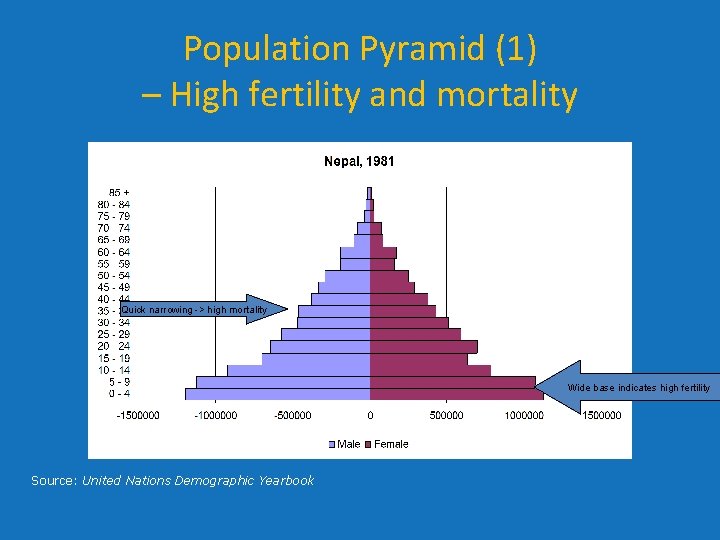
Population Pyramid (1) – High fertility and mortality Quick narrowing -> high mortality Wide base indicates high fertility Source: United Nations Demographic Yearbook
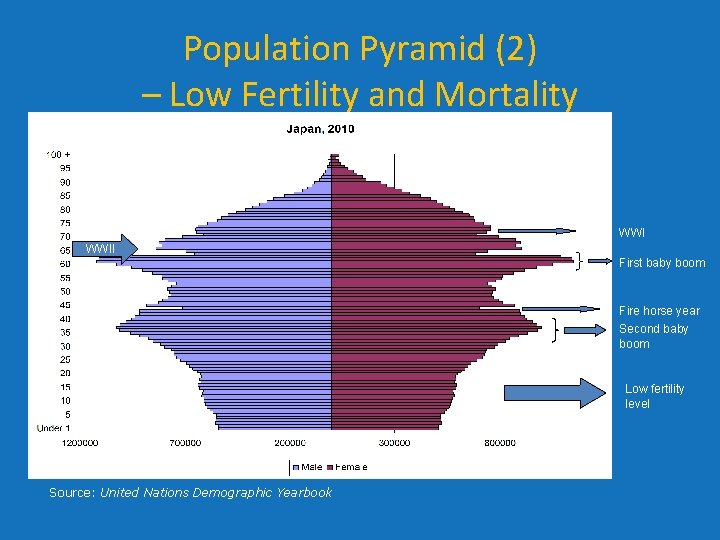
Population Pyramid (2) – Low Fertility and Mortality WWII First baby boom Fire horse year Second baby boom Low fertility level Source: United Nations Demographic Yearbook
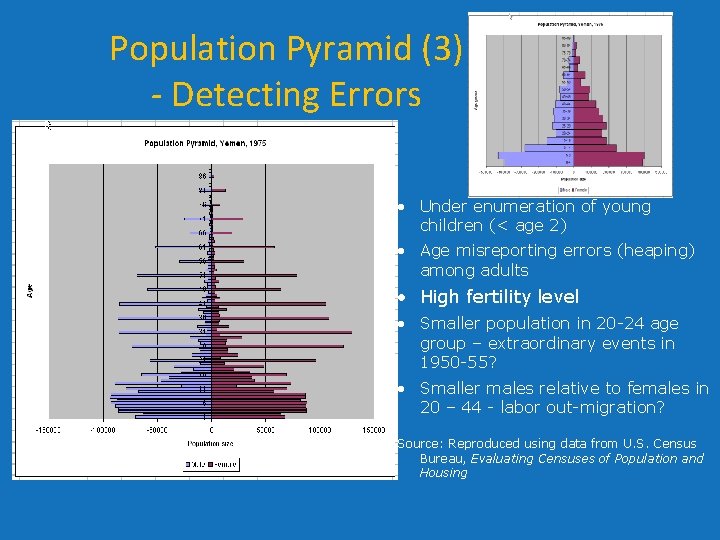
Population Pyramid (3) - Detecting Errors • Under enumeration of young children (< age 2) • Age misreporting errors (heaping) among adults • High fertility level • Smaller population in 20 -24 age group – extraordinary events in 1950 -55? • Smaller males relative to females in 20 – 44 - labor out-migration? Source: Reproduced using data from U. S. Census Bureau, Evaluating Censuses of Population and Housing
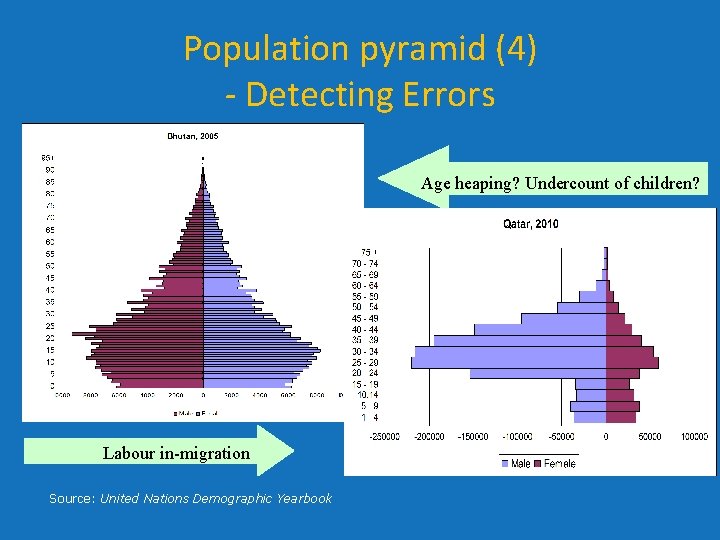
Population pyramid (4) - Detecting Errors Age heaping? Undercount of children? Labour in-migration Source: United Nations Demographic Yearbook
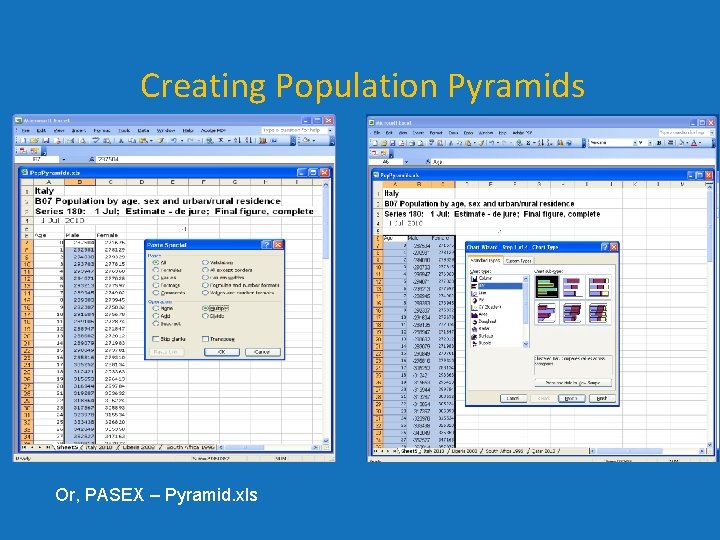
Creating Population Pyramids Or, PASEX – Pyramid. xls
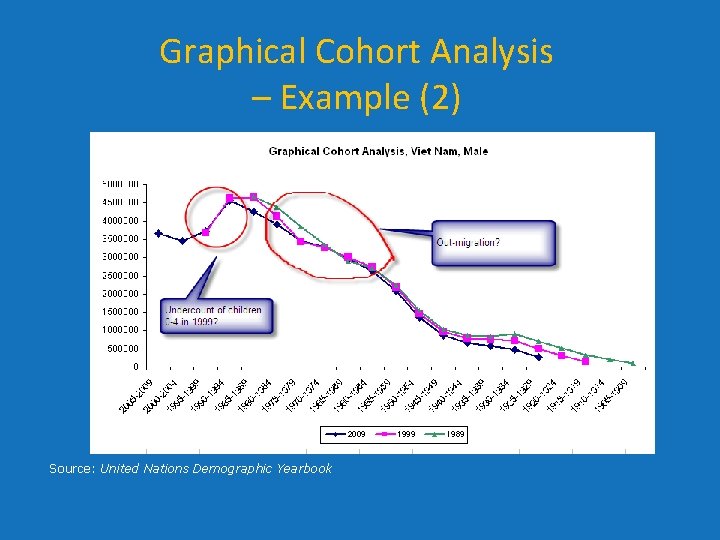
Basic Graphical Analysis - Graphical Cohort Analysis • Tracking actual cohorts over multiple censuses • The size of each cohort should decline over each census due to mortality, if no significant international migration • The age structure (the lines) for censuses should follow the same pattern in the absence of census errors • An important advantage - possible to evaluate the effects of extraordinary events and other distorting factors by following actual cohorts over time
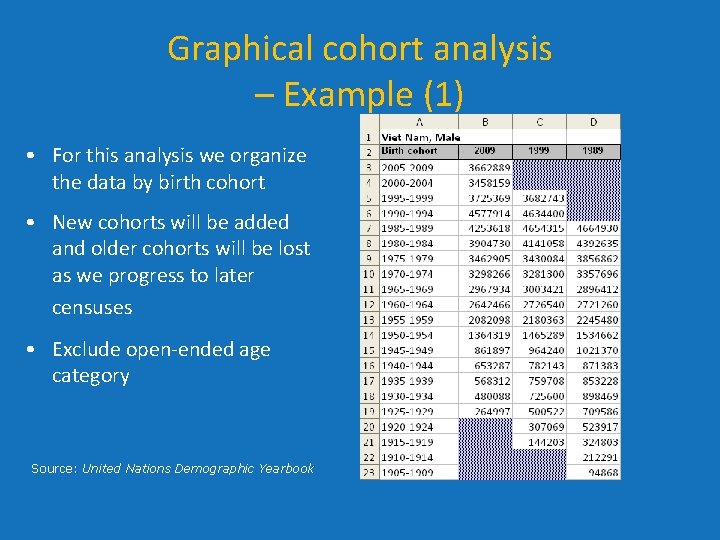
Graphical cohort analysis – Example (1) • For this analysis we organize the data by birth cohort • New cohorts will be added and older cohorts will be lost as we progress to later censuses • Exclude open-ended age category Source: United Nations Demographic Yearbook
Graphical Cohort Analysis – Example (2) Source: United Nations Demographic Yearbook
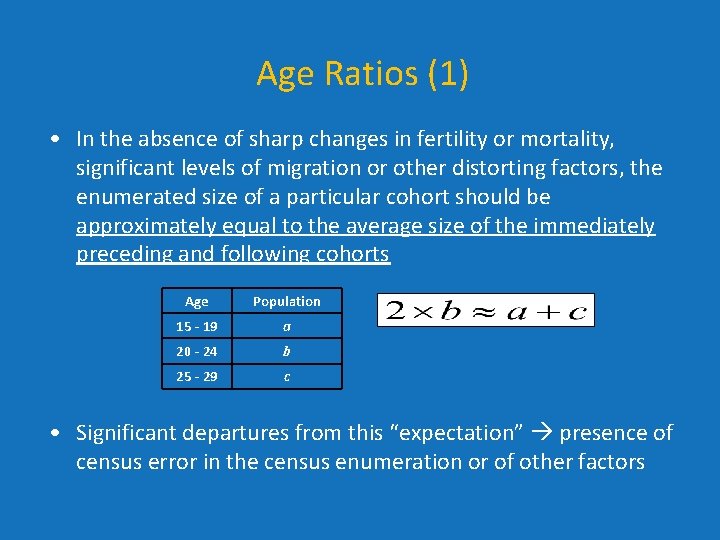
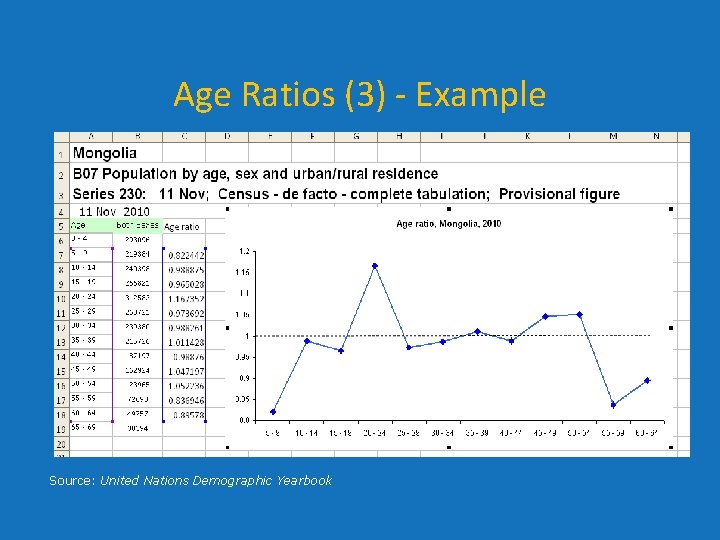
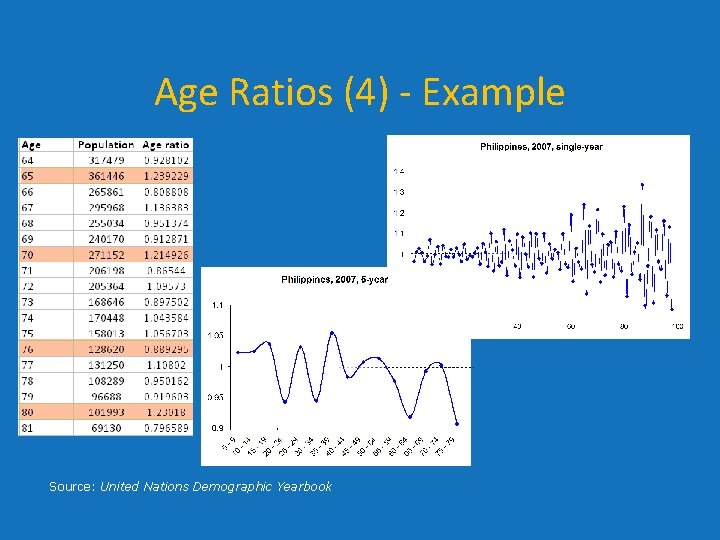
Age Ratios (1) • In the absence of sharp changes in fertility or mortality, significant levels of migration or other distorting factors, the enumerated size of a particular cohort should be approximately equal to the average size of the immediately preceding and following cohorts Age Population 15 - 19 a 20 - 24 b 25 - 29 c • Significant departures from this “expectation” presence of census error in the census enumeration or of other factors
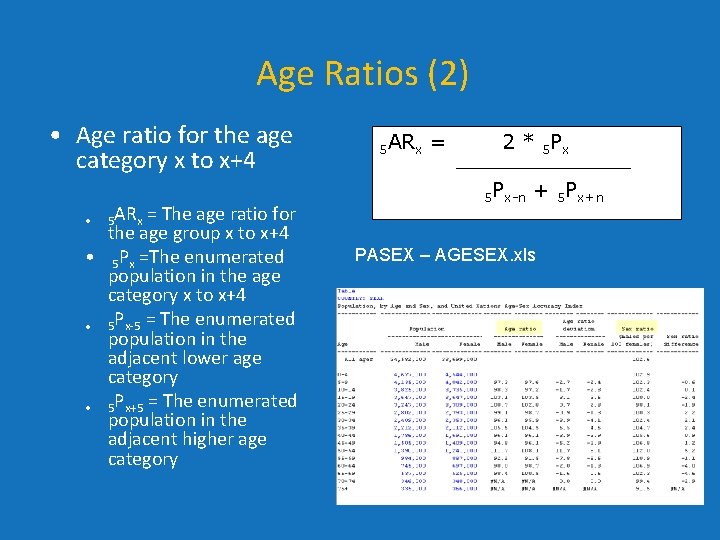
Age Ratios (2) • Age ratio for the age category x to x+4 = The age ratio for the age group x to x+4 • 5 Px =The enumerated population in the age category x to x+4 • 5 Px-5 = The enumerated population in the adjacent lower age category • 5 Px+5 = The enumerated population in the adjacent higher age category • 5 ARx = 2 * 5 Px-n + 5 Px+n PASEX – AGESEX. xls
Age Ratios (3) - Example Source: United Nations Demographic Yearbook
Age Ratios (4) - Example Source: United Nations Demographic Yearbook
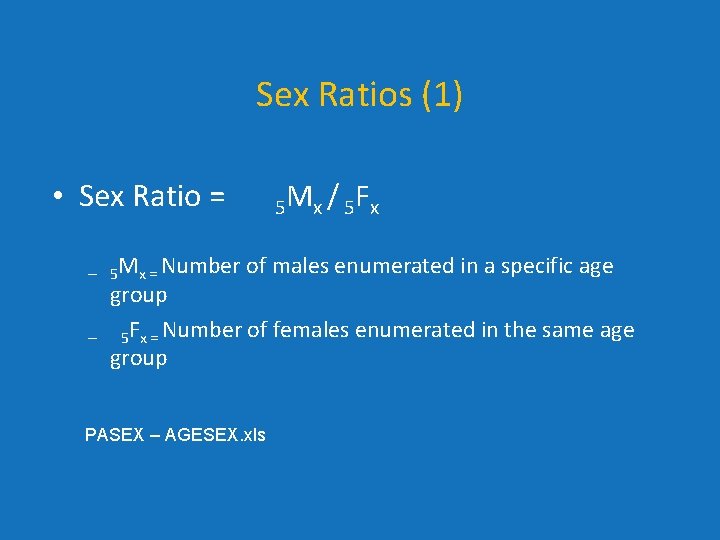
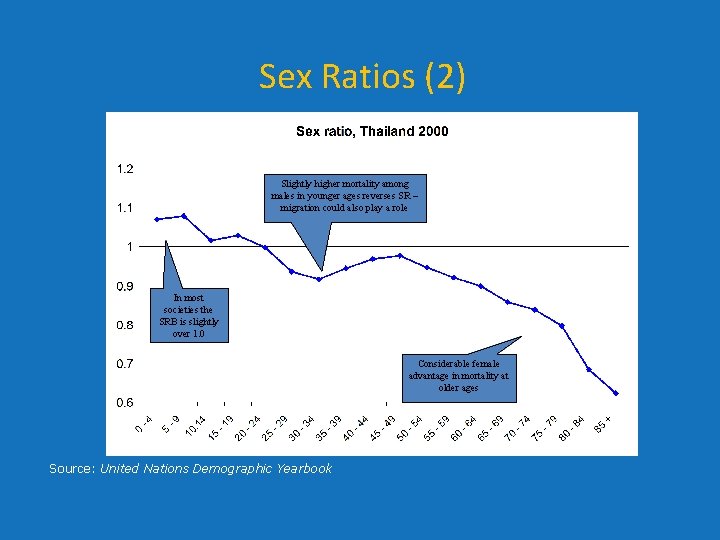
Sex Ratios (1) • Sex Ratio = – 5 Mx = Number – 5 M x / 5 Fx of males enumerated in a specific age group 5 Fx = Number of females enumerated in the same age group PASEX – AGESEX. xls
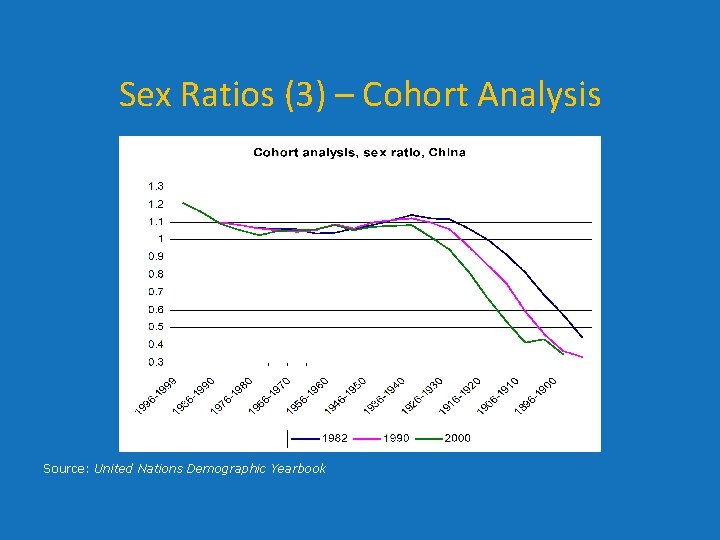
Sex Ratios (2) Slightly higher mortality among males in younger ages reverses SR – migration could also play a role In most societies the SRB is slightly over 1. 0 Considerable female advantage in mortality at older ages Source: United Nations Demographic Yearbook
Sex Ratios (3) – Cohort Analysis Source: United Nations Demographic Yearbook
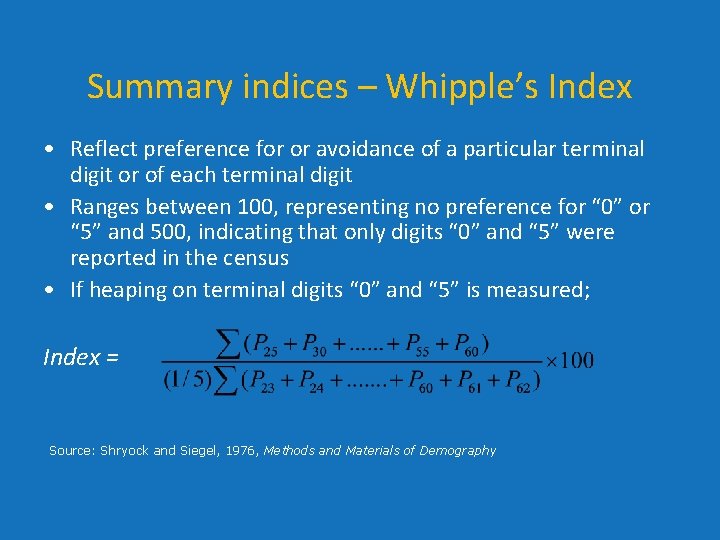
Summary indices – Whipple’s Index • Reflect preference for or avoidance of a particular terminal digit or of each terminal digit • Ranges between 100, representing no preference for “ 0” or “ 5” and 500, indicating that only digits “ 0” and “ 5” were reported in the census • If heaping on terminal digits “ 0” and “ 5” is measured; Index = Source: Shryock and Siegel, 1976, Methods and Materials of Demography
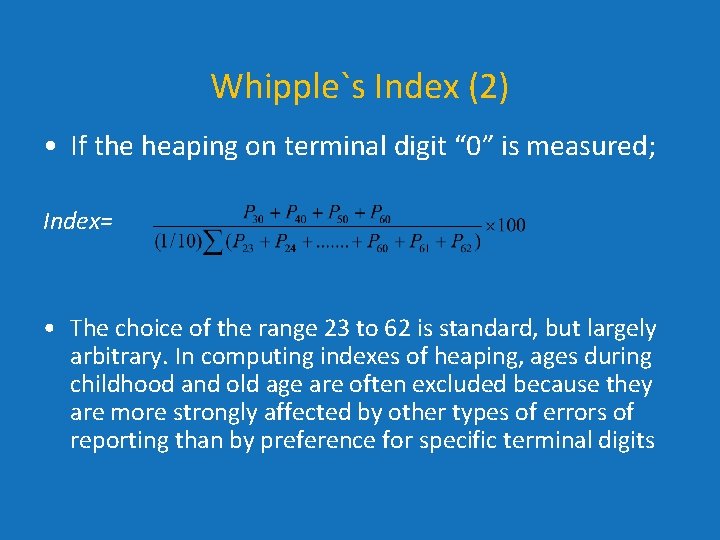
Whipple`s Index (2) • If the heaping on terminal digit “ 0” is measured; Index= • The choice of the range 23 to 62 is standard, but largely arbitrary. In computing indexes of heaping, ages during childhood and old age are often excluded because they are more strongly affected by other types of errors of reporting than by preference for specific terminal digits
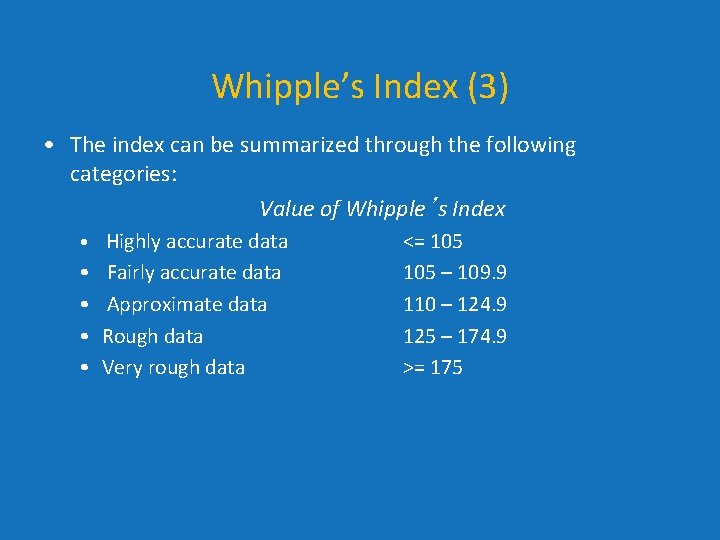
Whipple’s Index (3) • The index can be summarized through the following categories: Value of Whipple’s Index • Highly accurate data • • Fairly accurate data Approximate data Rough data Very rough data <= 105 – 109. 9 110 – 124. 9 125 – 174. 9 >= 175
Whipple’s Index Around the World Source: United Nations Demographic Yearbook
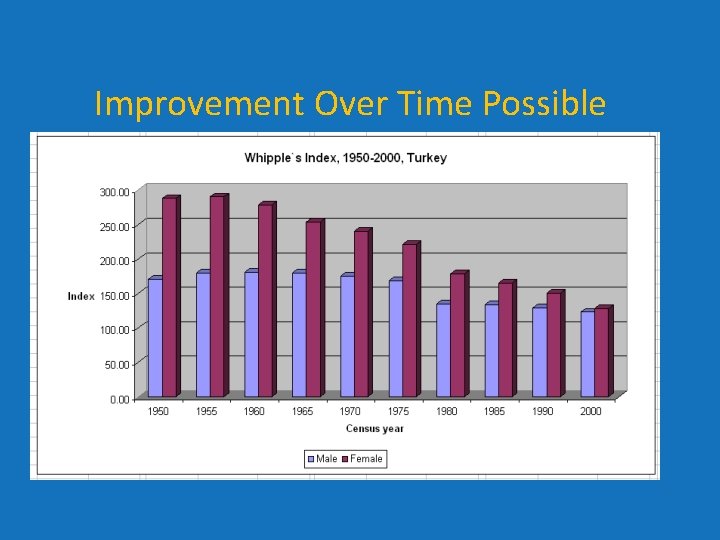
Improvement Over Time Possible
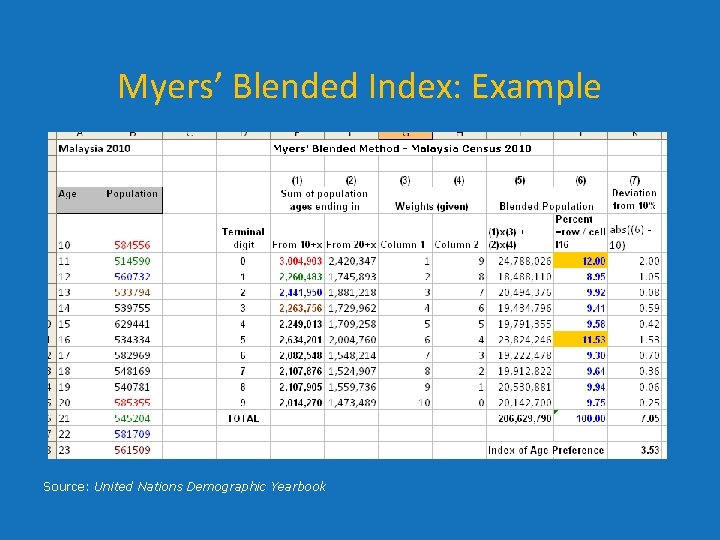
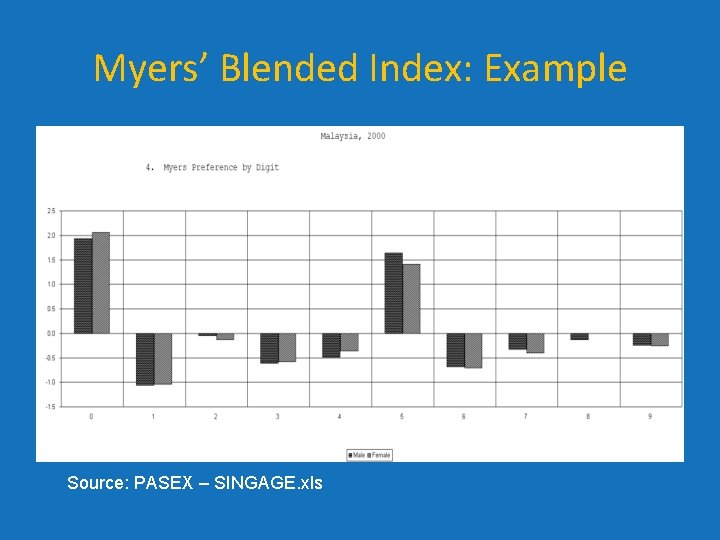
Summary Indices – Myers’ Blended Index • Conceptually similar to Whipple’s index, except that the index considers preference (or avoidance) of age ending in each of the digits 0 to 9 in deriving overall age accuracy score • The theoretical range of Myers’ Index is from 0 to 90, where 0 indicates no age heaping and 90 indicates the extreme case where all recorded ages end in the same digit
Myers’ Blended Index: Example Source: United Nations Demographic Yearbook
Myers’ Blended Index: Example Source: PASEX – SINGAGE. xls
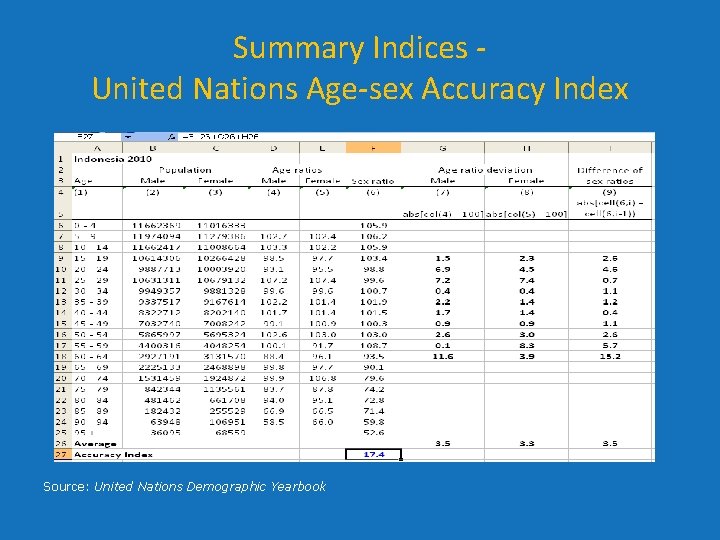
Summary Indices United Nations Age-sex Accuracy Index Source: United Nations Demographic Yearbook
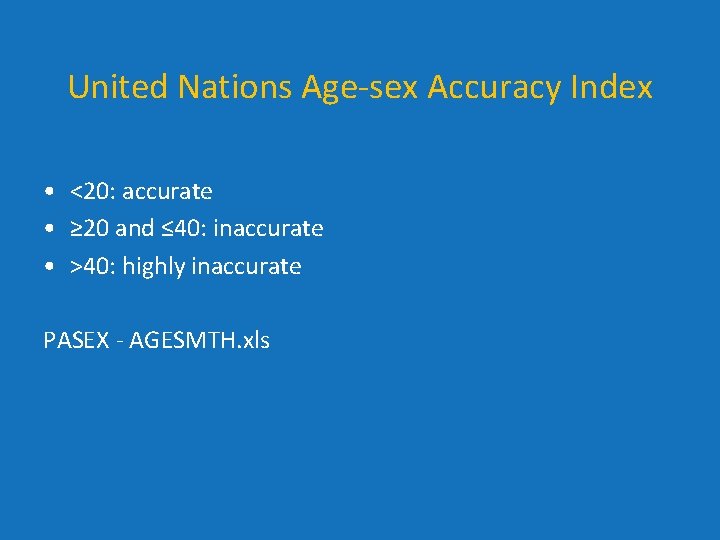
United Nations Age-sex Accuracy Index • <20: accurate • ≥ 20 and ≤ 40: inaccurate • >40: highly inaccurate PASEX - AGESMTH. xls
A Few Points about Assessment • Typically the first step in evaluating a census by demographic methods • Quick and inexpensive on general quality of data • Providing some evidence of error on specific segments of the population • Limitations • Can only provide some indication of errors but not on the magnitude • Needs to work with other assessment methods
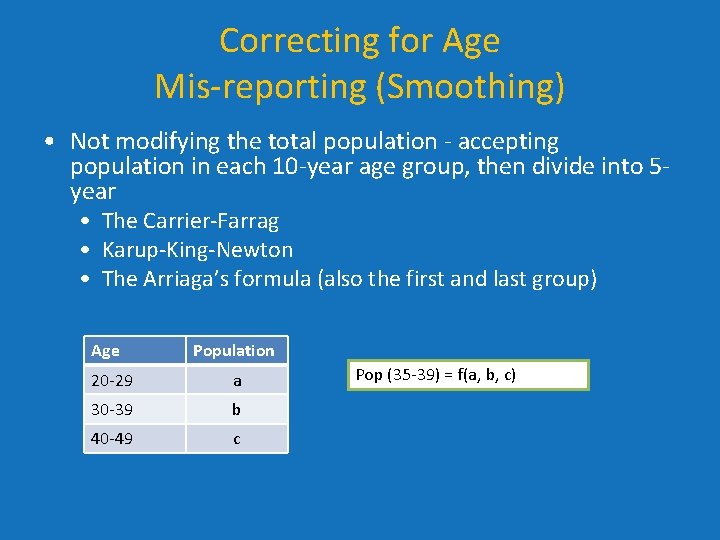
Correcting for Age Mis-reporting (Smoothing) • Not modifying the total population - accepting population in each 10 -year age group, then divide into 5 year • The Carrier-Farrag • Karup-King-Newton • The Arriaga’s formula (also the first and last group) Age Population 20 -29 a 30 -39 b 40 -49 c Pop (35 -39) = f(a, b, c)
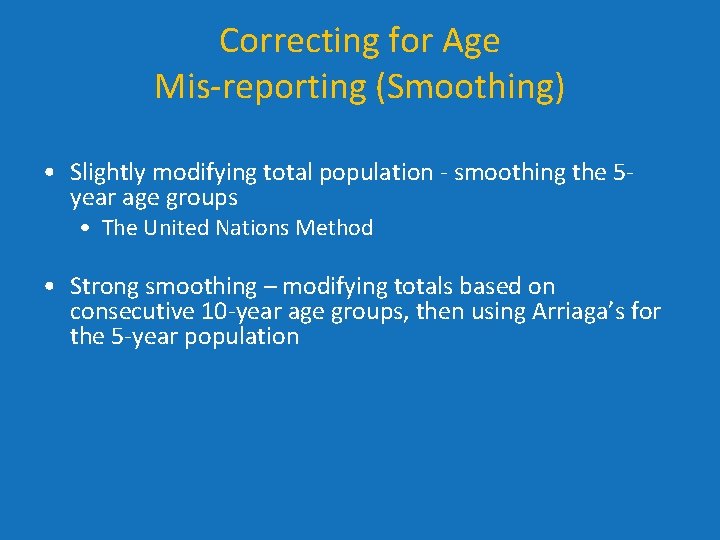
Correcting for Age Mis-reporting (Smoothing) • Slightly modifying total population - smoothing the 5 year age groups • The United Nations Method • Strong smoothing – modifying totals based on consecutive 10 -year age groups, then using Arriaga’s for the 5 -year population
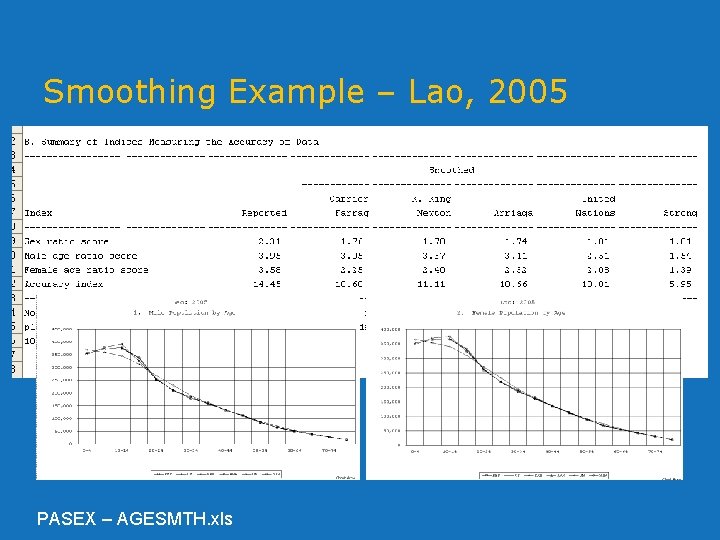
Smoothing Example – Lao, 2005 PASEX – AGESMTH. xls
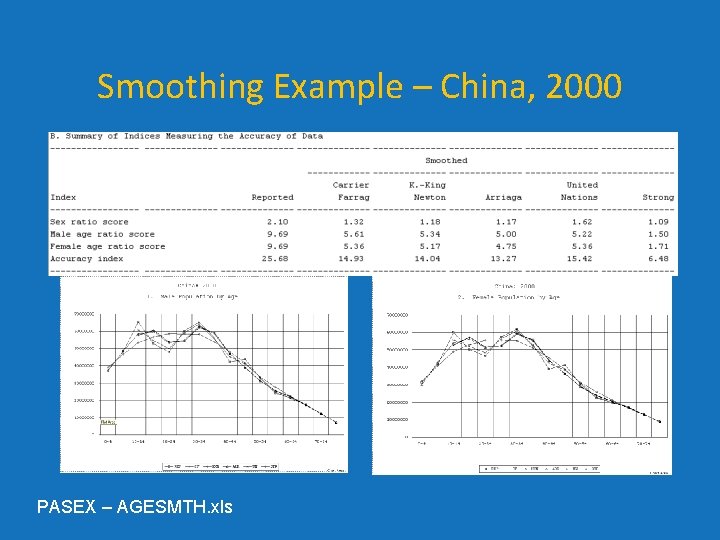
Smoothing Example – China, 2000 PASEX – AGESMTH. xls
A Few Points about Smoothing • • • No generalized solution for all populations Methods produce similar results Technique used depends on errors in age-sex distribution Be cautious in using strong smoothing If only part of population distribution problematic, no need for smoothing on entire age distribution
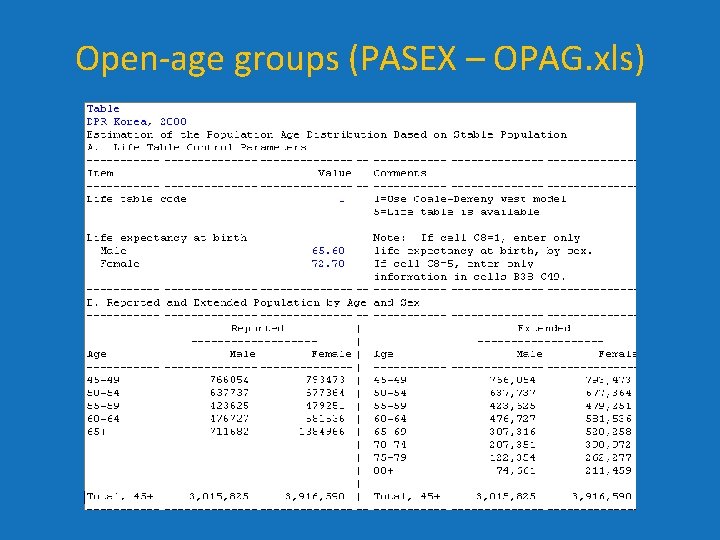
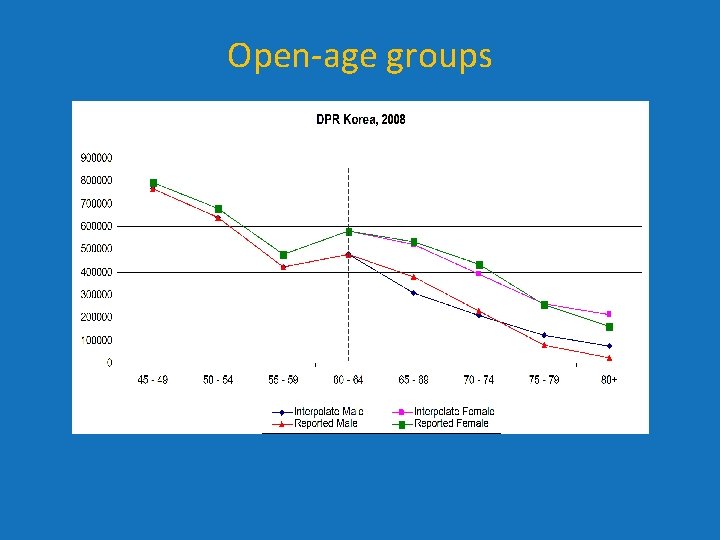
Open-age groups • When terminal age group is too young (younger than 80+ years) • How to break the terminal age groups? • Contingency table – national data available for 80+ but not subnational • Stable population theory – work for any data; needs some guesses on mortality level
Open-age groups (PASEX – OPAG. xls)
Open-age groups
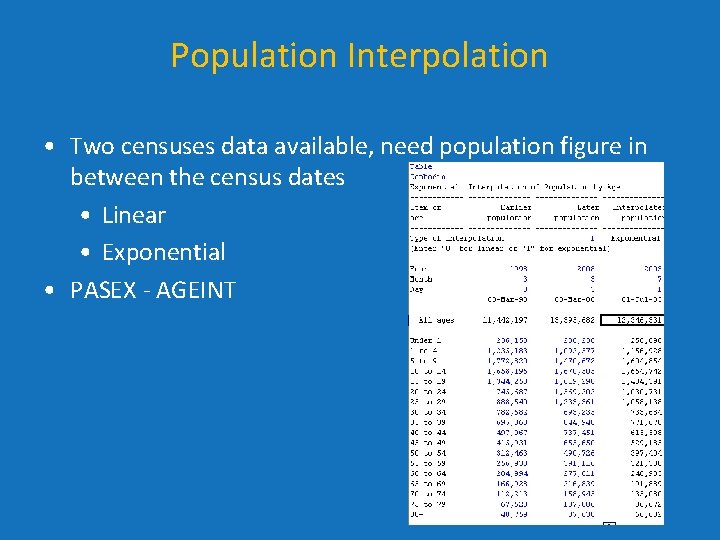
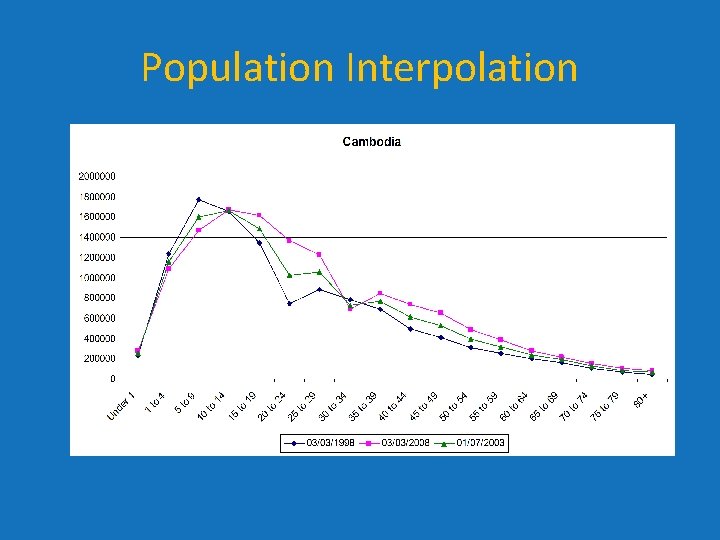
Population Interpolation • Two censuses data available, need population figure in between the census dates • Linear • Exponential • PASEX - AGEINT
Population Interpolation
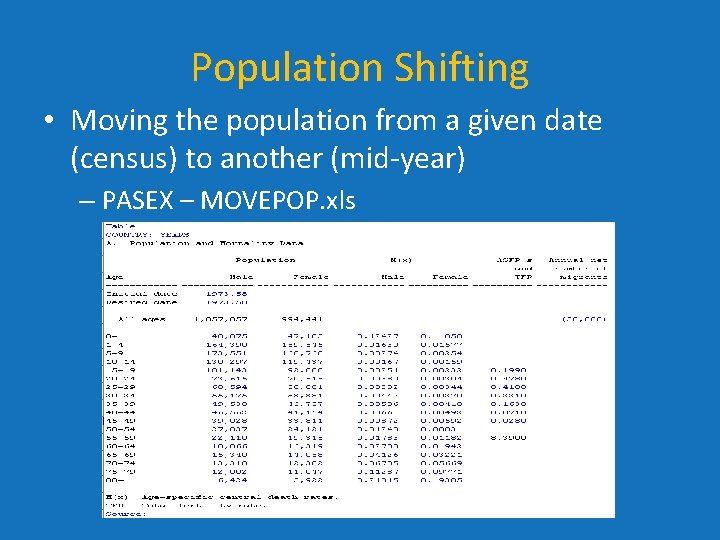
Population Shifting • Moving the population from a given date (census) to another (mid-year) – PASEX – MOVEPOP. xls
References • Arriaga (1994). Population Analysis with Microcomputers, Volume I: Presentation of Techniques, Bureau of the Census. • Hobbs, F. B. (2004). Age and Sex Composition. In J. S. Siegel & D. A. Swanson (Eds. ), The methods and materials of demography (2 nd ed. , pp. 125– 173). Elsevier Academic Press.