IMOs work on prevention of air pollution and




- Slides: 53
IMO’s work on prevention of air pollution and control of GHG emissions from ships Adoption of mandatory Energy Efficiency measures for ships Eivind S. Vagslid Technical Adviser to the Secretary-General’s Office IMO Visit to IMO by Norwegian Shipping Forum London 18 October 2012
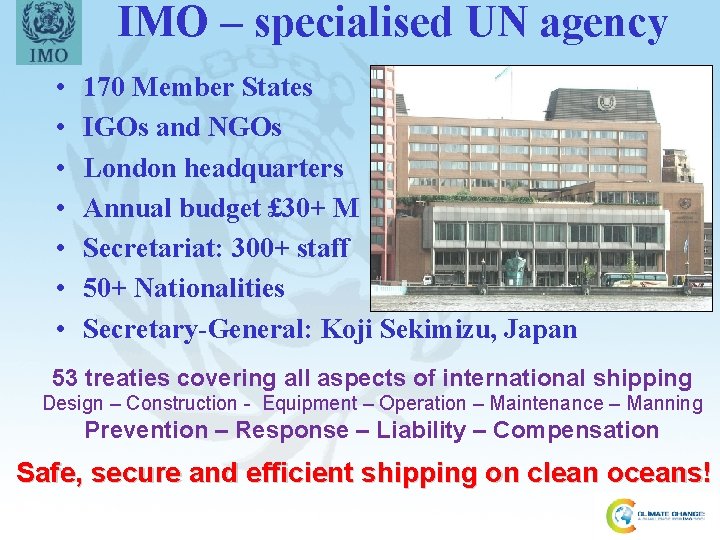
IMO – specialised UN agency • • 170 Member States IGOs and NGOs London headquarters Annual budget £ 30+ M Secretariat: 300+ staff 50+ Nationalities Secretary-General: Koji Sekimizu, Japan 53 treaties covering all aspects of international shipping Design – Construction - Equipment – Operation – Maintenance – Manning Prevention – Response – Liability – Compensation Safe, secure and efficient shipping on clean oceans! 2
Progress of measures at IMO - example Incident Idea, development Development of draft Regulation, circular, Code or resolution Proposal to IMO Committee Discussion, refer to Sub-Committee, Working Group Adoption of new regulation 3
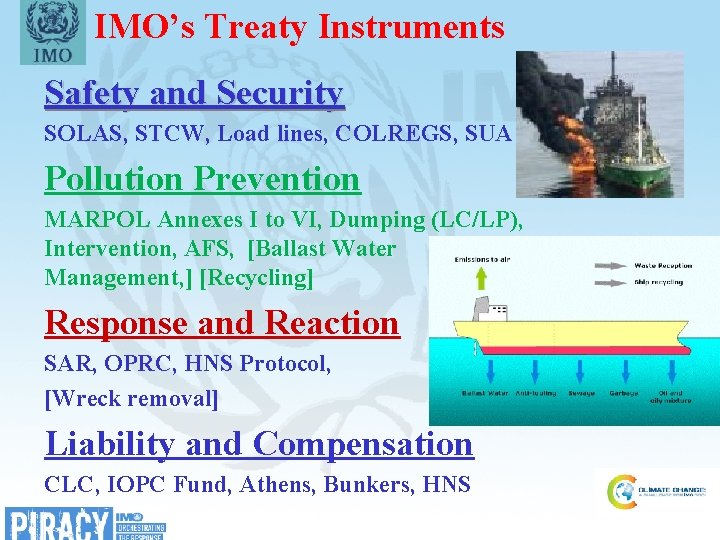
IMO’s Treaty Instruments Safety and Security SOLAS, STCW, Load lines, COLREGS, SUA Pollution Prevention MARPOL Annexes I to VI, Dumping (LC/LP), Intervention, AFS, [Ballast Water Management, ] [Recycling] Response and Reaction SAR, OPRC, HNS Protocol, [Wreck removal] Liability and Compensation CLC, IOPC Fund, Athens, Bunkers, HNS 4
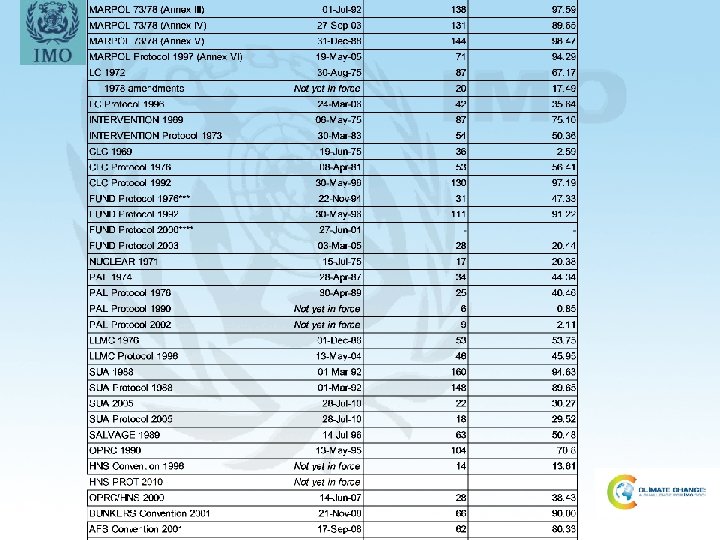
IMO’s Treaty Instruments Instrument No. of Contracting Date of entry into force States / Parties IMO Convention 17 -Mar-58 SOLAS 1974 25 -May-80 SOLAS Protocol 1978 01 -May-81 SOLAS Protocol 1988 03 -Feb-00 Stockholm Agreement 1996 01 -Apr-97 LL 1966 21 -Jul-68 LL Protocol 1988 03 -Feb-00 TONNAGE 1969 18 -Jul-82 COLREG 1972 15 -Jul-77 CSC 1972 06 -Sep-77 1993 amendments Not yet in force SFV Protocol 1993 Not yet in force STCW 1978 28 -Apr-84 STCW-F 1995 29 -Sep-12 SAR 1979 22 -Jun-85 STP 1971 02 -Jan-74 SPACE STP 1973 02 -Jun-77 IMSO 1976 Convention 16 -Jul-79 1998 amendments 31 -Jul-01 Not yet in 2008 amendments** force** FAL 1965 05 -Mar-67 % world tonnage* 170 162 117 103 97. 16 99. 20 96. 86 95. 67 11 161 98 152 155 78 9 17 156 15 103 17 16 97 40 8. 59 99. 19 95. 96 99. 06 98. 71 60. 95 6. 18 19. 78 99. 22 4. 75 62. 45 23. 98 23. 33 94. 92 26. 91 10 115 3. 65 90. 77 5
6
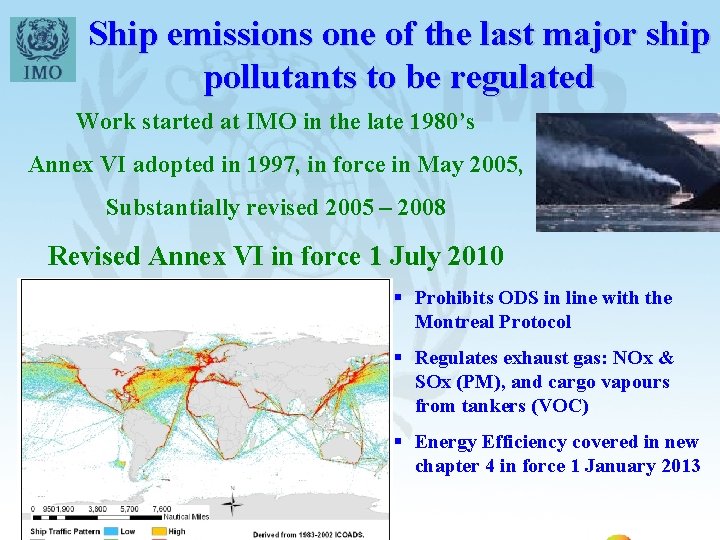
Ship emissions one of the last major ship pollutants to be regulated Work started at IMO in the late 1980’s Annex VI adopted in 1997, in force in May 2005, Substantially revised 2005 – 2008 Revised Annex VI in force 1 July 2010 § Prohibits ODS in line with the Montreal Protocol § Regulates exhaust gas: NOx & SOx (PM), and cargo vapours from tankers (VOC) § Energy Efficiency covered in new chapter 4 in force 1 January 2013
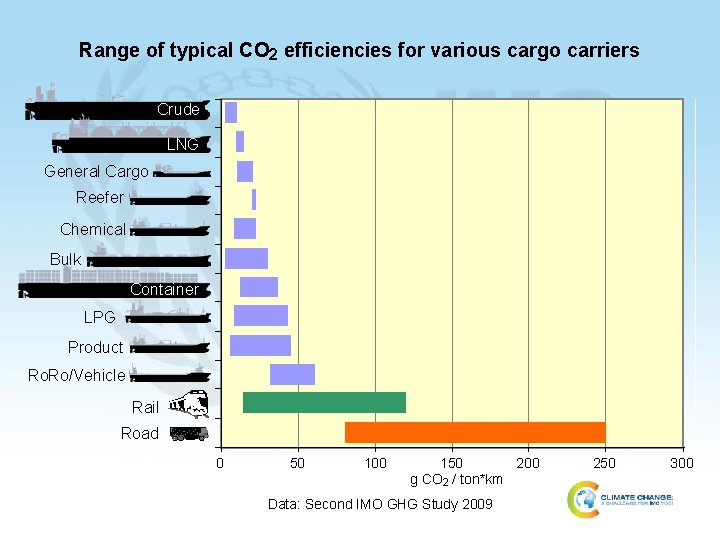
Range of typical CO 2 efficiencies for various cargo carriers Crude LNG General Cargo Reefer Chemical Bulk Container LPG Product Ro. Ro/Vehicle Rail Road 0 50 100 150 200 g CO 2 / ton*km Data: Second IMO GHG Study 2009 250 300
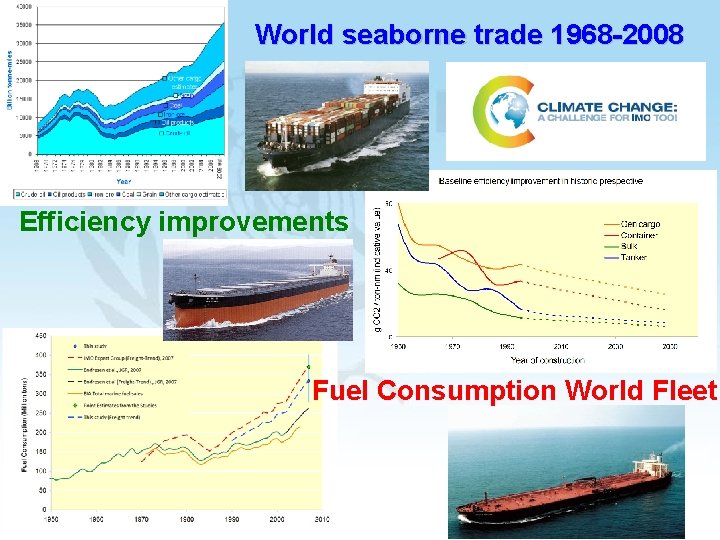
World seaborne trade 1968 -2008 Efficiency improvements Fuel Consumption World Fleet Source: Fearnley's Review
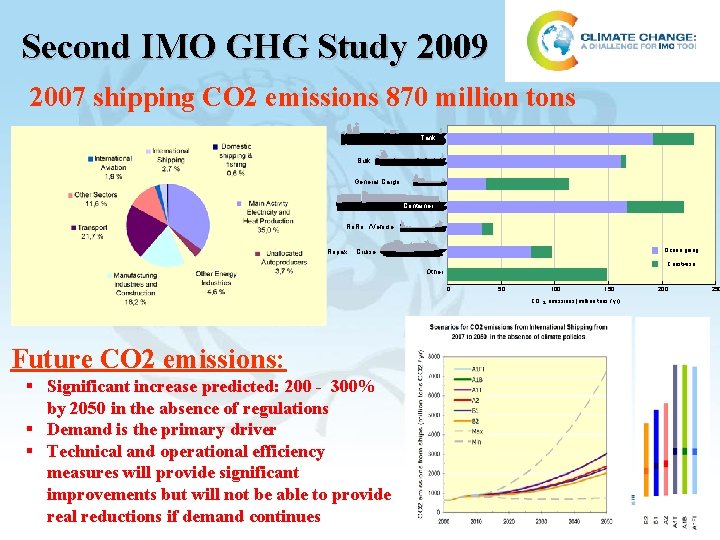
Second IMO GHG Study 2009 2007 shipping CO 2 emissions 870 million tons Tank Bulk General Cargo Container Ro. Ro /Vehicle Ropax Deep sea ships Ocean going Cruise Regional ships Coastwise Other 0 50 100 150 CO 2 emissions (million tons / yr) Future CO 2 emissions: § Significant increase predicted: 200 - 300% by 2050 in the absence of regulations § Demand is the primary driver § Technical and operational efficiency measures will provide significant improvements but will not be able to provide real reductions if demand continues 200 250
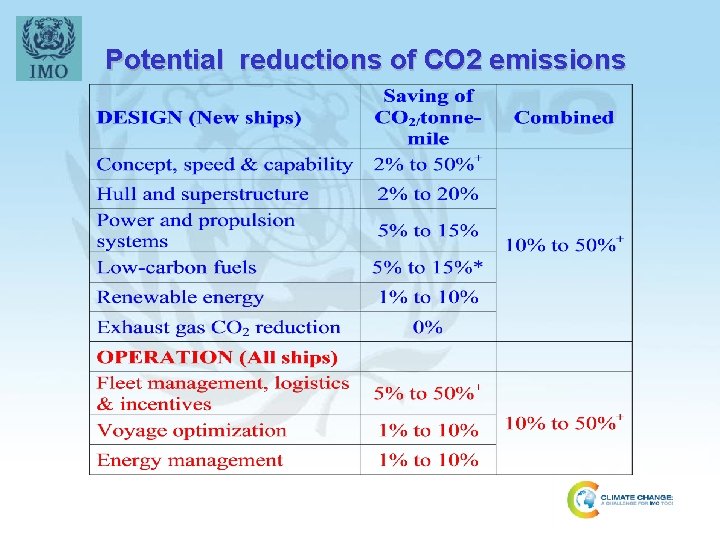
Potential reductions of CO 2 emissions
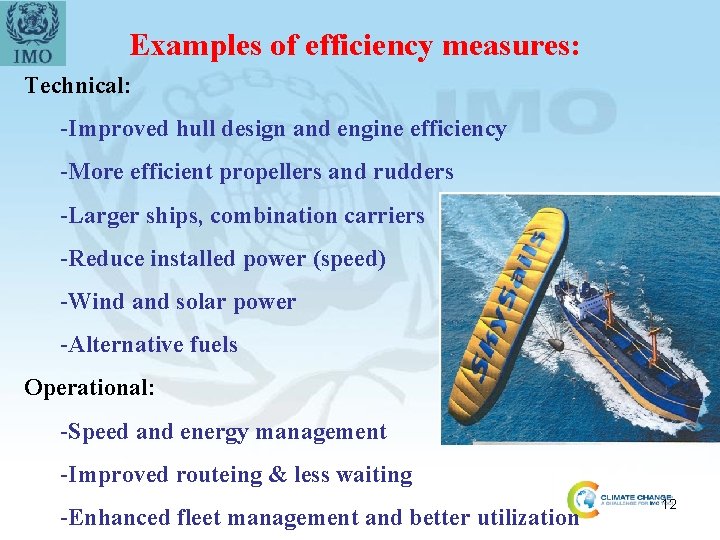
Examples of efficiency measures: Technical: -Improved hull design and engine efficiency -More efficient propellers and rudders -Larger ships, combination carriers -Reduce installed power (speed) -Wind and solar power -Alternative fuels Operational: -Speed and energy management -Improved routeing & less waiting -Enhanced fleet management and better utilization 12
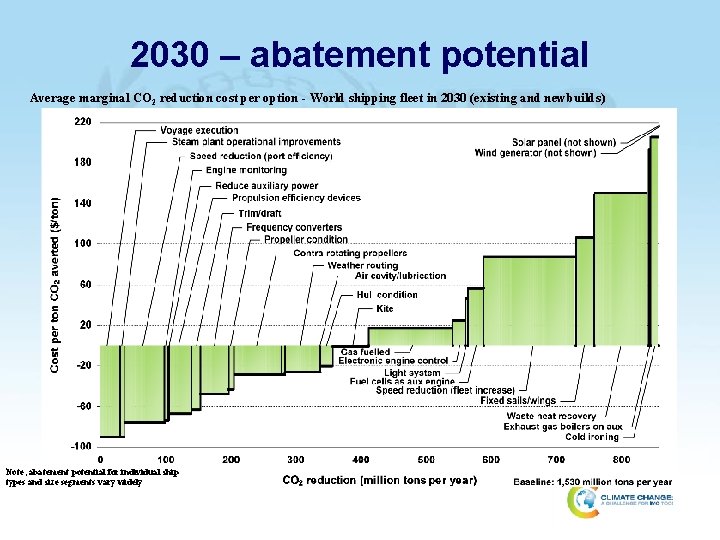
2030 – abatement potential Average marginal CO 2 reduction cost per option - World shipping fleet in 2030 (existing and newbuilds) Note; abatement potential for individual ship types and size segments vary widely
IMO’s work on GHG control and Energy efficiency Work on air pollution prevention from late 1980 s In 1991 IMO’s Assembly called for the development of MARPOL Annex VI The 1997 MARPOL Conference’s on Annex VI called for GHG action by IMO First IMO GHG Study published in 2000 (1. 8% - rapid and massive growth) IMO’s GHG policy adopted by Assembly 23 in December 2003 (res. 963(23)) Development of T&O measures, including EEOI, EEDI, SEEMP: 2000 – 2009 Voluntary application and testing by administrations and industry: (2005) 2009 ---Basic principles adopted by MEPC 57 (April 2008) Regulatory text developed 2009 – 2011: Adoption of new chapter 4 to MARPOL Annex VI: mandatory T&O measures Second IMO GHG Study 2009 published (2. 7%, significant reduction potential) Development of an MBM from 2007, Expert Group reported in 2010 Technical - mainly applicable to new ships – EEDI Operational - applicable to all ships in operation – SEEMP and EEOI Market-based Measures (MBM) – carbon price for shipping, offsetting, incentive, may generate funds
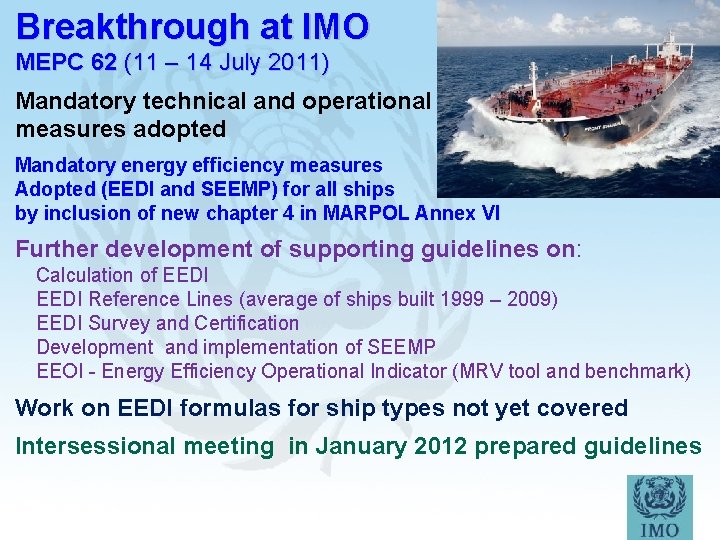
Breakthrough at IMO MEPC 62 (11 – 14 July 2011) Mandatory technical and operational measures adopted Mandatory energy efficiency measures Adopted (EEDI and SEEMP) for all ships by inclusion of new chapter 4 in MARPOL Annex VI Further development of supporting guidelines on: Calculation of EEDI Reference Lines (average of ships built 1999 – 2009) EEDI Survey and Certification Development and implementation of SEEMP EEOI - Energy Efficiency Operational Indicator (MRV tool and benchmark) Work on EEDI formulas for ship types not yet covered Intersessional meeting in January 2012 prepared guidelines
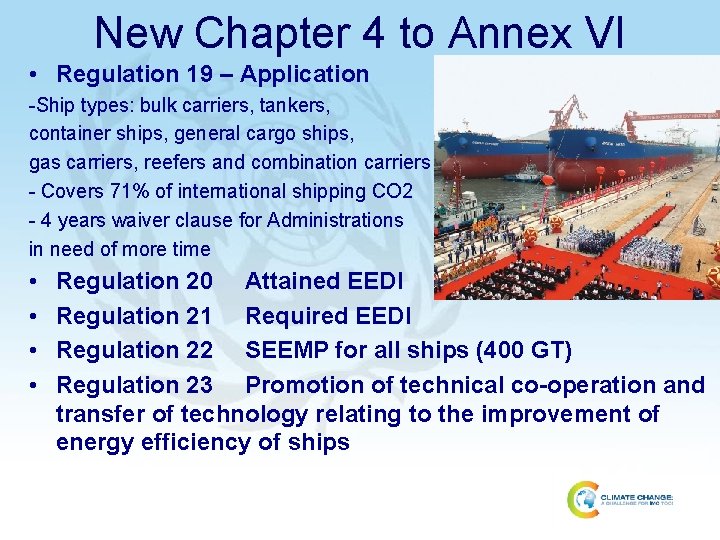
New Chapter 4 to Annex VI • Regulation 19 – Application -Ship types: bulk carriers, tankers, container ships, general cargo ships, gas carriers, reefers and combination carriers - Covers 71% of international shipping CO 2 - 4 years waiver clause for Administrations in need of more time • • Regulation 20 Attained EEDI Regulation 21 Required EEDI Regulation 22 SEEMP for all ships (400 GT) Regulation 23 Promotion of technical co-operation and transfer of technology relating to the improvement of energy efficiency of ships
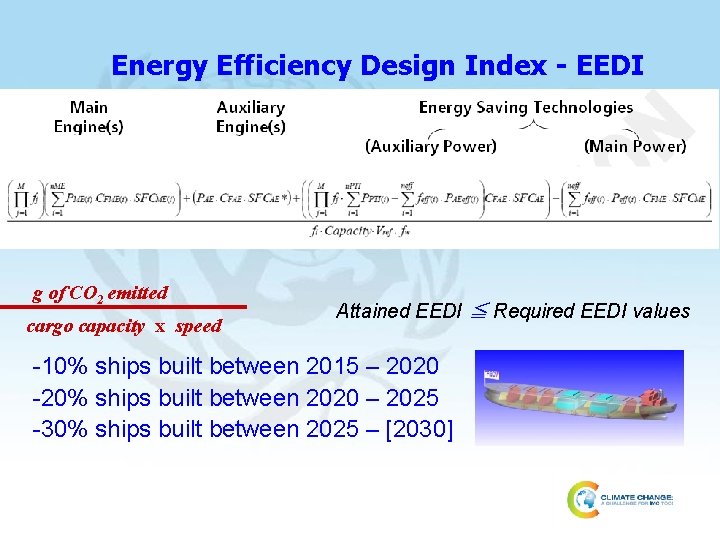
Energy Efficiency Design Index - EEDI g of CO 2 emitted cargo capacity x speed Attained EEDI ≦ Required EEDI values -10% ships built between 2015 – 2020 -20% ships built between 2020 – 2025 -30% ships built between 2025 – [2030]
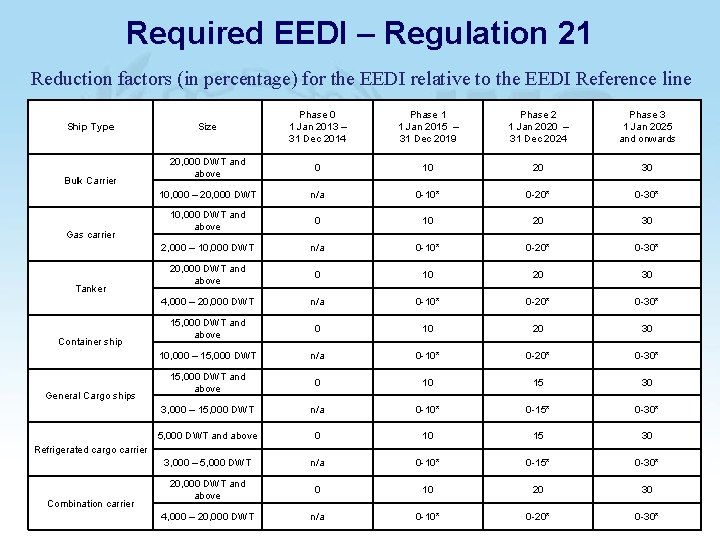
Required EEDI – Regulation 21 Reduction factors (in percentage) for the EEDI relative to the EEDI Reference line Ship Type Bulk Carrier Gas carrier Tanker Container ship General Cargo ships Size Phase 0 1 Jan 2013 – 31 Dec 2014 Phase 1 1 Jan 2015 – 31 Dec 2019 Phase 2 1 Jan 2020 – 31 Dec 2024 Phase 3 1 Jan 2025 and onwards 20, 000 DWT and above 0 10 20 30 10, 000 – 20, 000 DWT n/a 0 -10* 0 -20* 0 -30* 10, 000 DWT and above 0 10 20 30 2, 000 – 10, 000 DWT n/a 0 -10* 0 -20* 0 -30* 20, 000 DWT and above 0 10 20 30 4, 000 – 20, 000 DWT n/a 0 -10* 0 -20* 0 -30* 15, 000 DWT and above 0 10 20 30 10, 000 – 15, 000 DWT n/a 0 -10* 0 -20* 0 -30* 15, 000 DWT and above 0 10 15 30 3, 000 – 15, 000 DWT n/a 0 -10* 0 -15* 0 -30* 5, 000 DWT and above 0 10 15 30 3, 000 – 5, 000 DWT n/a 0 -10* 0 -15* 0 -30* 20, 000 DWT and above 0 10 20 30 4, 000 – 20, 000 DWT n/a 0 -10* 0 -20* 0 -30* Refrigerated cargo carrier Combination carrier
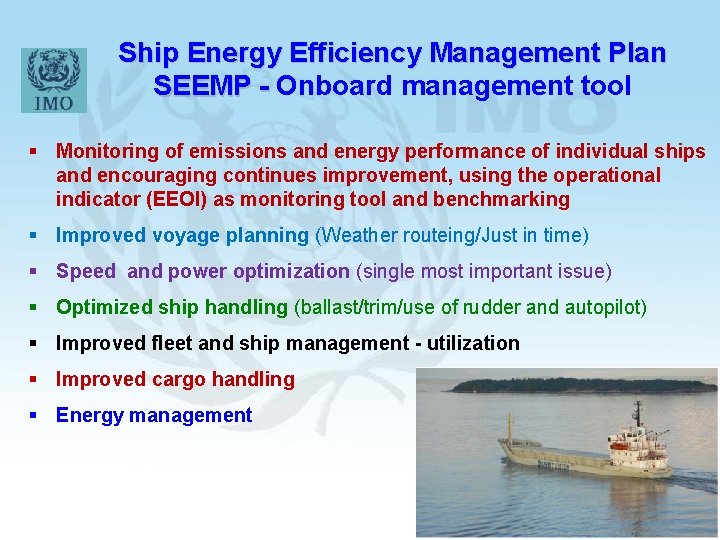
Ship Energy Efficiency Management Plan SEEMP - Onboard management tool SEEMP § Monitoring of emissions and energy performance of individual ships and encouraging continues improvement, using the operational indicator (EEOI) as monitoring tool and benchmarking § Improved voyage planning (Weather routeing/Just in time) § Speed and power optimization (single most important issue) § Optimized ship handling (ballast/trim/use of rudder and autopilot) § Improved fleet and ship management - utilization § Improved cargo handling § Energy management 19
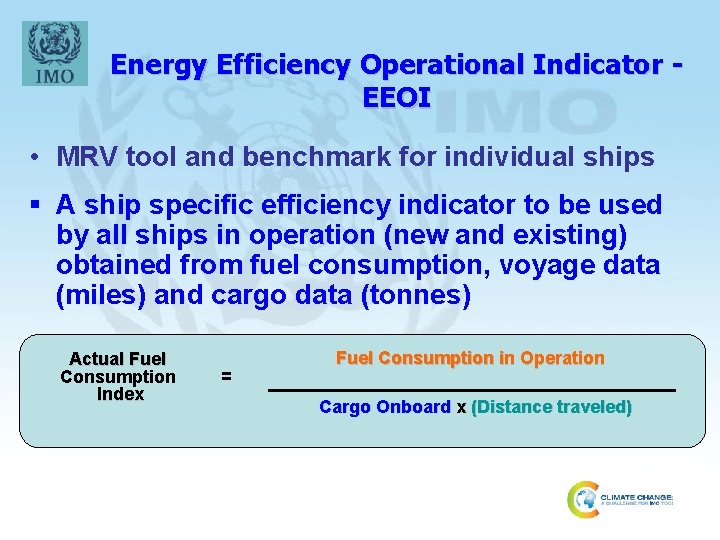
Energy Efficiency Operational Indicator EEOI • MRV tool and benchmark for individual ships § A ship specific efficiency indicator to be used by all ships in operation (new and existing) obtained from fuel consumption, voyage data (miles) and cargo data (tonnes) Actual Fuel Consumption Index = Fuel Consumption in Operation Cargo Onboard x (Distance traveled)
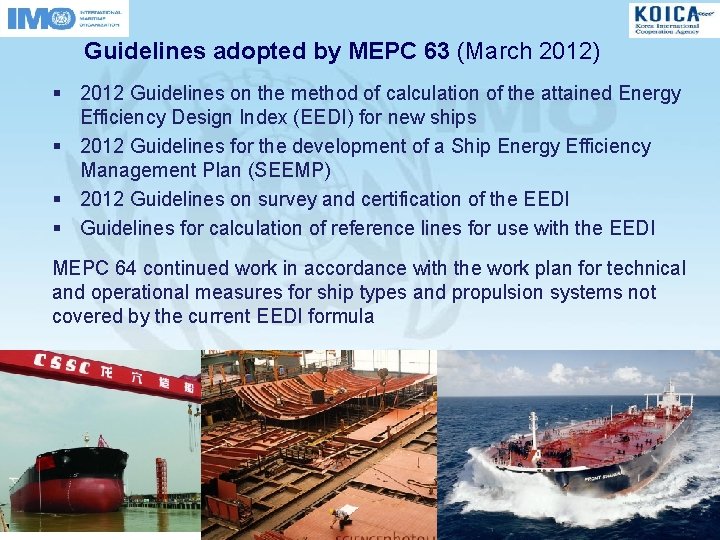
Guidelines adopted by MEPC 63 (March 2012) § 2012 Guidelines on the method of calculation of the attained Energy Efficiency Design Index (EEDI) for new ships § 2012 Guidelines for the development of a Ship Energy Efficiency Management Plan (SEEMP) § 2012 Guidelines on survey and certification of the EEDI § Guidelines for calculation of reference lines for use with the EEDI MEPC 64 continued work in accordance with the work plan for technical and operational measures for ship types and propulsion systems not covered by the current EEDI formula
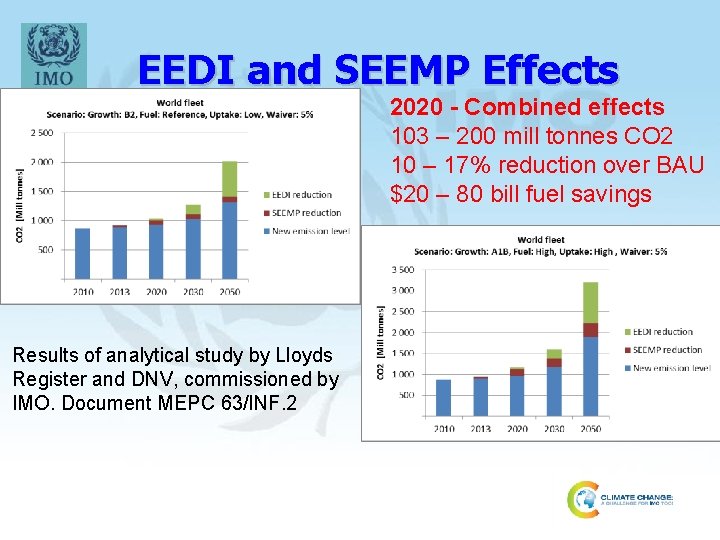
EEDI and SEEMP Effects 2020 - Combined effects 103 – 200 mill tonnes CO 2 10 – 17% reduction over BAU $20 – 80 bill fuel savings Results of analytical study by Lloyds Register and DNV, commissioned by IMO. Document MEPC 63/INF. 2
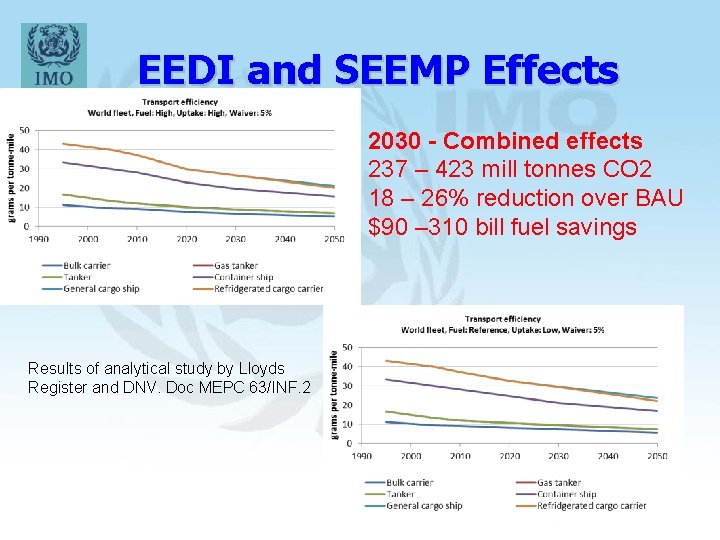
EEDI and SEEMP Effects 2030 - Combined effects 237 – 423 mill tonnes CO 2 18 – 26% reduction over BAU $90 – 310 bill fuel savings Results of analytical study by Lloyds Register and DNV. Doc MEPC 63/INF. 2
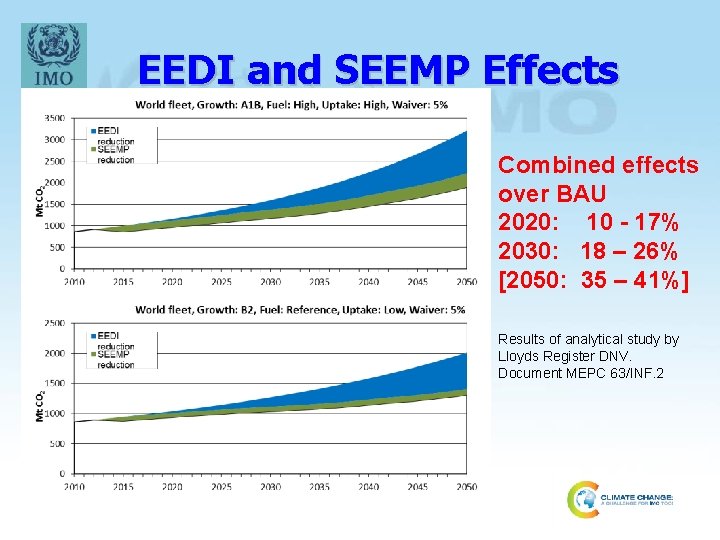
EEDI and SEEMP Effects Combined effects over BAU 2020: 10 - 17% 2030: 18 – 26% [2050: 35 – 41%] Results of analytical study by Lloyds Register DNV. Document MEPC 63/INF. 2
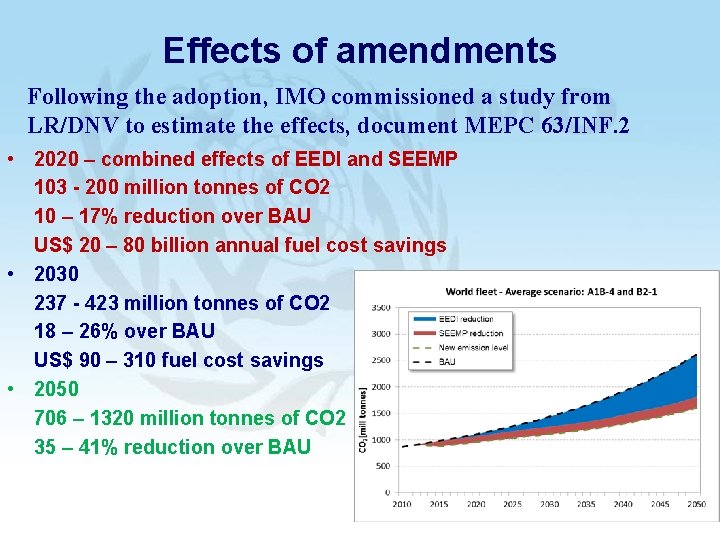
Effects of amendments Following the adoption, IMO commissioned a study from LR/DNV to estimate the effects, document MEPC 63/INF. 2 • 2020 – combined effects of EEDI and SEEMP 103 - 200 million tonnes of CO 2 10 – 17% reduction over BAU US$ 20 – 80 billion annual fuel cost savings • 2030 237 - 423 million tonnes of CO 2 18 – 26% over BAU US$ 90 – 310 fuel cost savings • 2050 706 – 1320 million tonnes of CO 2 35 – 41% reduction over BAU
Breakthrough at IMO “This is a landmark for the Organization, which has now made a positive contribution to worldwide efforts to stem climate change and, indeed, a landmark for the international community since, for the first time in history, it has been possible to legislate GHG emission reductions for an entire industry sector” E. E. Mitropoulos IMO Secretary-General “…. . this underscores the fact that IMO is best positioned to play a leadership role in addressing greenhouse gas emissions from international shipping. ” Ban Ki-Moon UN Secretary-General “I would like to congratulate IMO on this outstanding result…. The adoption of mandatory efficiency standards for international shipping is a major step and a substantial contribution…. ” Christiana Figueres UNFCCC Executive Secretary
Capacity building needs § § § Preliminary assessment presented to MEPC 61 Training of flag State and port State control officers Training of seafarers in use of new technologies Instil in the industry an energy efficiency culture IMO’s Integrated Technical Co-operation Programme for the 2012 -2013 biennium allocated funding for the first round of training activities to be undertaken before the entry into force of the amendments
Capacity building activities § § Workshops on CO 2 emissions from shipping Regional and national workshops on awareness raising and knowledge sharing to enhance global implementation and to enable States to take appropriate actions Regional and national workshops on energy efficient ship operation for ship and shore based personnel Regional and national workshops on energy efficient ship design for administrations, academia and industry Regional workshops on port State control procedures and regulations related to energy efficiency and air pollution regulations under MARPOL Annex VI
Technical Cooperation and Capacity Building activities planned for 2011 – 2013 related to EEDI and SEEMP Model course for energy efficient ship operation developed by WMU – Finalized and issued in 2011. To be used for officers training by education institutes and the industry, important for future training Capacity building: $650, 000 for training activities (e. g. EEDI verifiers) $200, 000 for fellowships and $200, 000 for workshops First awareness raising workshop in Durban 24 – 25 November Agreement with KOICA for a South East Asian Climate Capacity Building Partnership in Maritime Transport - $700. 000 for 2011 - 2013. First workshop held in Singapore 16 – 18 November 2011 A total of 12 workshops in the region 2012 – 2013 Dialog with donors for a global project: $10 – 40 millions
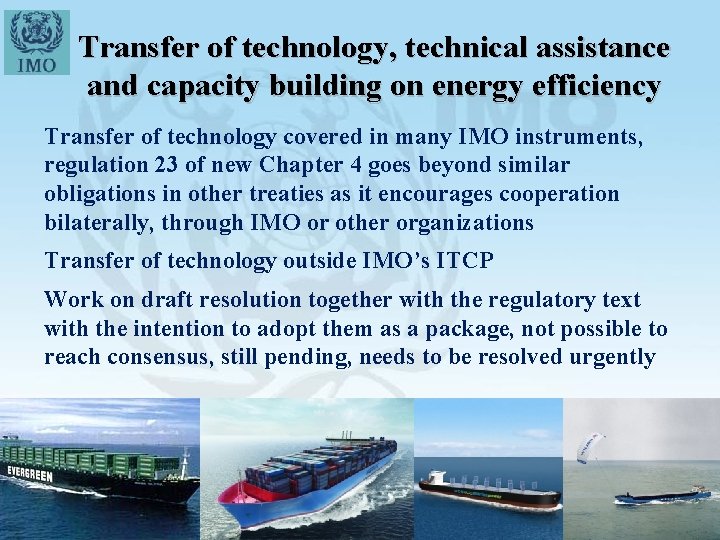
Transfer of technology, technical assistance and capacity building on energy efficiency Transfer of technology covered in many IMO instruments, regulation 23 of new Chapter 4 goes beyond similar obligations in other treaties as it encourages cooperation bilaterally, through IMO or other organizations Transfer of technology outside IMO’s ITCP Work on draft resolution together with the regulatory text with the intention to adopt them as a package, not possible to reach consensus, still pending, needs to be resolved urgently
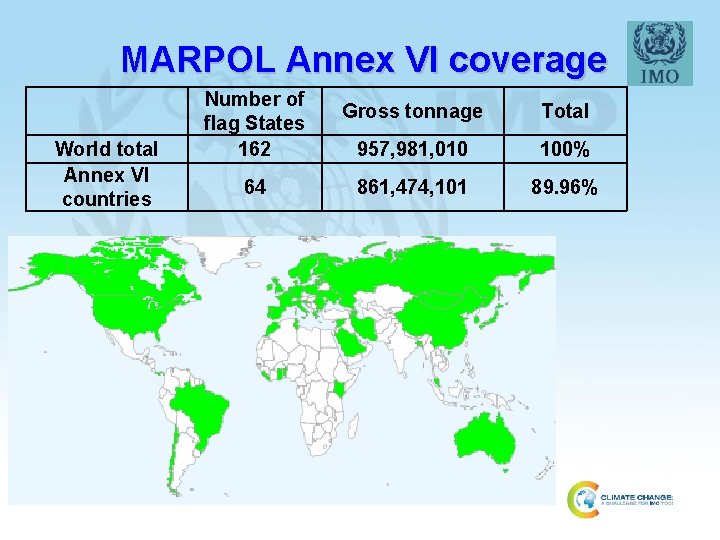
MARPOL Annex VI coverage World total Annex VI countries Number of flag States 162 64 Gross tonnage Total 957, 981, 010 100% 861, 474, 101 89. 96%
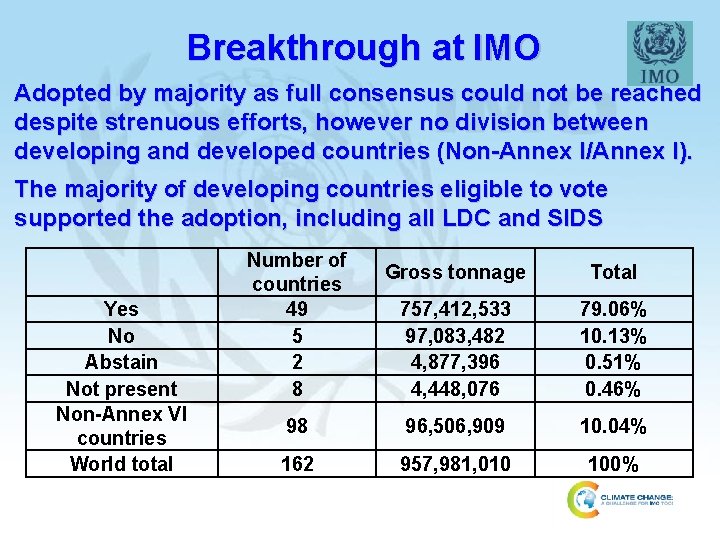
Breakthrough at IMO Adopted by majority as full consensus could not be reached despite strenuous efforts, however no division between developing and developed countries (Non-Annex I/Annex I). The majority of developing countries eligible to vote supported the adoption, including all LDC and SIDS Yes No Abstain Not present Non-Annex VI countries World total Number of countries 49 5 2 8 Gross tonnage Total 757, 412, 533 97, 083, 482 4, 877, 396 4, 448, 076 79. 06% 10. 13% 0. 51% 0. 46% 98 96, 506, 909 10. 04% 162 957, 981, 010 100%
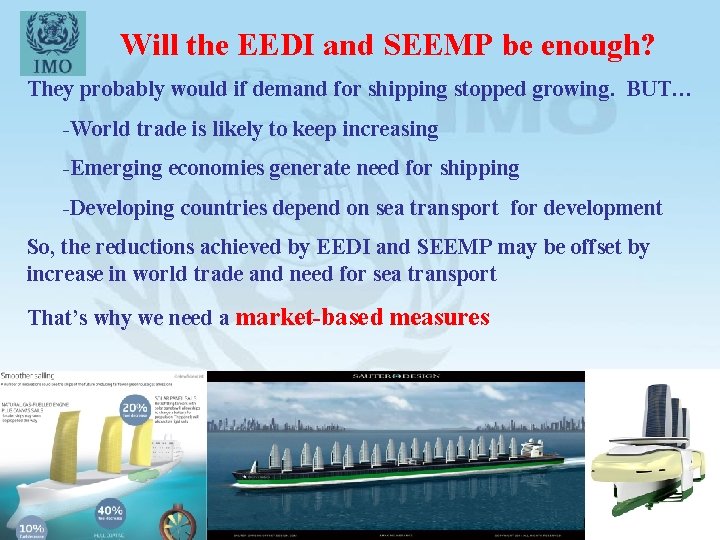
Will the EEDI and SEEMP be enough? They probably would if demand for shipping stopped growing. BUT… -World trade is likely to keep increasing -Emerging economies generate need for shipping -Developing countries depend on sea transport for development So, the reductions achieved by EEDI and SEEMP may be offset by increase in world trade and need for sea transport That’s why we need a market-based measures 33
Market-based reduction measures – MBM An MBM under IMO would serve two main purposes • An economic incentive for enhanced energy-efficient both trough design and operation (in-sector reductions) • Off-setting in other sectors (out-of-sector reduction) 10 MBM proposals by governments and NGOs under review Charges, ETS, Efficiency based, Incentive Schemes, Rebate Mechanism Three main streams: GHG Fund: Offsetting above a target line ETS: 100% auctioning (global/national) - remaining proceeds: R&D, TC, improve port/maritime infrastructure in developing countries, Climate Finance Efficiency based (EEDI): Closed trading of credits
MBM Expert Group established by MEPC 60 q The analysis of the proposed MBM addressed, inter alia: Environmental effectiveness, cost-effectiveness and potential impact on trade and sustainable development Incentives to technological change and innovation Practical feasibility and the need for technology transfer to and capacity building within developing countries, mobilizing climate financing Relation with other conventions (UNFCCC, Kyoto Protocol and WTO) and compatibility with international law and IMO’s regulatory framework Additional administrative burden and legal aspects for National Administrations The potential additional workload, economic burden and operational impact for individual ships, the shipping industry and the maritime sector
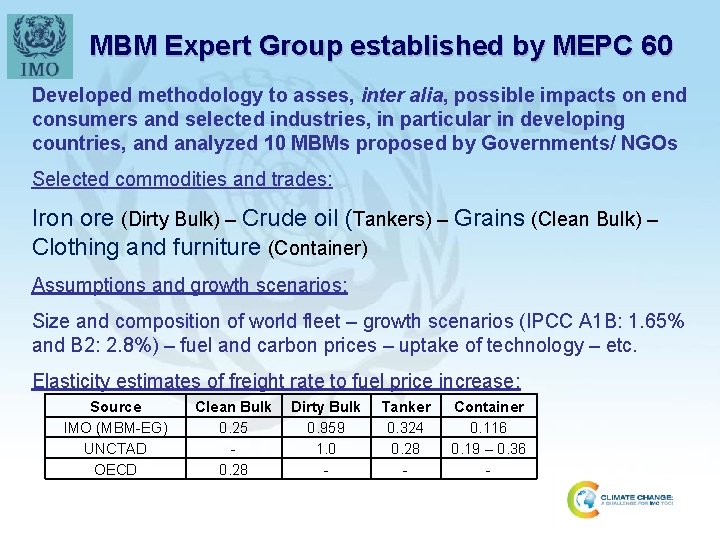
MBM Expert Group established by MEPC 60 Developed methodology to asses, inter alia, possible impacts on end consumers and selected industries, in particular in developing countries, and analyzed 10 MBMs proposed by Governments/ NGOs Selected commodities and trades: Iron ore (Dirty Bulk) – Crude oil (Tankers) – Grains (Clean Bulk) – Clothing and furniture (Container) Assumptions and growth scenarios: Size and composition of world fleet – growth scenarios (IPCC A 1 B: 1. 65% and B 2: 2. 8%) – fuel and carbon prices – uptake of technology – etc. Elasticity estimates of freight rate to fuel price increase: Source IMO (MBM-EG) UNCTAD OECD Clean Bulk 0. 25 0. 28 Dirty Bulk 0. 959 1. 0 - Tanker 0. 324 0. 28 - Container 0. 116 0. 19 – 0. 36 -
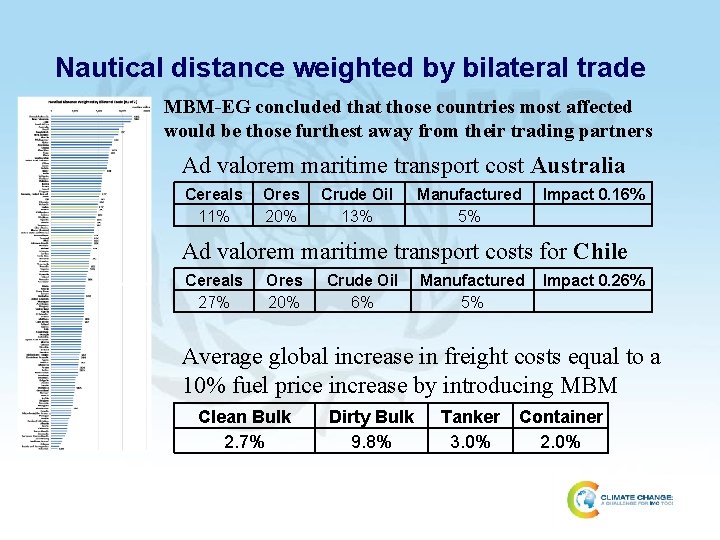
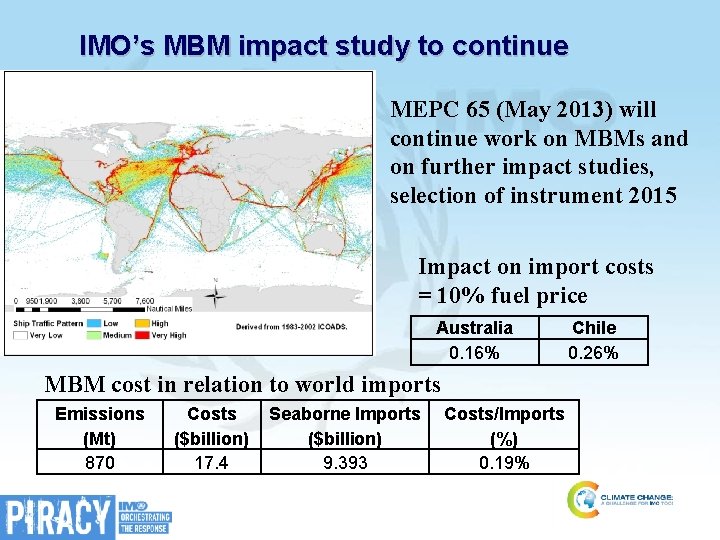
Nautical distance weighted by bilateral trade MBM-EG concluded that those countries most affected would be those furthest away from their trading partners Ad valorem maritime transport cost Australia Cereals 11% Ores 20% Crude Oil 13% Manufactured 5% Impact 0. 16% Ad valorem maritime transport costs for Chile Cereals 27% Ores 20% Crude Oil 6% Manufactured 5% Impact 0. 26% Average global increase in freight costs equal to a 10% fuel price increase by introducing MBM Clean Bulk 2. 7% Dirty Bulk 9. 8% Tanker 3. 0% Container 2. 0%
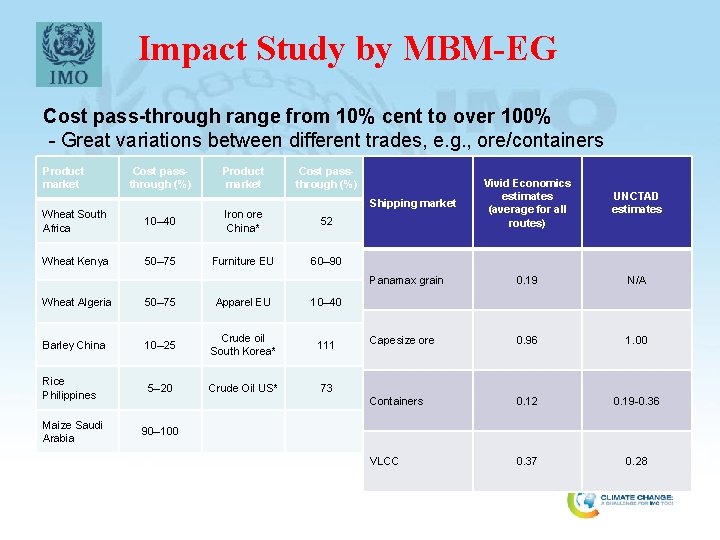
Impact Study by MBM-EG Cost pass-through range from 10% cent to over 100% - Great variations between different trades, e. g. , ore/containers Product market Cost passthrough (%) UNCTAD estimates Panamax grain 0. 19 N/A Capesize ore 0. 96 1. 00 Containers 0. 12 0. 19 -0. 36 VLCC 0. 37 0. 28 Shipping market Wheat South Africa 10– 40 Iron ore China* 52 Wheat Kenya 50– 75 Furniture EU 60– 90 Wheat Algeria 50– 75 Apparel EU 10– 40 Barley China 10– 25 Crude oil South Korea* 111 Rice Philippines 5– 20 Crude Oil US* 73 Maize Saudi Arabia Vivid Economics estimates (average for all routes) 90– 100
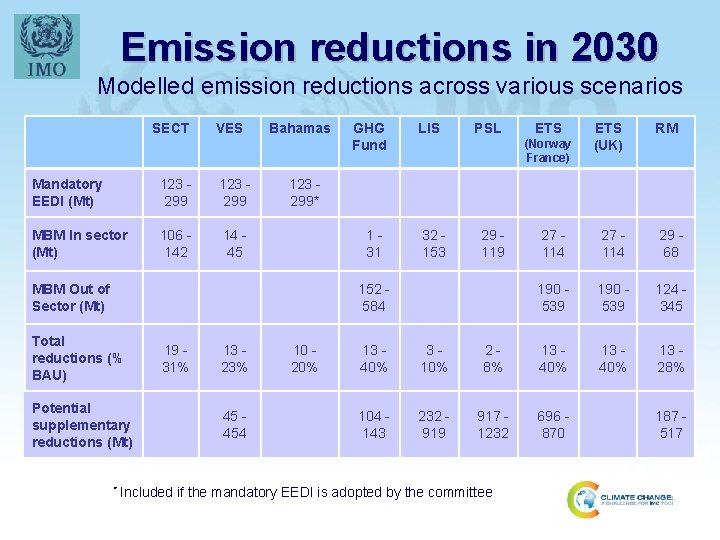
Emission reductions in 2030 Modelled emission reductions across various scenarios SECT VES Bahamas GHG Fund LIS PSL ETS (Norway France) ETS (UK) RM Mandatory EEDI (Mt) 123 299* MBM In sector (Mt) 106 142 14 45 1 31 32 153 29 119 27 114 29 68 152 584 190 539 124 345 Total reductions (% BAU) 19 31% 13 23% 10 20% 13 40% 3 10% 2 8% 13 40% 13 28% Potential supplementary reductions (Mt) 45 454 104 143 232 919 917 1232 696 870 187 517 MBM Out of Sector (Mt) * Included if the mandatory EEDI is adopted by the committee
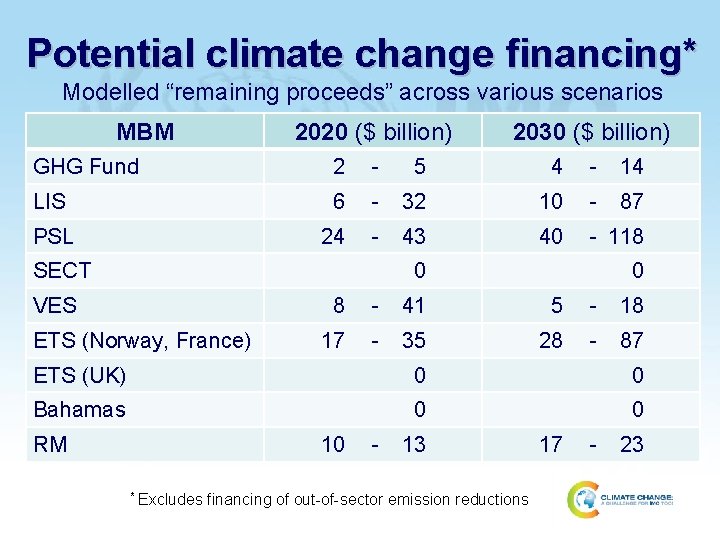
Potential climate change financing* Modelled “remaining proceeds” across various scenarios MBM 2020 ($ billion) 2030 ($ billion) GHG Fund 2 - 5 4 - 14 LIS 6 - 32 10 - 87 PSL 24 - 43 40 - 118 SECT 0 VES ETS (Norway, France) 0 8 - 41 5 - 18 17 - 35 28 - 87 ETS (UK) 0 0 Bahamas 0 0 RM 10 - 13 * Excludes financing of out-of-sector emission reductions 17 - 23
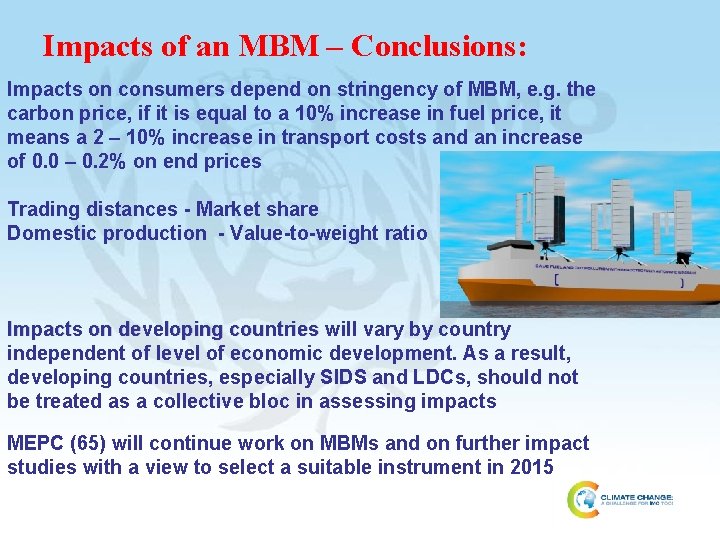
Impacts of an MBM – Conclusions: Impacts on consumers depend on stringency of MBM, e. g. the carbon price, if it is equal to a 10% increase in fuel price, it means a 2 – 10% increase in transport costs and an increase of 0. 0 – 0. 2% on end prices Trading distances - Market share Domestic production - Value-to-weight ratio Impacts on developing countries will vary by country Impacts on developing countries w independent of level of economic development. As a result, developing countries, especially SIDS and LDCs, should not be treated as a collective bloc in assessing impacts MEPC (65) will continue work on MBMs and on further impact studies with a view to select a suitable instrument in 2015
The needs and circumstances of developing countries in the context of climate finance There will be impacts from introducing and MBM, but they will be dwarfed by increases in energy and food prices Compensating affected consumers and industries cent by cent is not possible, a workable proxy is needed An MBM is intended to drive behavioural change – any compensation will undermine this purpose To use 25 – 40% of revenues to compensate all developing countries by the same key will deprive the most vulnerable countries/peoples for large climate finance opportunities A targeted approach needed where only those most affected will be compensated (threshold/GDP per capita)
IMO’s MBM impact study to continue MEPC 65 (May 2013) will continue work on MBMs and on further impact studies, selection of instrument 2015 Impact on import costs = 10% fuel price Australia 0. 16% MBM cost in relation to world imports Emissions (Mt) 870 Costs ($billion) 17. 4 Seaborne Imports ($billion) 9. 393 Costs/Imports (%) 0. 19% Chile 0. 26%
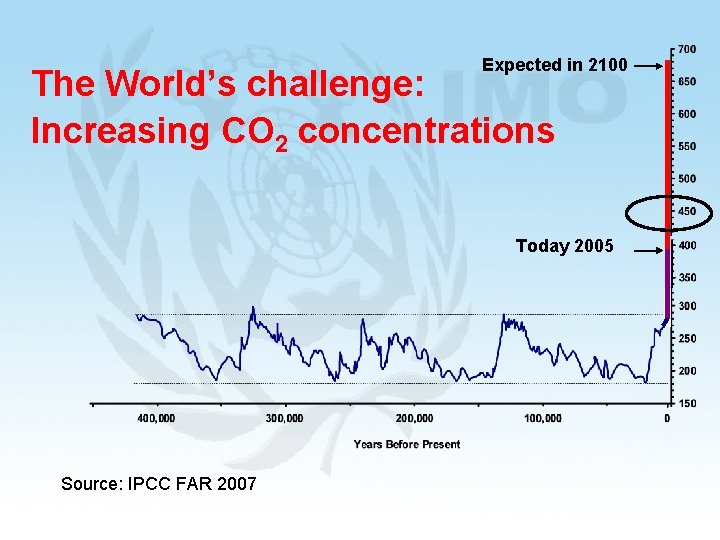
What is the consensus view of the world’s most eminent scientists? IPCC Fourth Assessment Report (FAR) - A 1ºC to 2 C increase in temperature above 1990 levels will place many unique and threatened systems, including many biodiversity hotspots, at significant risk. - A global mean temperature increase of more that 2 C will lead to increasing risk of species extinction and climate havoc -The CO 2 concentration must not exceed 450 ppm to keep the global warming within 2 C above 1990 level by 2100 To avoid this, CO 2 emissions must peak within 10 – maximum 15 years 44
Expected in 2100 The World’s challenge: Increasing CO 2 concentrations Today 2005 Source: IPCC FAR 2007
What is the world community doing? First step: Adoption of the United Nations Framework Convention on Climate Change (UNFCCC) in 1992. - Aimed at stabilizing atmospheric concentrations of greenhouse gases to avoid “dangerous anthropogenic interference” with the climate system. Second step: Adoption of the Kyoto Protocol in 1997 - Commits developed countries (Annex I Parties) to reduce their overall emissions by an average of 5. 2% below 1990 levels between 2008 -2012. Third step: Bali Action Plan – Copenhagen Accord – Cancun Agreements – Durban Platform (2011) - Universal legal treaty covering all parties, to be adopted by 2015 and in force by 2020 46
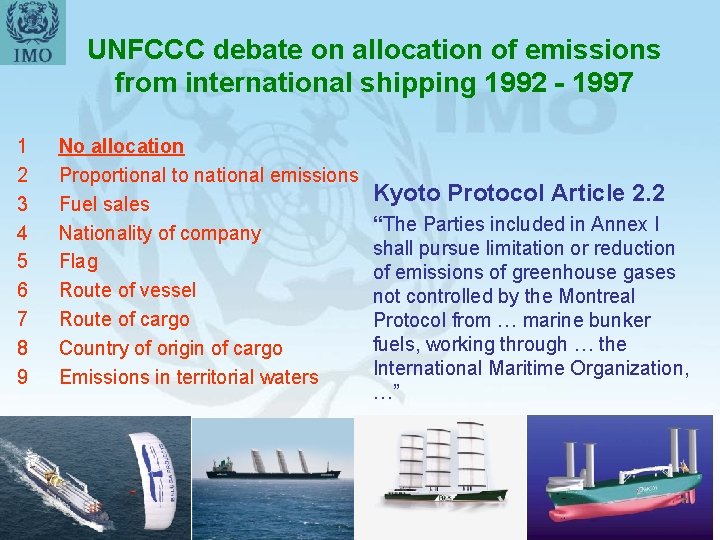
UNFCCC debate on allocation of emissions from international shipping 1992 - 1997 1 2 3 4 5 6 7 8 9 No allocation Proportional to national emissions Fuel sales Nationality of company Flag Route of vessel Route of cargo Country of origin of cargo Emissions in territorial waters Kyoto Protocol Article 2. 2 “The Parties included in Annex I shall pursue limitation or reduction of emissions of greenhouse gases not controlled by the Montreal Protocol from … marine bunker fuels, working through … the International Maritime Organization, …” 47
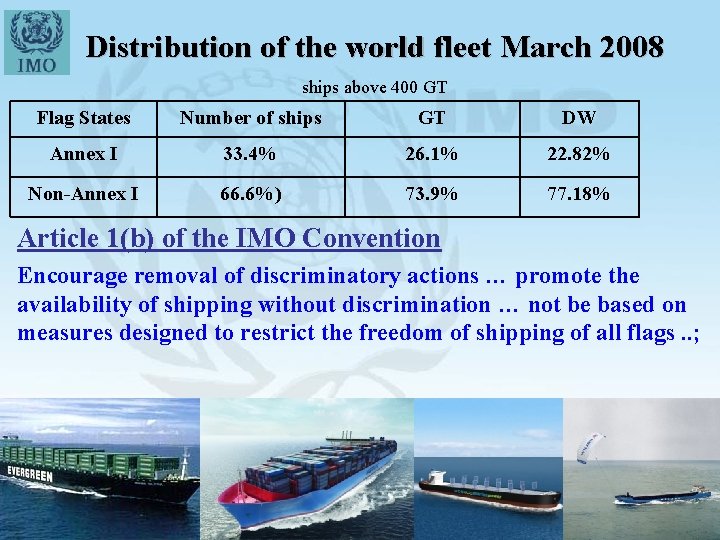
Distribution of the world fleet March 2008 ships above 400 GT Flag States Number of ships GT DW Annex I 33. 4% 26. 1% 22. 82% Non-Annex I 66. 6%) 73. 9% 77. 18% Article 1(b) of the IMO Convention Encourage removal of discriminatory actions … promote the availability of shipping without discrimination … not be based on measures designed to restrict the freedom of shipping of all flags. . ;
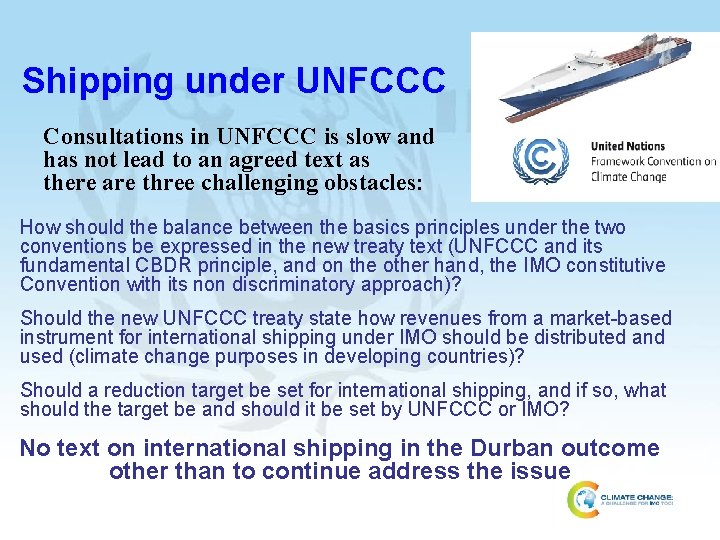
Shipping under UNFCCC Consultations in UNFCCC is slow and has not lead to an agreed text as there are three challenging obstacles: • How should the balance between the basics principles under the two conventions be expressed in the new treaty text (UNFCCC and its fundamental CBDR principle, and on the other hand, the IMO constitutive Convention with its non discriminatory approach)? • Should the new UNFCCC treaty state how revenues from a market-based instrument for international shipping under IMO should be distributed and used (climate change purposes in developing countries)? • Should a reduction target be set for international shipping, and if so, what should the target be and should it be set by UNFCCC or IMO? No text on international shipping in the Durban outcome other than to continue address the issue
Links with and effects on UNFCCC negotiations As the regulations address ships and not States, and as they do not impose any reduction obligations, quantified or otherwise, on States, as well as the fact that the cost of introducing EEDI/SEEMP will be borne by the industry, there are no incompatibility issues with UNFCCC Kyoto Protocol’s Article 2. 2 is still interpreted differently by Parties Did adoption of mandatory T&O by MEPC 62 settle the issue? Disbursement of revenues from an MBM for international shipping under IMO is seen by many as a way to accommodate both sets of principles under the two conventions: - CBDR under UNFCCC and non-discrimination under IMO An MBM for international shipping could be a predictable source to the Green Climate Fund and thereby facilitate the UNFCCC negotiations
Climate Finance under UNFCCC The Copenhagen Accord noted the need for climate finance $30 billions annually 2010 – 2019 and $100 billions annually from 2020 The AGF report highlighted international shipping as a suitable and predictable source for climate change funding. $ 3 – 8 billions from international shipping – work should continue in IMO The Cancun Agreements agreed a process to establish the Green Climate Fund which was formally established in Durban and made operational by 2012 under the World Bank, process to identify funding sources in 2012 G-20 requested WB/IMF to explore potential sources Report to be considered by Ministers of Finance early November for submission to Durban. Elaborates on possible approaches but focuses on taxation not on the combined effect of an MBM: reduction and finance
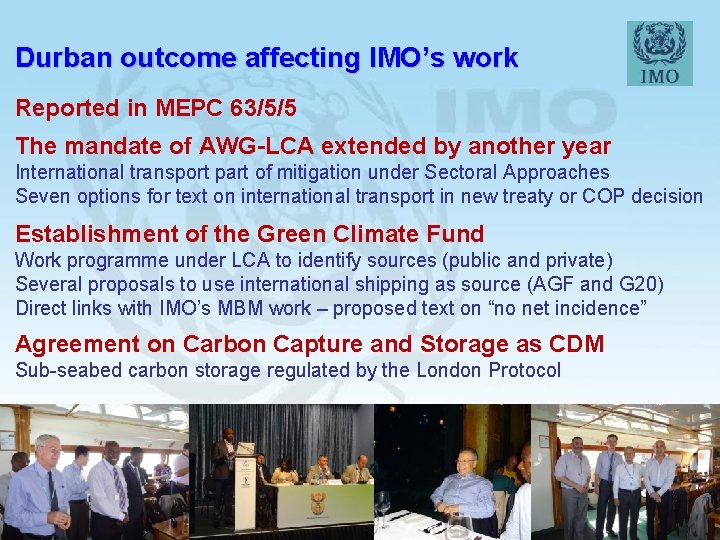
Durban outcome affecting IMO’s work Reported in MEPC 63/5/5 The mandate of AWG-LCA extended by another year International transport part of mitigation under Sectoral Approaches Seven options for text on international transport in new treaty or COP decision Establishment of the Green Climate Fund Work programme under LCA to identify sources (public and private) Several proposals to use international shipping as source (AGF and G 20) Direct links with IMO’s MBM work – proposed text on “no net incidence” Agreement on Carbon Capture and Storage as CDM Sub-seabed carbon storage regulated by the London Protocol
Summary - IMO’s GHG Work • Mandatory technical and operational measures adopted in July 2011 – in force 1 January 2013 Important step - Energy efficiency standard for new ships, operational measures for all ships - Significant reductions • MBM for international shipping under IMO Continued development - Possible adoption of treaty in 2015 • Climate Finance and the Green Climate Fund may be the key to unlock the UNFCCC/IMO deadlock Application to all ships via IMO is the only way to raise revenues from international maritime transport (precedence in IOPC) www. imo. org