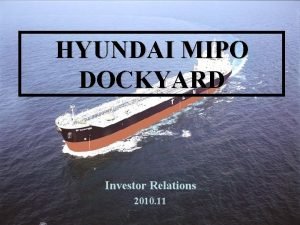
HYUNDAI MIPO DOCKYARD Investor Relations 2010 11 1


- Slides: 19

HYUNDAI MIPO DOCKYARD Investor Relations 2010. 11 1

CONTENTS I. III. IV. Overview Financial Results & Analysis Business Performance Hyundai-Vinashin Shipyard

I. Overview

Company Profile (2010. 29) Company Data Shareholder Structure • Establishment : 1975. 4. 28 • Initial share listing : 1983. 12. 20 • Shift to Shipbuilding : 1996. 01 Others • Employees : 3, 733 (as of Dec 2009) 21. 22% • Common Stock : 100 Billion Won (20 Million Shares) • Business Category: Shipbuilding Foreign Investors 30. 66% Treasury Fund 2. 05% Hyundai Samho Heavy Industries 46. 07% • Dock : No. 1~3(400 k DWT), No 4(350 k DWT) • Quay : 2. 36 Km (4 EA) • Main Product : Mid-sized PC & Container • Market Share : 27% in Mid-sized PC vessel market 1

GROUP STRUCTURE (As of October 2010) 7. 98% Hyundai Heavy Industries Shipbuilding 94. 92% 67. 49% Hyundai Samho Heavy Industries Hyundai Finance Shipbuilding Corporate finance & Investment 46. 07% Hyundai Mipo Dockyard 68. 38% Shipbuilding 55% Hyundai Vinashin Shipyard in Vietnam Ship repairing & Conversion 65. 22% Hyundai Venture Investment Hyundai Futures Investment in venture firms Financial services 100% Mipo Engineering Ship design & Engineering 83. 24% Hi Investment & Securities Business 2

II. Financial Result & Analysis

FINANCIAL HIGHLIGHTS Sales (Billions. KRW) Operating Income Ratio Net Income Ratio Liabilities-to-Equity Ratio 3

FINANCIAL Financial PERFORMANCE Performance 1. 2. Income is decreasing due to the raised steel plate price. Profit Margin is the highest among all shipbuilders in the world. (Unit: Billions of KRW) 2010. 2 Q 2010. 3 Q 2009 2008 Yo. Y 4

CAPITAL STRUCTURE 1. Liabilities to Equity Ratio Decrease (2009 : 129. 20% 2010. 2 Q : 113. 20%) (Unit: Billions of KRW) 2010. 2 Q 2009 Yo. Y 5

LONG-TERM INVESTMENT SECURITIES 1. 2. Mostly invested in Blue-Chip Stocks Increased value of investment securities (2010. 29) (Unit: Billions of KRW) Company Ownership Shares Market Value Hyundai Heavy Industries Listed Companies KCC POSCO Total 6

III. Business Performance

NEW ORDER (Unit: Thousands of USD) 2007 Vessel Amount 2008 Vessel Amount 2009 Vessel Amount 2010. 10 Vessel Amount 7

DELIVERY (Unit: Thousands of USD) 2007 Vessel Amount 2008 Vessel Amount 2009 Vessel Amount 2010. 10 Vessel Amount 8

BACKLOGS (Unit: Thousands of USD) 2007 Vessel Amount 2008 Vessel Amount 2009 Vessel Amount 2010. 10 Vessel Amount 9

5 Price Trend Newbuilding (Unit: Millions of USD) 10

CAPEX PLAN (Unit: Billions of KRW) 11

IV. Hyundai-Vinashin Shipyard

OVERVIEW Company Data Shareholder Structure • Establishment : 1996. 03. 22 • Local Partner: Vietnam Shipbuilding Union • Employees : 3, 294 (Local: 3, 246, HMD: 48) • Common Stock : US $ 33, 456, 938 • Business Category 10% 30% 5% 55% - Current: Ship Repair, Conversion & Ship Building • Dock: No. 1(80 K DWT), No. 2(400 K DWT) • Quay: 1. 35 Km (4 EA) 12

FINANCIAL PERFORMANCE. (Unit: Thousands of USD) 2007 2008 2009 2010. 2 Q Sales 132, 261 120, 372 186, 378 119, 590 Operating Income 22, 470 24, 479 49, 195 27, 522 16. 99% 20. 34% 26. 40% 23. 00% 17, 118 21, 783 40, 086 26, 800 12. 94% 18. 10% 20. 08% 22. 04% Net Income 13
 Hyundai heavy industries investor relations
 Hyundai investor relations
 Hyundai investor relations
 Mipo definition
 Rockwell investor relations
 Rusal investor relations
 Corning investor day
 Cox investor relations
 Kepco investor relations
 Mama mancini holdings
 Investor relations skills
 Gray television investor relations
 Aramex investor relations
 Walt disney company investor relations
 Johnson matthey investor relations
 Rain industries investor relations
 Husky plastic injection molding manufacturer
 Nvr investor relations
 Gp strategies investor relations
 Societe generale scf


