Hull and Propeller Performance Monitoring Fuel Conservation and
- Slides: 27
Hull and Propeller Performance Monitoring (Fuel Conservation and Emission Reduction) Daniel Kane DKane@Propulsion. Dynamics. com SNAME Climate Change and Ships February 16, 17, 2010
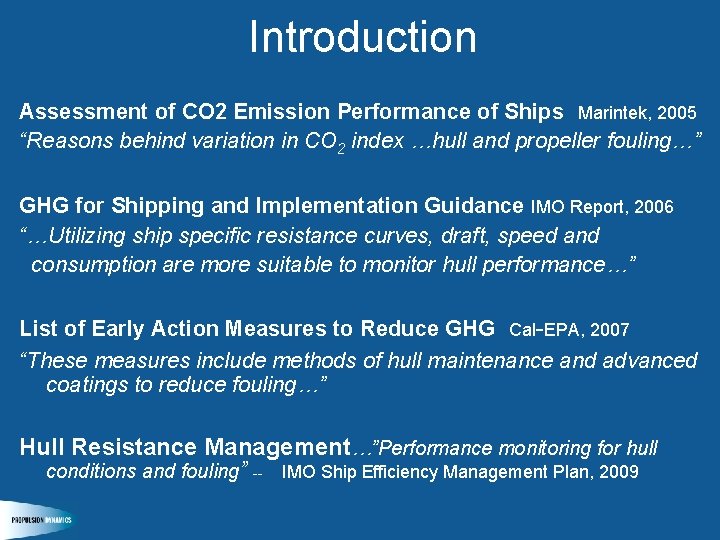
Introduction Assessment of CO 2 Emission Performance of Ships Marintek, 2005 “Reasons behind variation in CO 2 index …hull and propeller fouling…” GHG for Shipping and Implementation Guidance IMO Report, 2006 “…Utilizing ship specific resistance curves, draft, speed and consumption are more suitable to monitor hull performance…” List of Early Action Measures to Reduce GHG Cal-EPA, 2007 “These measures include methods of hull maintenance and advanced coatings to reduce fouling…” Hull Resistance Management…”Performance monitoring for hull conditions and fouling” -- IMO Ship Efficiency Management Plan, 2009
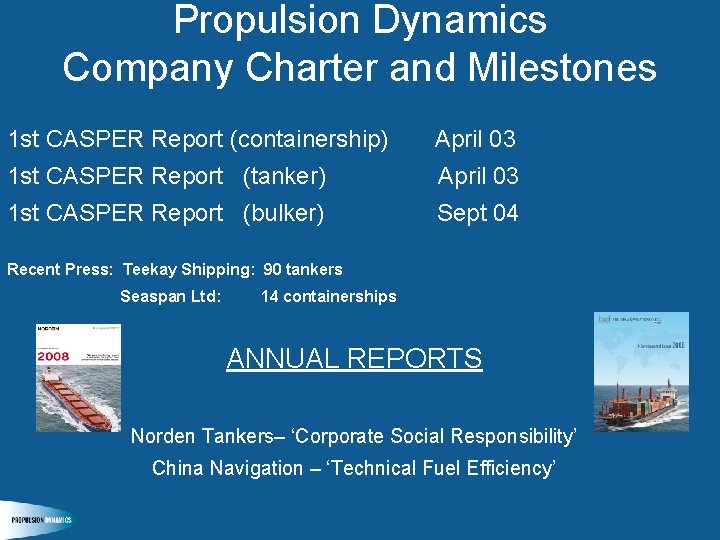
Propulsion Dynamics Company Charter and Milestones 1 st CASPER Report (containership) April 03 1 st CASPER Report (tanker) April 03 1 st CASPER Report (bulker) Sept 04 Recent Press: Teekay Shipping: 90 tankers Seaspan Ltd: 14 containerships ANNUAL REPORTS Norden Tankers– ‘Corporate Social Responsibility’ China Navigation – ‘Technical Fuel Efficiency’
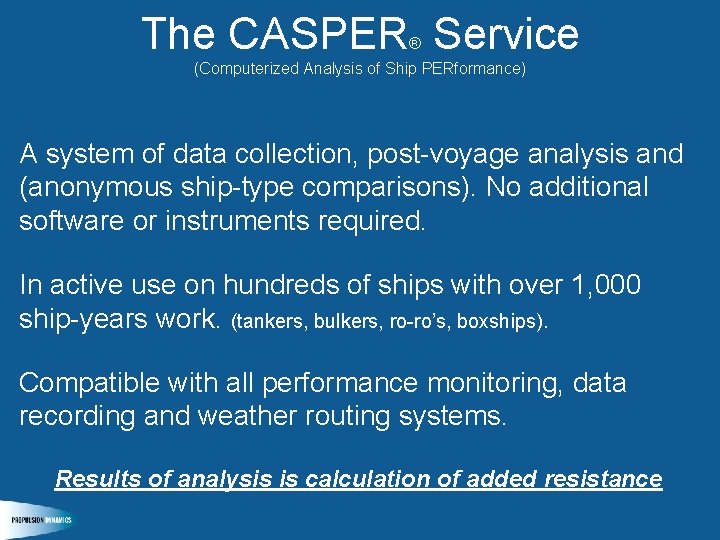
The CASPER Service ® (Computerized Analysis of Ship PERformance) A system of data collection, post-voyage analysis and (anonymous ship-type comparisons). No additional software or instruments required. In active use on hundreds of ships with over 1, 000 ship-years work. (tankers, bulkers, ro-ro’s, boxships). Compatible with all performance monitoring, data recording and weather routing systems. Results of analysis is calculation of added resistance
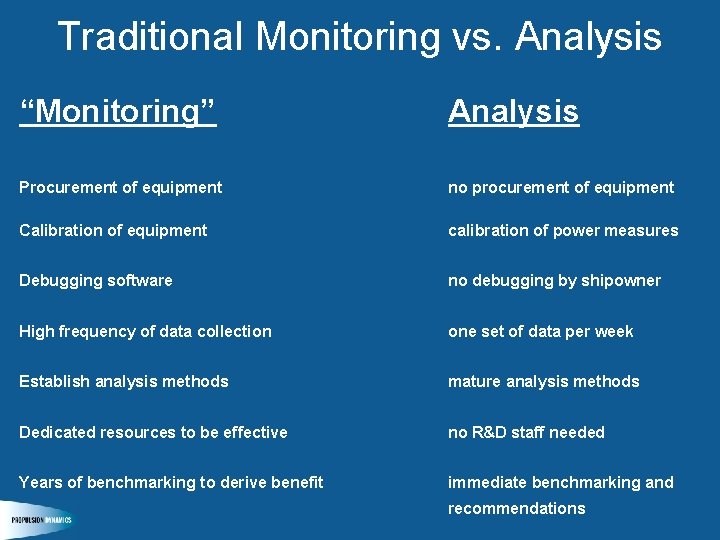
Traditional Monitoring vs. Analysis “Monitoring” Analysis Procurement of equipment no procurement of equipment Calibration of equipment calibration of power measures Debugging software no debugging by shipowner High frequency of data collection one set of data per week Establish analysis methods mature analysis methods Dedicated resources to be effective no R&D staff needed Years of benchmarking to derive benefit immediate benchmarking and recommendations
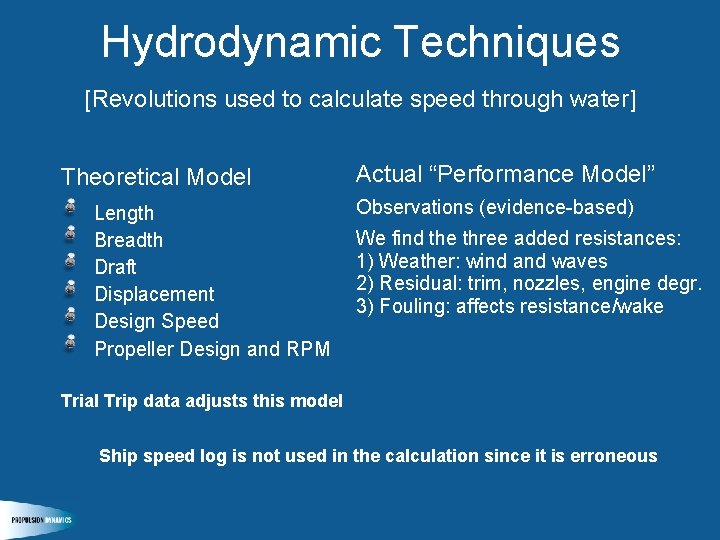
Hydrodynamic Techniques [Revolutions used to calculate speed through water] Theoretical Model Length Breadth Draft Displacement Design Speed Propeller Design and RPM Actual “Performance Model” Observations (evidence-based) We find the three added resistances: 1) Weather: wind and waves 2) Residual: trim, nozzles, engine degr. 3) Fouling: affects resistance/wake Trial Trip data adjusts this model Ship speed log is not used in the calculation since it is erroneous
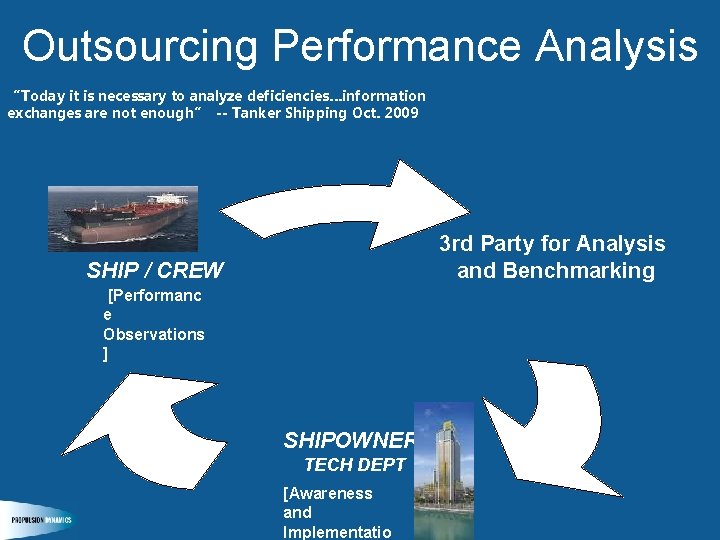
Outsourcing Performance Analysis “Today it is necessary to analyze deficiencies…information exchanges are not enough” -- Tanker Shipping Oct. 2009 3 rd Party for Analysis and Benchmarking SHIP / CREW [Performanc e Observations ] SHIPOWNER TECH DEPT [Awareness and Implementatio
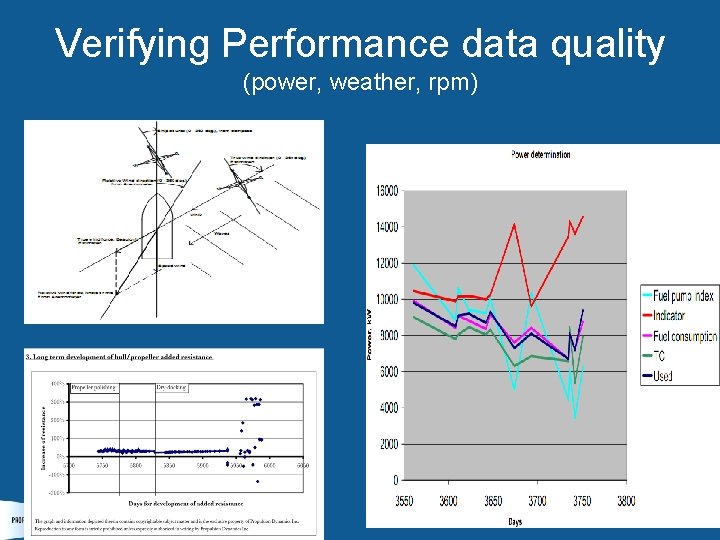
Verifying Performance data quality (power, weather, rpm)
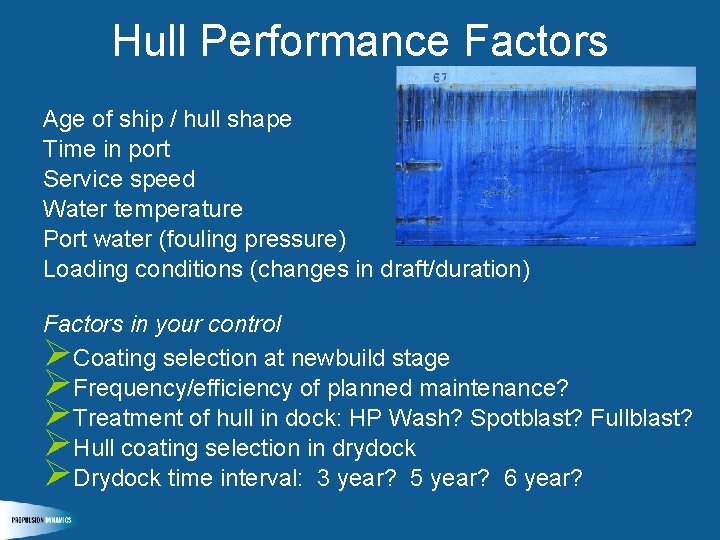
Hull Performance Factors Age of ship / hull shape Time in port Service speed Water temperature Port water (fouling pressure) Loading conditions (changes in draft/duration) Factors in your control ØCoating selection at newbuild stage ØFrequency/efficiency of planned maintenance? ØTreatment of hull in dock: HP Wash? Spotblast? Fullblast? ØHull coating selection in drydock ØDrydock time interval: 3 year? 5 year? 6 year?
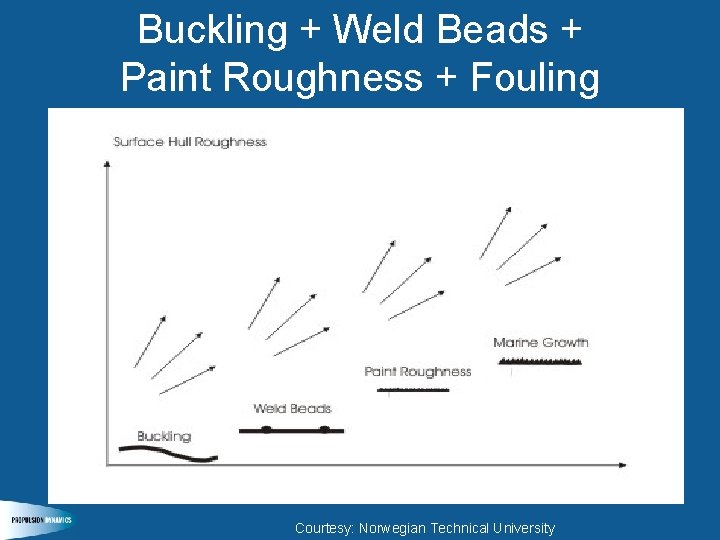
Buckling + Weld Beads + Paint Roughness + Fouling Courtesy: Norwegian Technical University
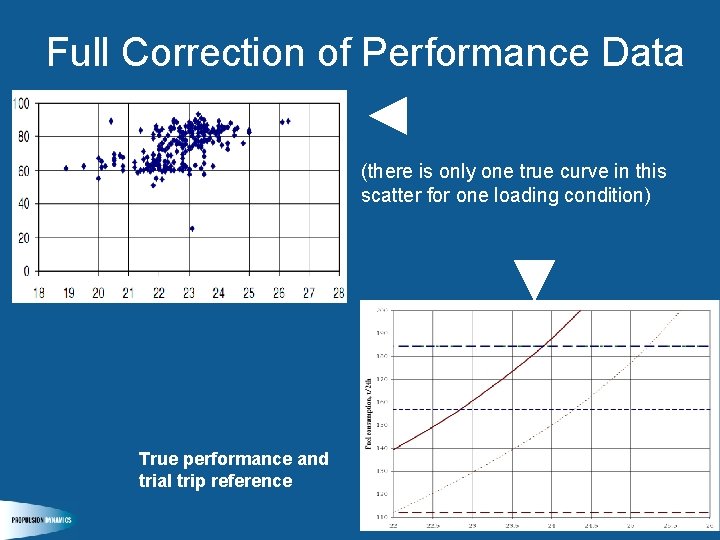
Full Correction of Performance Data ◄ (there is only one true curve in this scatter for one loading condition) ▼ True performance and trial trip reference
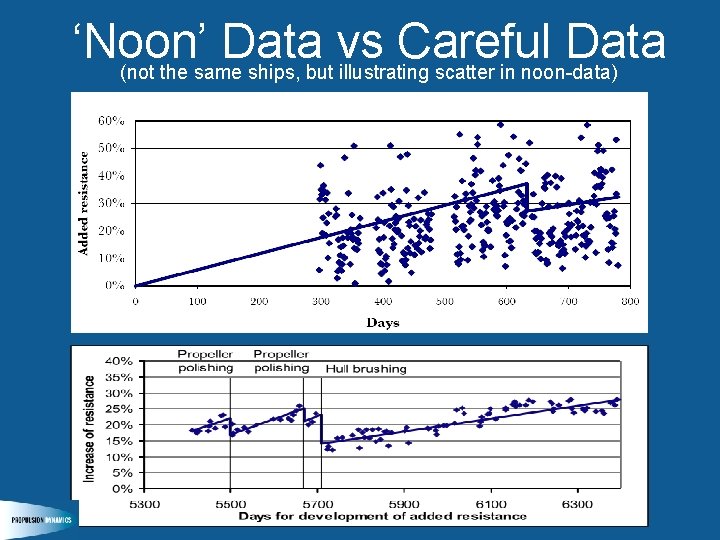
‘Noon’ Data vs Careful Data (not the same ships, but illustrating scatter in noon-data)
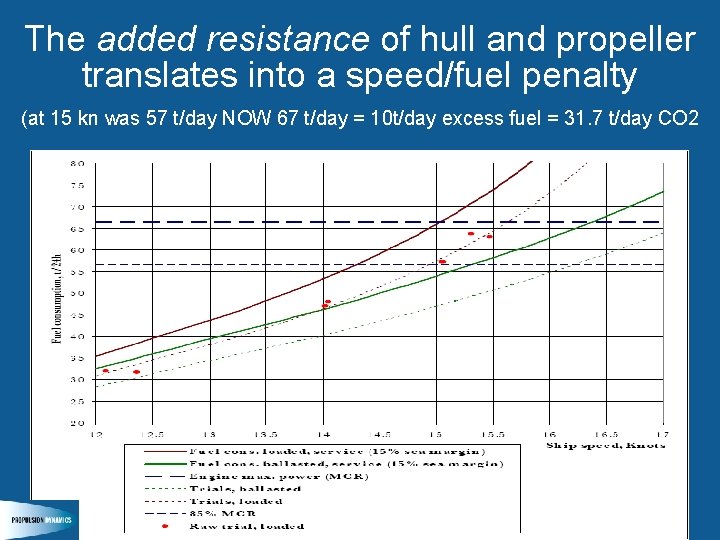
The added resistance of hull and propeller translates into a speed/fuel penalty (at 15 kn was 57 t/day NOW 67 t/day = 10 t/day excess fuel = 31. 7 t/day CO 2
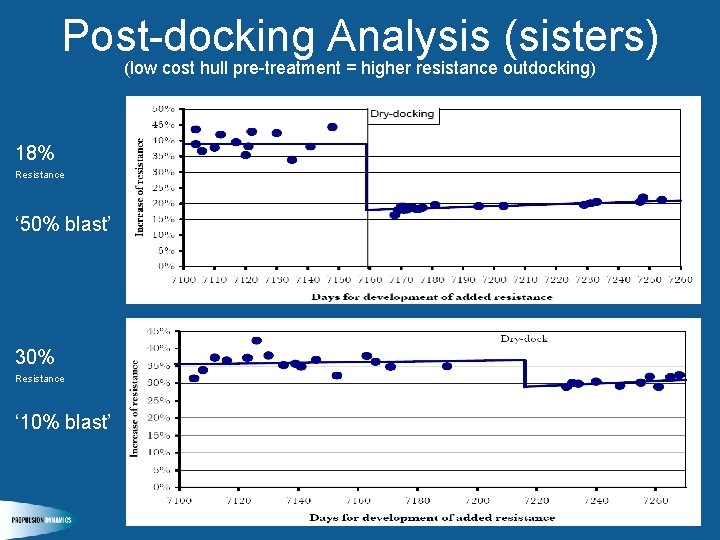
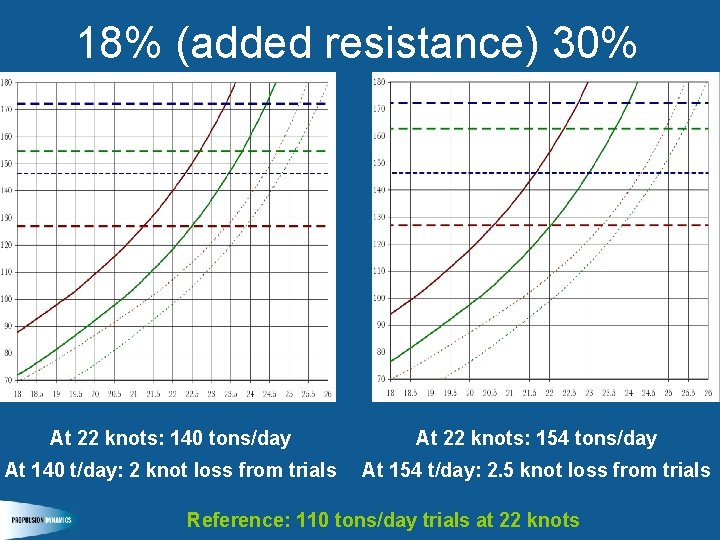
Post-docking Analysis (sisters) (low cost hull pre-treatment = higher resistance outdocking) 18% Resistance ‘ 50% blast’ 30% Resistance ‘ 10% blast’
18% (added resistance) 30% At 22 knots: 140 tons/day At 22 knots: 154 tons/day At 140 t/day: 2 knot loss from trials At 154 t/day: 2. 5 knot loss from trials Reference: 110 tons/day trials at 22 knots
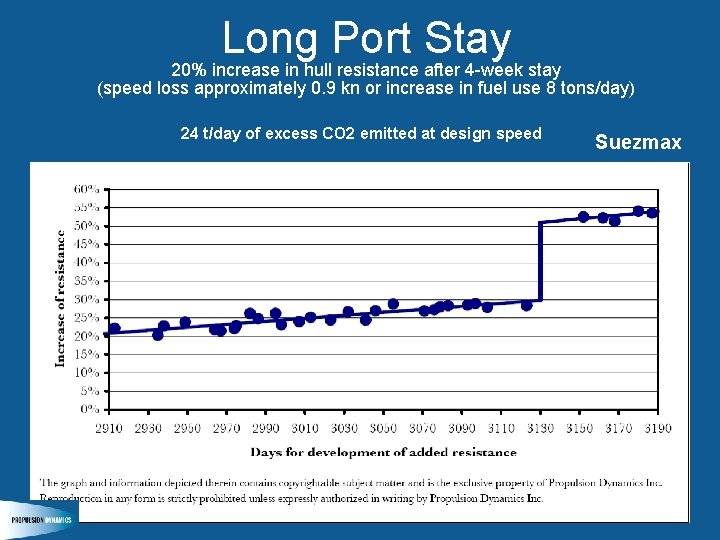
Long Port Stay 20% increase in hull resistance after 4 -week stay (speed loss approximately 0. 9 kn or increase in fuel use 8 tons/day) 24 t/day of excess CO 2 emitted at design speed Suezmax
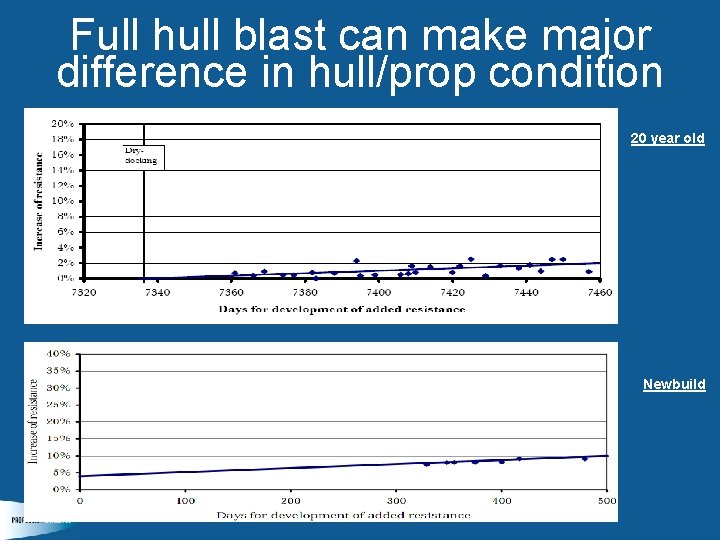
Full hull blast can make major difference in hull/prop condition 20 year old Newbuild
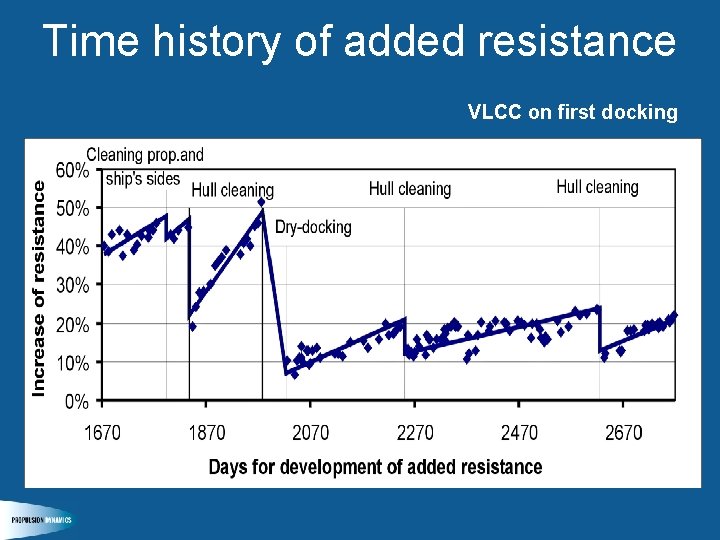
Time history of added resistance VLCC on first docking
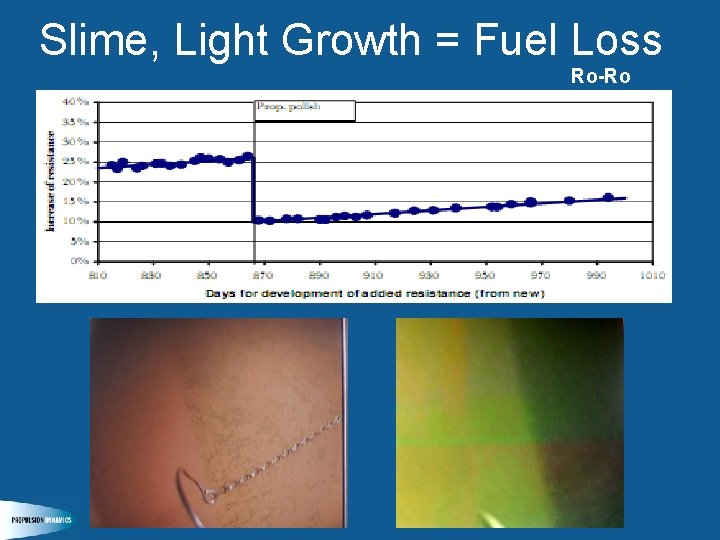
Slime, Light Growth = Fuel Loss Ro-Ro
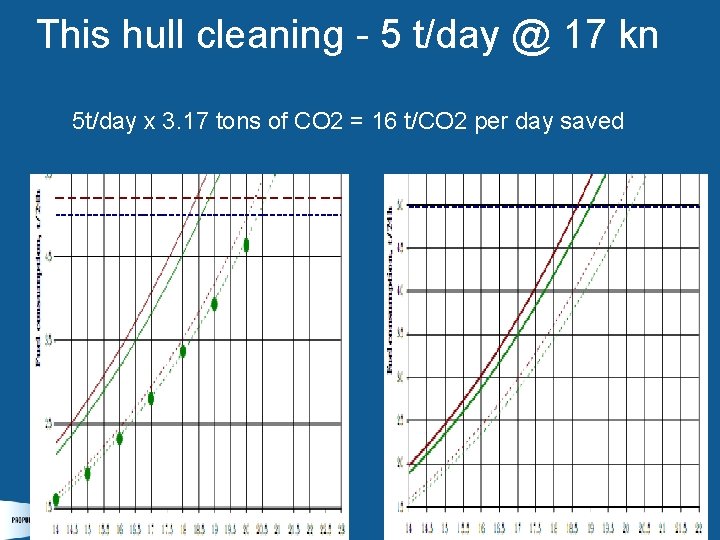
This hull cleaning - 5 t/day @ 17 kn 5 t/day x 3. 17 tons of CO 2 = 16 t/CO 2 per day saved
Rough surface = extra fuel+emissions
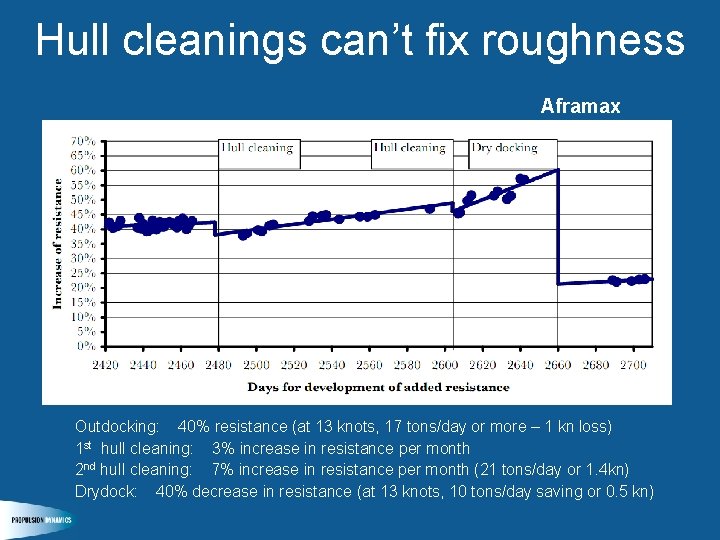
Hull cleanings can’t fix roughness Aframax Outdocking: 40% resistance (at 13 knots, 17 tons/day or more – 1 kn loss) 1 st hull cleaning: 3% increase in resistance per month 2 nd hull cleaning: 7% increase in resistance per month (21 tons/day or 1. 4 kn) Drydock: 40% decrease in resistance (at 13 knots, 10 tons/day saving or 0. 5 kn)
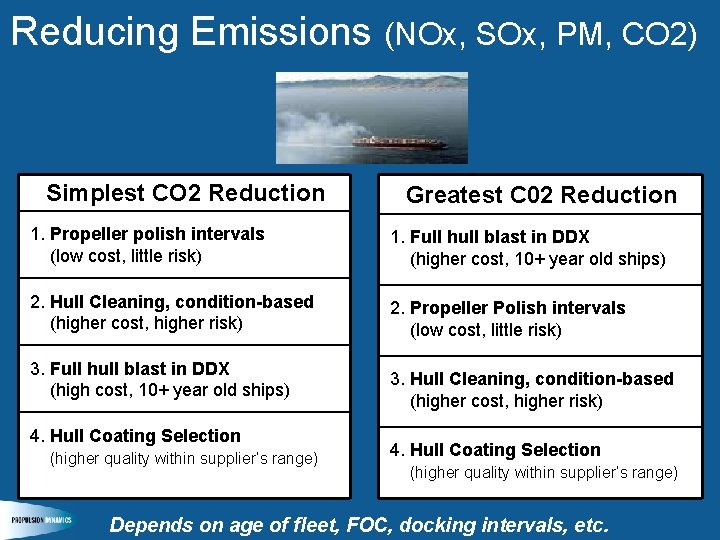
Reducing Emissions (NOx, SOx, PM, CO 2) Simplest CO 2 Reduction Greatest C 02 Reduction 1. Propeller polish intervals (low cost, little risk) 1. Full hull blast in DDX (higher cost, 10+ year old ships) 2. Hull Cleaning, condition-based (higher cost, higher risk) 2. Propeller Polish intervals (low cost, little risk) 3. Full hull blast in DDX (high cost, 10+ year old ships) 4. Hull Coating Selection (higher quality within supplier’s range) 3. Hull Cleaning, condition-based (higher cost, higher risk) 4. Hull Coating Selection (higher quality within supplier’s range) Depends on age of fleet, FOC, docking intervals, etc.
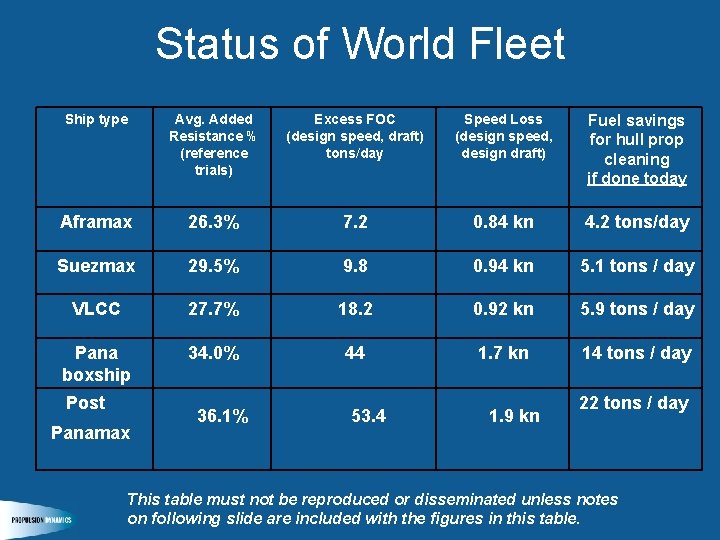
Status of World Fleet Ship type Avg. Added Resistance % (reference trials) Excess FOC (design speed, draft) tons/day Speed Loss (design speed, design draft) Fuel savings for hull prop cleaning if done today Aframax 26. 3% 7. 2 0. 84 kn 4. 2 tons/day Suezmax 29. 5% 9. 8 0. 94 kn 5. 1 tons / day VLCC 27. 7% 18. 2 0. 92 kn 5. 9 tons / day Pana boxship 34. 0% 44 1. 7 kn 14 tons / day Post Panamax 36. 1% 53. 4 1. 9 kn 22 tons / day This table must not be reproduced or disseminated unless notes on following slide are included with the figures in this table.
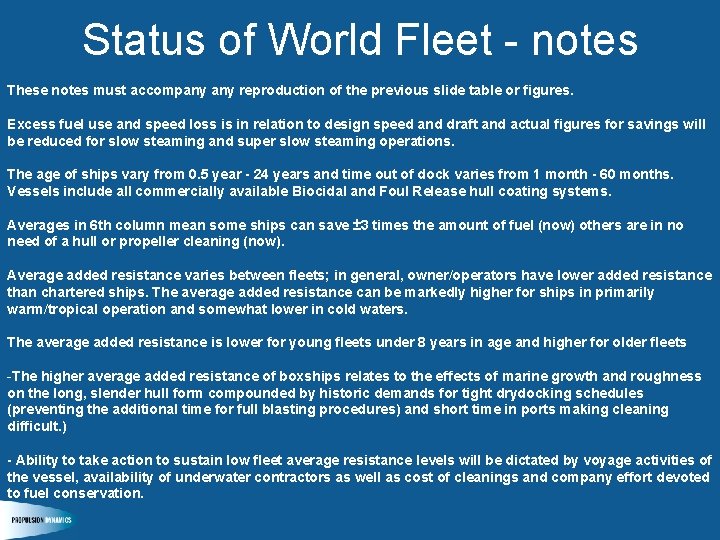
Status of World Fleet - notes These notes must accompany reproduction of the previous slide table or figures. Excess fuel use and speed loss is in relation to design speed and draft and actual figures for savings will be reduced for slow steaming and super slow steaming operations. The age of ships vary from 0. 5 year - 24 years and time out of dock varies from 1 month - 60 months. Vessels include all commercially available Biocidal and Foul Release hull coating systems. Averages in 6 th column mean some ships can save ± 3 times the amount of fuel (now) others are in no need of a hull or propeller cleaning (now). Average added resistance varies between fleets; in general, owner/operators have lower added resistance than chartered ships. The average added resistance can be markedly higher for ships in primarily warm/tropical operation and somewhat lower in cold waters. The average added resistance is lower for young fleets under 8 years in age and higher for older fleets -The higher average added resistance of boxships relates to the effects of marine growth and roughness on the long, slender hull form compounded by historic demands for tight drydocking schedules (preventing the additional time for full blasting procedures) and short time in ports making cleaning difficult. ) - Ability to take action to sustain low fleet average resistance levels will be dictated by voyage activities of the vessel, availability of underwater contractors as well as cost of cleanings and company effort devoted to fuel conservation.
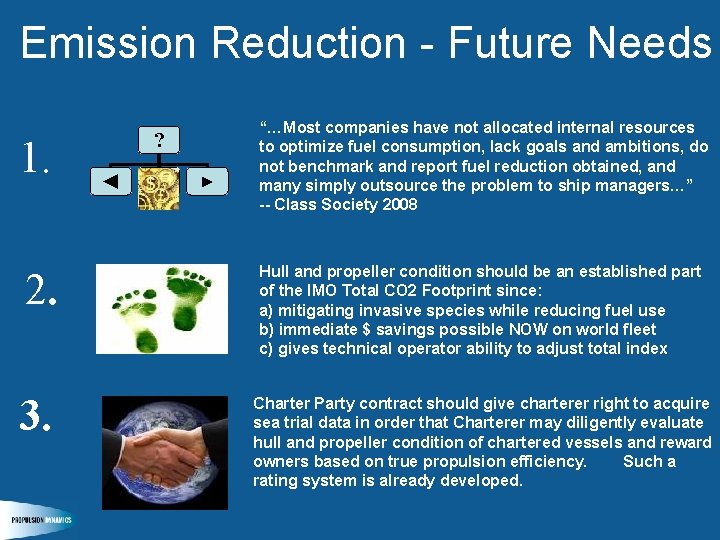
Emission Reduction - Future Needs 1. 2. 3. ? ◄ ▼ ► “…Most companies have not allocated internal resources to optimize fuel consumption, lack goals and ambitions, do not benchmark and report fuel reduction obtained, and many simply outsource the problem to ship managers…” -- Class Society 2008 Hull and propeller condition should be an established part of the IMO Total CO 2 Footprint since: a) mitigating invasive species while reducing fuel use b) immediate $ savings possible NOW on world fleet c) gives technical operator ability to adjust total index Charter Party contract should give charterer right to acquire sea trial data in order that Charterer may diligently evaluate hull and propeller condition of chartered vessels and reward owners based on true propulsion efficiency. Such a rating system is already developed.
Thank You!