How is development measured Development is a complex
- Slides: 43
How is development measured? • Development is a complex process and there is little agreement on how to measure it • The most common and easiest measures are Economic measures: Gross Domestic Product and Gross National Product (economic indicators) GDP & GNP
GDP Economic indicators • GDP is definitely the preferred measure of development among economists and is gaining popularity in general conversation as well. • GDP stands for Gross Domestic Product
Definition of GDP Economic indicators • GDP measures the value of all production within a nation, by whoever happens to be working there • This is usually presented as a per capita value (GDP divided by the population)
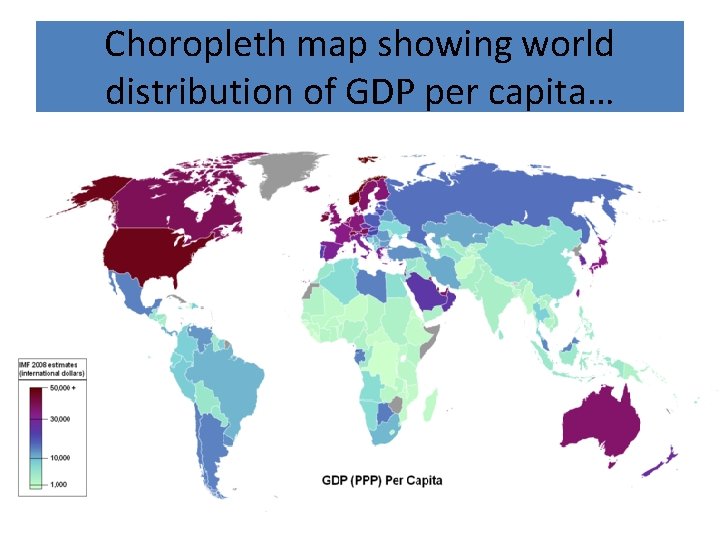
Choropleth map showing world distribution of GDP per capita…
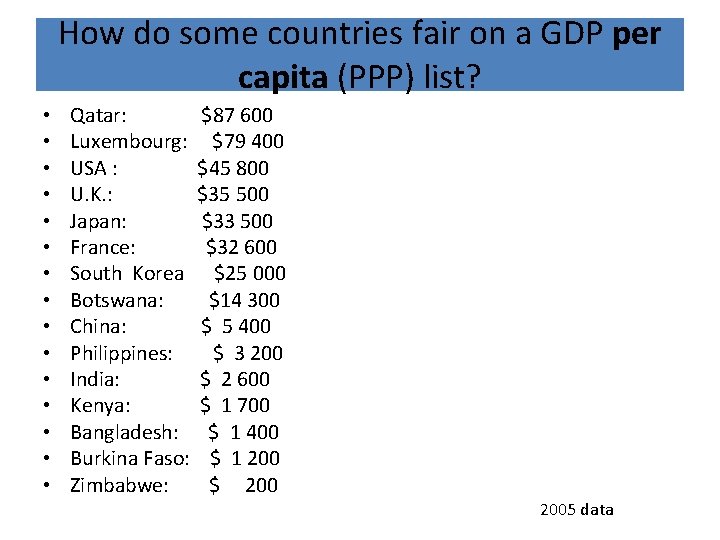
How do some countries fair on a GDP per capita (PPP) list? • • • • Qatar: Luxembourg: USA : U. K. : Japan: France: South Korea Botswana: China: Philippines: India: Kenya: Bangladesh: Burkina Faso: Zimbabwe: $87 600 $79 400 $45 800 $35 500 $33 500 $32 600 $25 000 $14 300 $ 5 400 $ 3 200 $ 2 600 $ 1 700 $ 1 400 $ 1 200 $ 2005 data
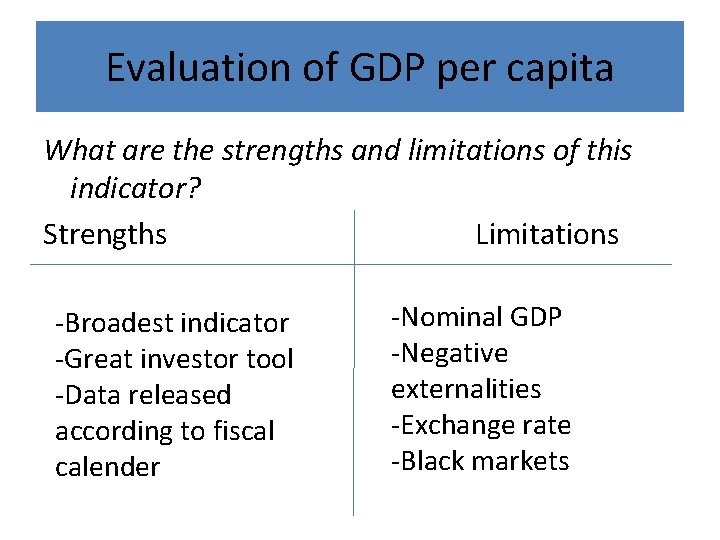
Evaluation of GDP per capita What are the strengths and limitations of this indicator? Strengths Limitations -Broadest indicator -Great investor tool -Data released according to fiscal calender -Nominal GDP -Negative externalities -Exchange rate -Black markets
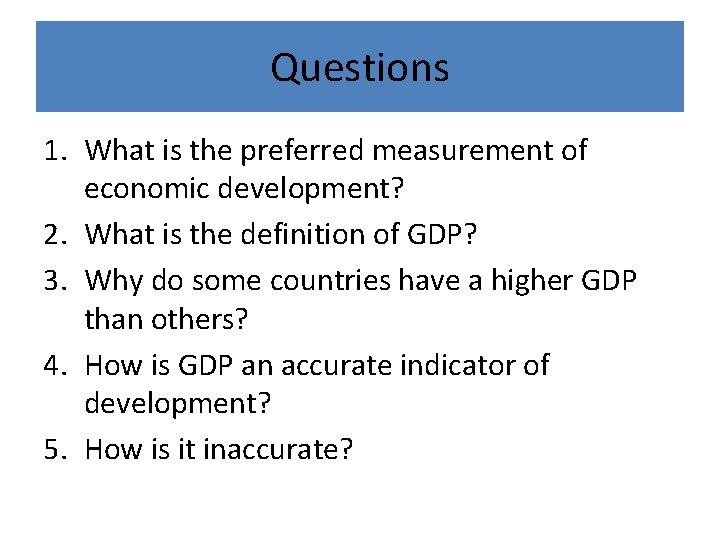
Questions 1. What is the preferred measurement of economic development? 2. What is the definition of GDP? 3. Why do some countries have a higher GDP than others? 4. How is GDP an accurate indicator of development? 5. How is it inaccurate?
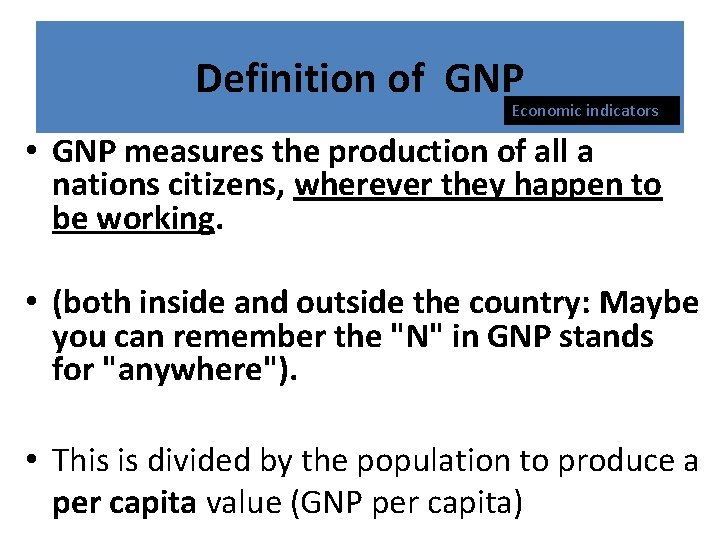
Definition of GNP Economic indicators • GNP measures the production of all a nations citizens, wherever they happen to be working. • (both inside and outside the country: Maybe you can remember the "N" in GNP stands for "anywhere"). • This is divided by the population to produce a per capita value (GNP per capita)
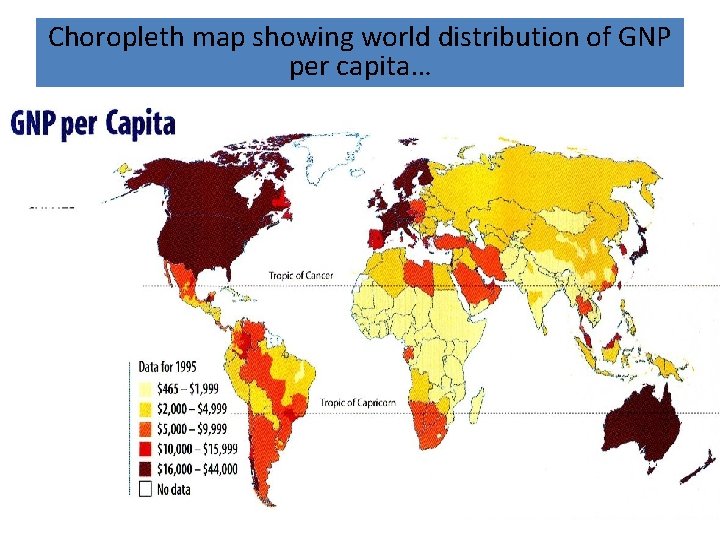
Choropleth map showing world distribution of GNP per capita…
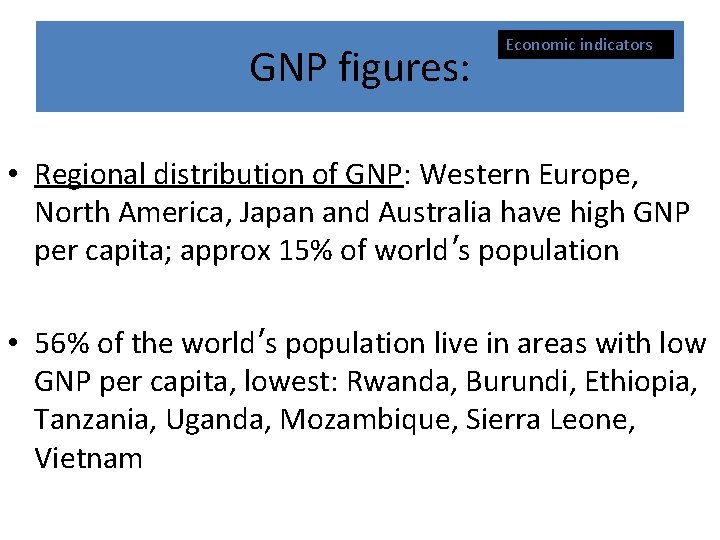
GNP figures: Economic indicators • Regional distribution of GNP: Western Europe, North America, Japan and Australia have high GNP per capita; approx 15% of world’s population • 56% of the world’s population live in areas with low GNP per capita, lowest: Rwanda, Burundi, Ethiopia, Tanzania, Uganda, Mozambique, Sierra Leone, Vietnam
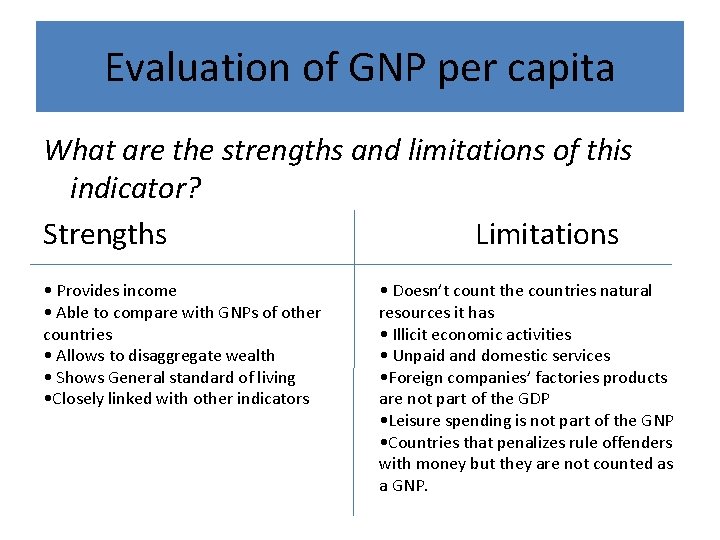
Evaluation of GNP per capita What are the strengths and limitations of this indicator? Strengths Limitations • Provides income • Able to compare with GNPs of other countries • Allows to disaggregate wealth • Shows General standard of living • Closely linked with other indicators • Doesn’t count the countries natural resources it has • Illicit economic activities • Unpaid and domestic services • Foreign companies’ factories products are not part of the GDP • Leisure spending is not part of the GNP • Countries that penalizes rule offenders with money but they are not counted as a GNP.
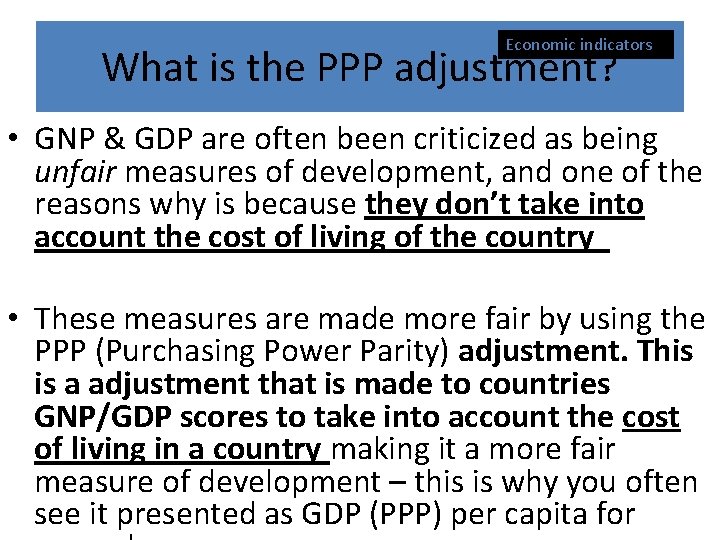
Economic indicators What is the PPP adjustment? • GNP & GDP are often been criticized as being unfair measures of development, and one of the reasons why is because they don’t take into account the cost of living of the country • These measures are made more fair by using the PPP (Purchasing Power Parity) adjustment. This is a adjustment that is made to countries GNP/GDP scores to take into account the cost of living in a country making it a more fair measure of development – this is why you often see it presented as GDP (PPP) per capita for
Example of cost of living differences…. 1. How much does a Big Mac cost in the Philippines? 2. How much does a Big Mac cost in the USA? 3. How much does a can of Coke cost in Korea? 4. How much does a can of Coke cost in India? 5. How much does a coffee (from Starbucks) cost in Australia? 6. How much does a coffee (from Starbucks) cost in England?
Example of cost of living differences…. There is a difference in the cost of living of these countries… so calculating GDP (PPP) or GNP (PPP) gives a more fair measure of development because it takes into account the cost of living of the country
Social Indicators Death/Birth Rate, Infant Mortality Rate, Literacy rate
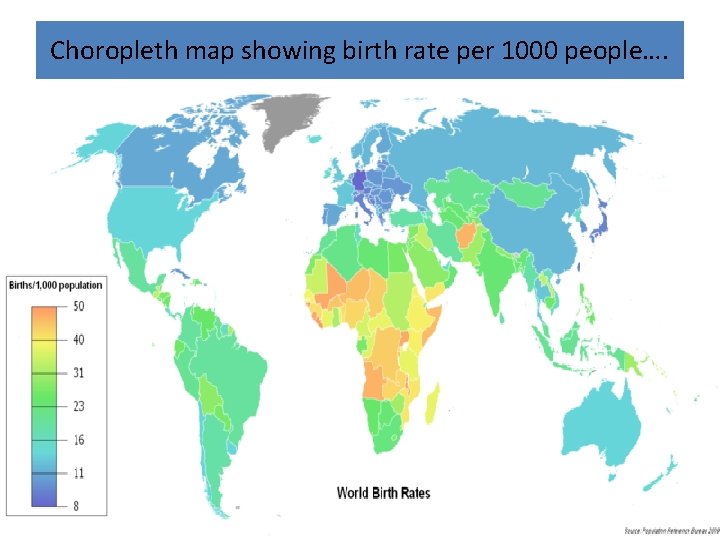
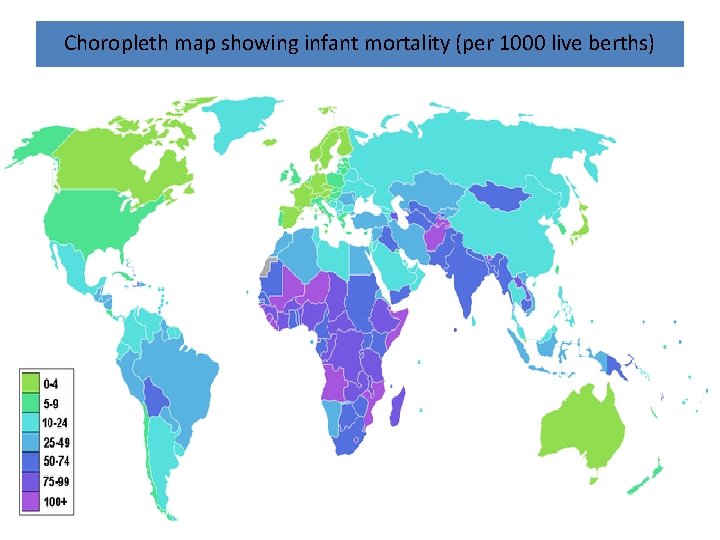
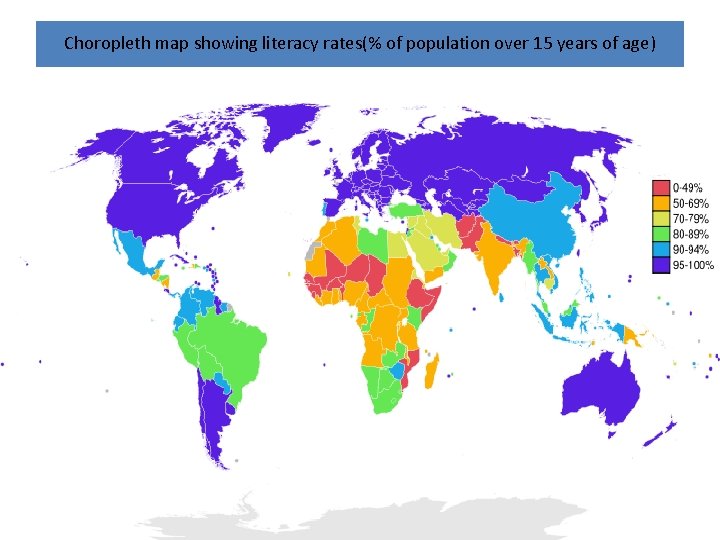
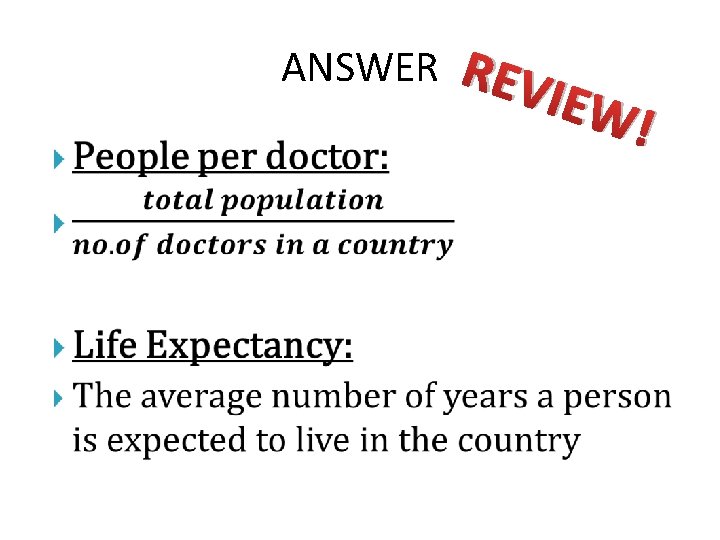
More Social Indicators Definitions: • Death/birth rate: the number of deaths/births 1000 of the population per year • Infant Mortality: number of infant deaths (one year of age or younger) per 1000 live births • literacy rate: % of the population over age fifteen that can read and write
Choropleth map showing birth rate per 1000 people….
Choropleth map showing infant mortality (per 1000 live berths)
Choropleth map showing literacy rates(% of population over 15 years of age)
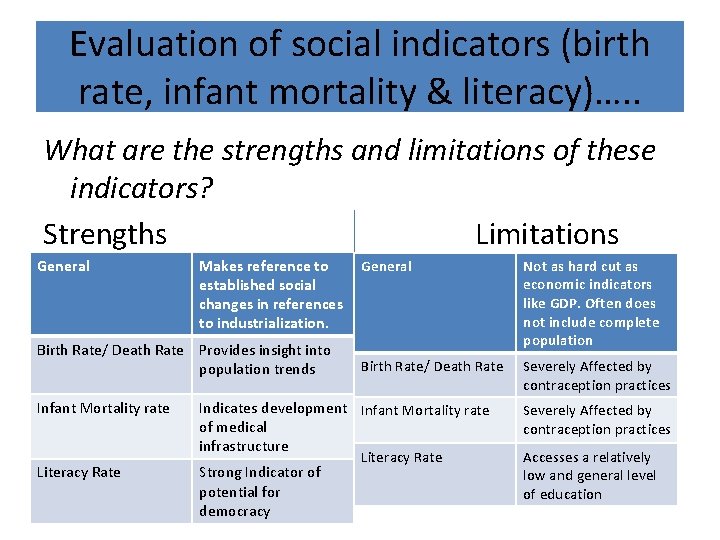
Evaluation of social indicators (birth rate, infant mortality & literacy)…. . What are the strengths and limitations of these indicators? Strengths Limitations General Makes reference to established social changes in references to industrialization. Birth Rate/ Death Rate Provides insight into population trends Infant Mortality rate Literacy Rate General Not as hard cut as economic indicators like GDP. Often does not include complete population Birth Rate/ Death Rate Severely Affected by contraception practices Indicates development Infant Mortality rate of medical infrastructure Literacy Rate Strong Indicator of potential for democracy Severely Affected by contraception practices Accesses a relatively low and general level of education
SOCIAL INDICATORS OF DEVELOPMENT
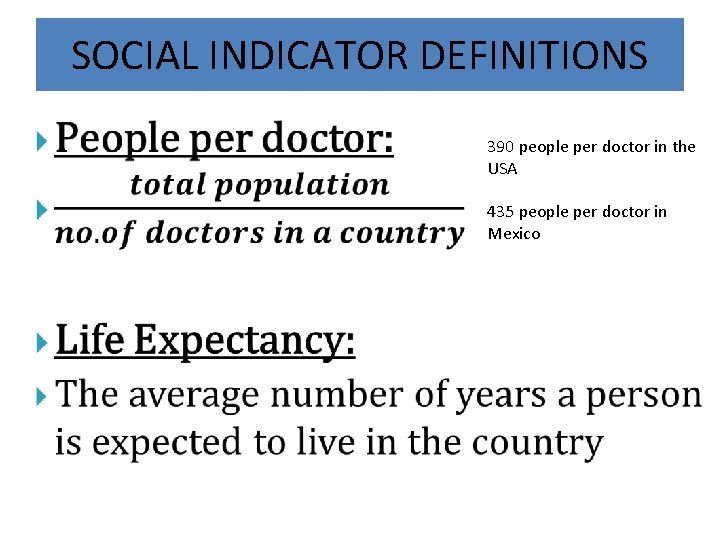
SOCIAL INDICATOR DEFINITIONS • 390 people per doctor in the USA 435 people per doctor in Mexico
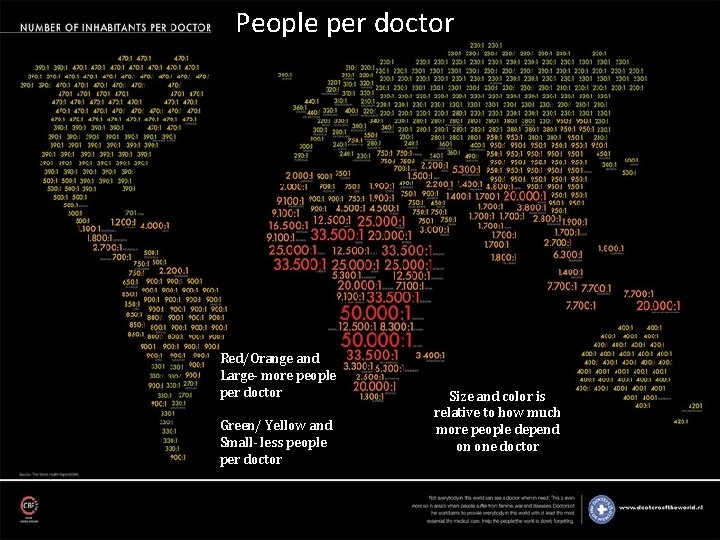
People per doctor Red/Orange and Large- more people per doctor Green/ Yellow and Small- less people per doctor Size and color is relative to how much more people depend on one doctor
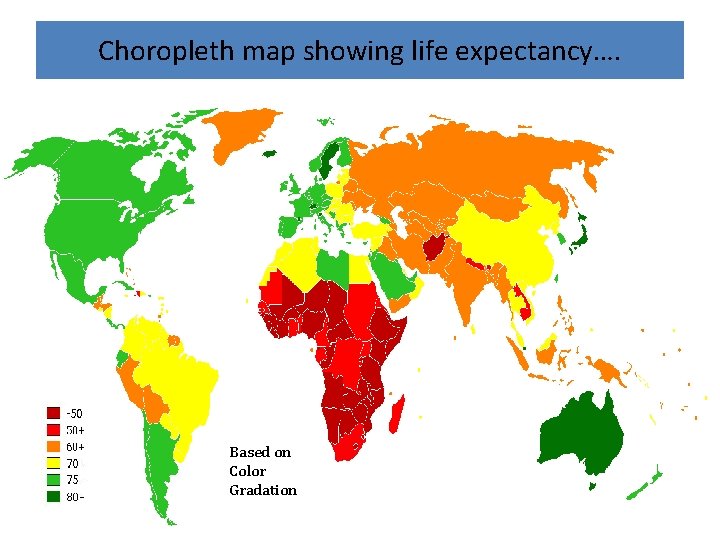
Choropleth map showing life expectancy…. Based on Color Gradation
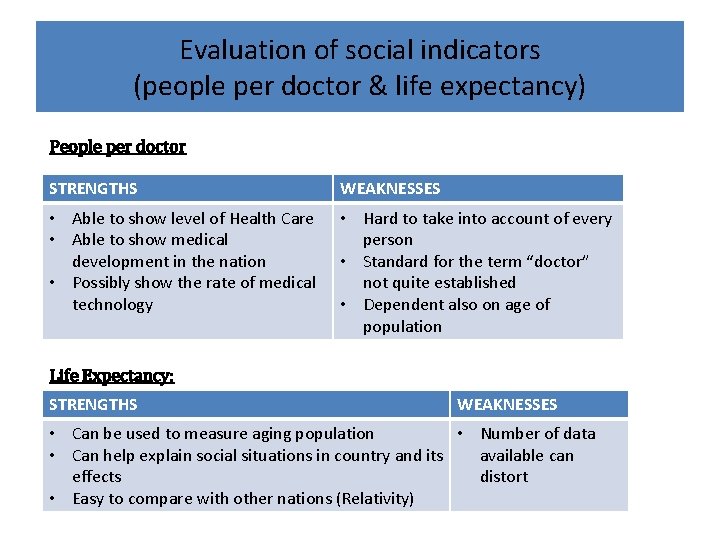
Evaluation of social indicators (people per doctor & life expectancy) People per doctor STRENGTHS WEAKNESSES • Able to show level of Health Care • Able to show medical development in the nation • Possibly show the rate of medical technology • Hard to take into account of every person • Standard for the term “doctor” not quite established • Dependent also on age of population Life Expectancy: STRENGTHS WEAKNESSES • Can be used to measure aging population • Number of data • Can help explain social situations in country and its available can effects distort • Easy to compare with other nations (Relativity)
QUESTION TIME • Give definitions for People per doctor and Life expectancy
ANSWER • REV IEW !
QUESTION TIME • What is important to watch out for in a choropleth map?
ANSWER • COLOR GRADIENTS
QUESTION TIME • What is important to watch out for in a map using ratios
ANSWER • Size, Color, Actual Ratio Numbers
QUESTION TIME • Why are social indicators useful? Name 2 examples from either Life Expectancy or People per doctor
ANSWER • Answers will vary
QUESTION • Why should social indicators not be the only thing we watch out for?
ANSWER • Answers will vary
Human Development Index (HDI) By: Lloyd Taylor, Hae Min Kim, and Trey
What alternative measures are there? • The United Nations Development Programme introduced a more meaningful measure of development: The Human Development Index, or A composite indicator: Combines Social & Economic indicators HDI
composite indicators How does the HDI measure development? The HDI is an index calculated from three variables: • Income, – measured by GDP per capita • Knowledge, measured by adult literacy rates and the percentage of children attending school • Longevity, – measured as life expectancy at birth
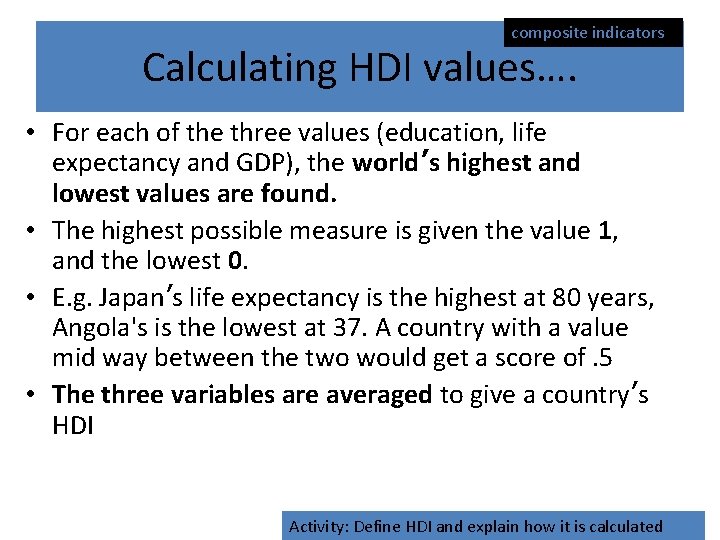
composite indicators Calculating HDI values…. • For each of the three values (education, life expectancy and GDP), the world’s highest and lowest values are found. • The highest possible measure is given the value 1, and the lowest 0. • E. g. Japan’s life expectancy is the highest at 80 years, Angola's is the lowest at 37. A country with a value mid way between the two would get a score of. 5 • The three variables are averaged to give a country’s HDI Activity: Define HDI and explain how it is calculated
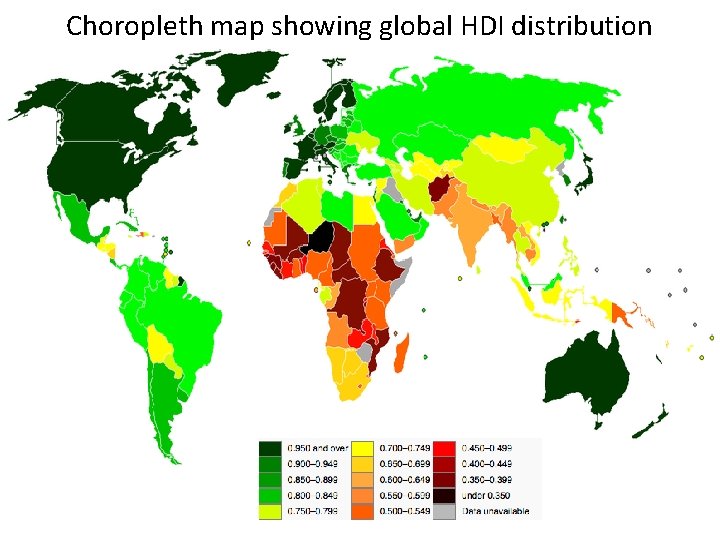
Choropleth map showing global HDI distribution
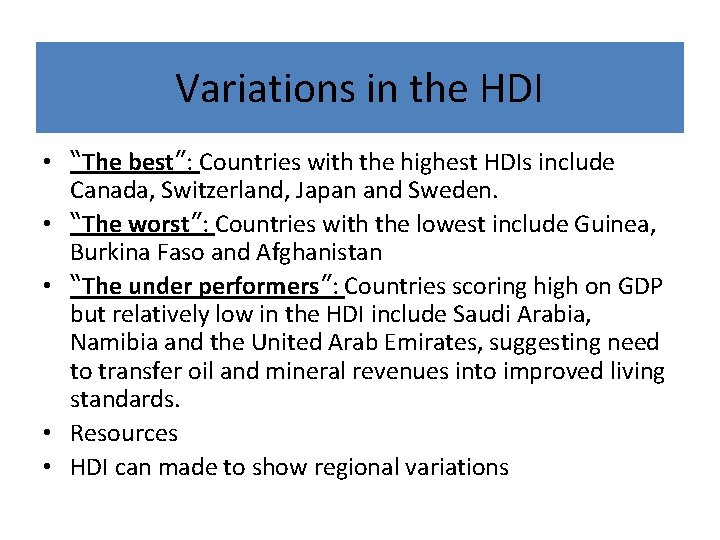
Variations in the HDI • “The best”: Countries with the highest HDIs include Canada, Switzerland, Japan and Sweden. • “The worst”: Countries with the lowest include Guinea, Burkina Faso and Afghanistan • “The under performers”: Countries scoring high on GDP but relatively low in the HDI include Saudi Arabia, Namibia and the United Arab Emirates, suggesting need to transfer oil and mineral revenues into improved living standards. • Resources • HDI can made to show regional variations
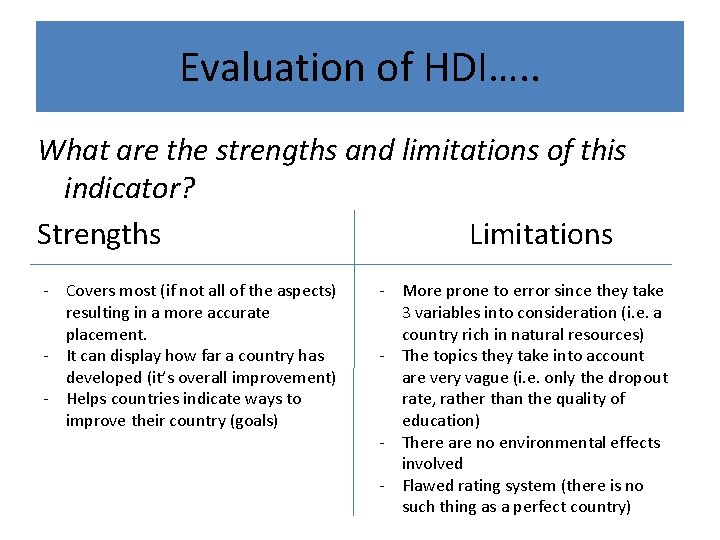
Evaluation of HDI…. . What are the strengths and limitations of this indicator? Strengths Limitations - Covers most (if not all of the aspects) resulting in a more accurate placement. - It can display how far a country has developed (it’s overall improvement) - Helps countries indicate ways to improve their country (goals) - More prone to error since they take 3 variables into consideration (i. e. a country rich in natural resources) - The topics they take into account are very vague (i. e. only the dropout rate, rather than the quality of education) - There are no environmental effects involved - Flawed rating system (there is no such thing as a perfect country)
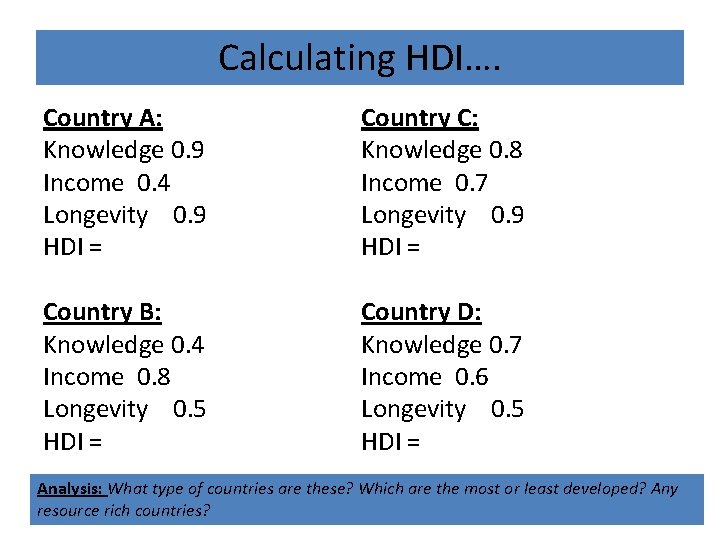
Calculating HDI…. Country A: Knowledge 0. 9 Income 0. 4 Longevity 0. 9 HDI = Country C: Knowledge 0. 8 Income 0. 7 Longevity 0. 9 HDI = Country B: Knowledge 0. 4 Income 0. 8 Longevity 0. 5 HDI = Country D: Knowledge 0. 7 Income 0. 6 Longevity 0. 5 HDI = Analysis: What type of countries are these? Which are the most or least developed? Any resource rich countries?