Highly Correlated Measures of Insulin Sensitivity Thomas Lotz

- Slides: 17
Highly Correlated Measures of Insulin Sensitivity Thomas Lotz 1, J Geoffrey Chase 1, Kirsten A Mc. Auley 3, Jessica Lin 1, Geoffrey M Shaw 2, Chris E Hann 1, 1 Centre for Bioengineering, University of Canterbury, Christchurch 2 Christchurch School of Medicine and Health Sciences, University of Otago, Christchurch 3 Edgar National Centre for Diabetes Research, Dunedin
Up to now… • Control of Hyperglycaemia in the ICU Ø Development of a model-based adaptive control protocol to reduce hyperglycaemia Ø Development of a physiological model of glucose and insulin kinetics Ø Model validation with retrospective ICU data
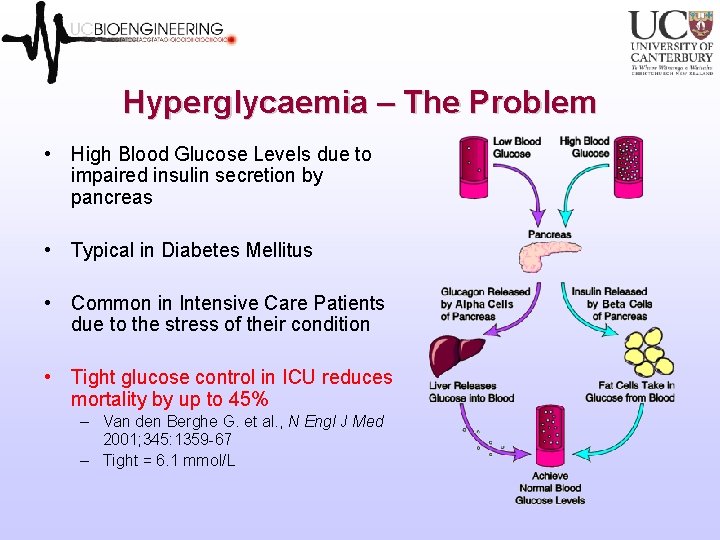
Hyperglycaemia – The Problem • High Blood Glucose Levels due to impaired insulin secretion by pancreas • Typical in Diabetes Mellitus • Common in Intensive Care Patients due to the stress of their condition • Tight glucose control in ICU reduces mortality by up to 45% – Van den Berghe G. et al. , N Engl J Med 2001; 345: 1359 -67 – Tight = 6. 1 mmol/L
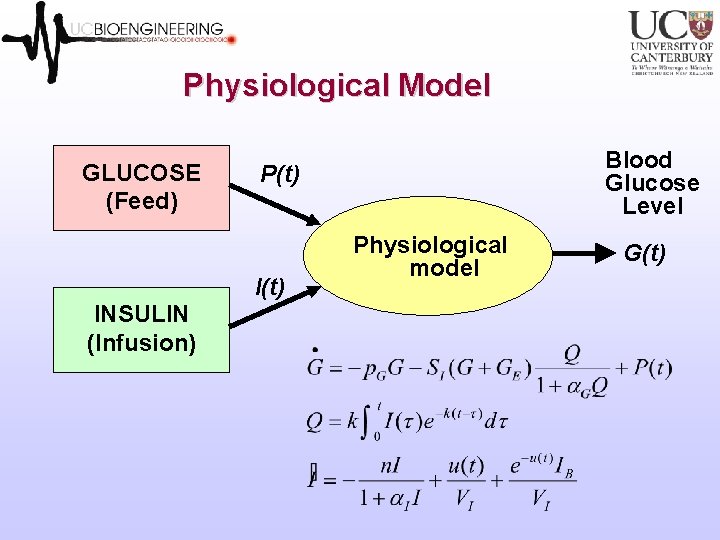
Physiological Model GLUCOSE (Feed) P(t) INSULIN (Infusion) Blood Glucose Level Physiological model G(t)
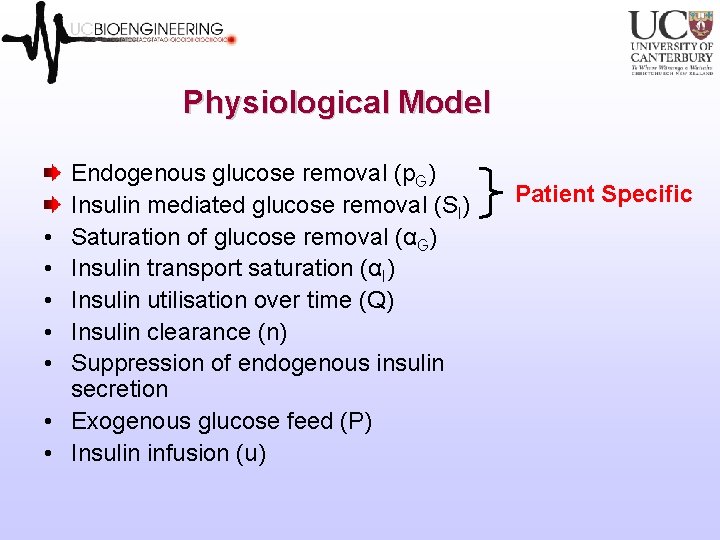
Physiological Model • • Endogenous glucose removal (p. G) Insulin mediated glucose removal (SI) Saturation of glucose removal (αG) Insulin transport saturation (αI) Insulin utilisation over time (Q) Insulin clearance (n) Suppression of endogenous insulin secretion Exogenous glucose feed (P) Insulin infusion (u) Patient Specific
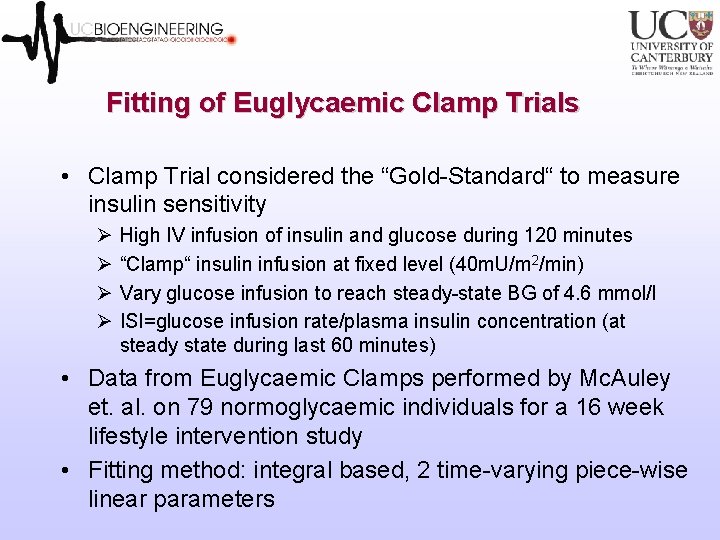
Fitting of Euglycaemic Clamp Trials • Clamp Trial considered the “Gold-Standard“ to measure insulin sensitivity Ø Ø High IV infusion of insulin and glucose during 120 minutes “Clamp“ insulin infusion at fixed level (40 m. U/m 2/min) Vary glucose infusion to reach steady-state BG of 4. 6 mmol/l ISI=glucose infusion rate/plasma insulin concentration (at steady state during last 60 minutes) • Data from Euglycaemic Clamps performed by Mc. Auley et. al. on 79 normoglycaemic individuals for a 16 week lifestyle intervention study • Fitting method: integral based, 2 time-varying piece-wise linear parameters
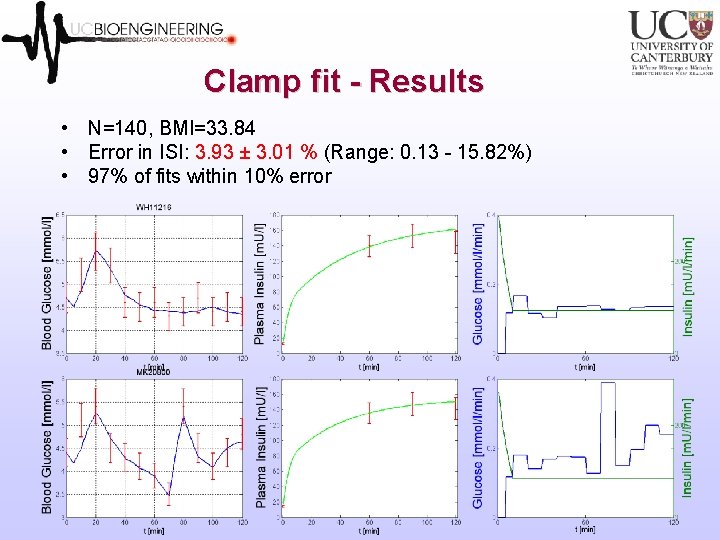
Clamp fit - Results • N=140, BMI=33. 84 • Error in ISI: 3. 93 ± 3. 01 % (Range: 0. 13 - 15. 82%) • 97% of fits within 10% error
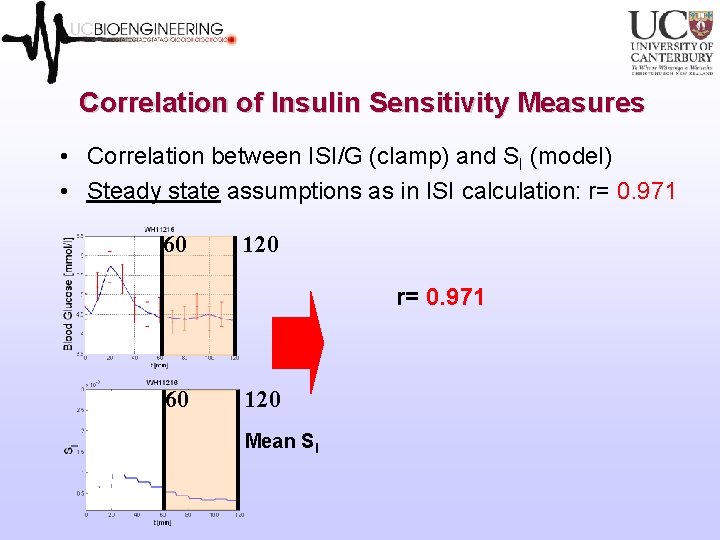
Correlation of Insulin Sensitivity Measures • Correlation between ISI/G (clamp) and SI (model) • Steady state assumptions as in ISI calculation: r= 0. 971 60 120 Mean SI
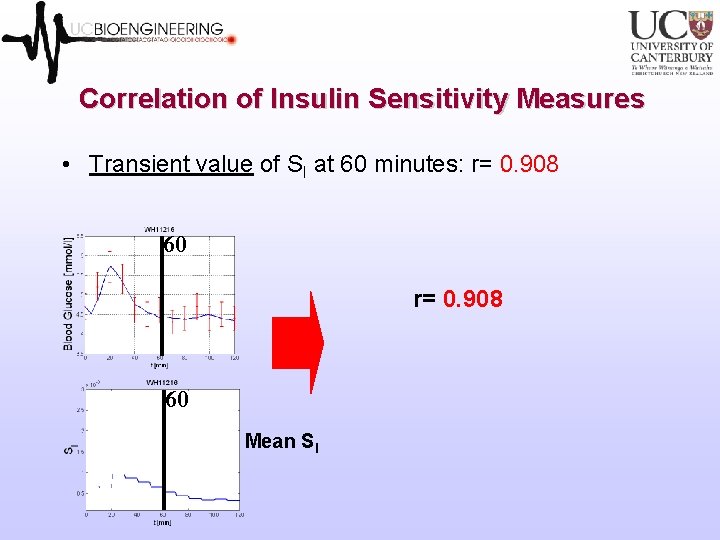
Correlation of Insulin Sensitivity Measures • Transient value of SI at 60 minutes: r= 0. 908 60 Mean SI
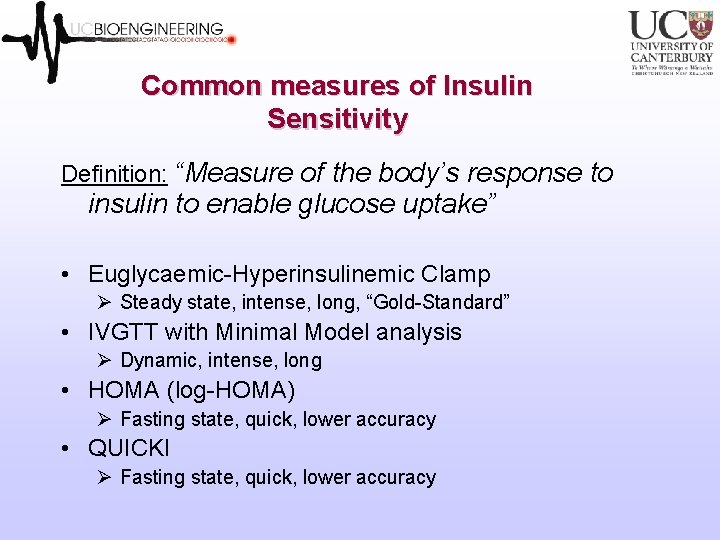
Common measures of Insulin Sensitivity Definition: “Measure of the body’s response to insulin to enable glucose uptake” • Euglycaemic-Hyperinsulinemic Clamp Ø Steady state, intense, long, “Gold-Standard” • IVGTT with Minimal Model analysis Ø Dynamic, intense, long • HOMA (log-HOMA) Ø Fasting state, quick, lower accuracy • QUICKI Ø Fasting state, quick, lower accuracy
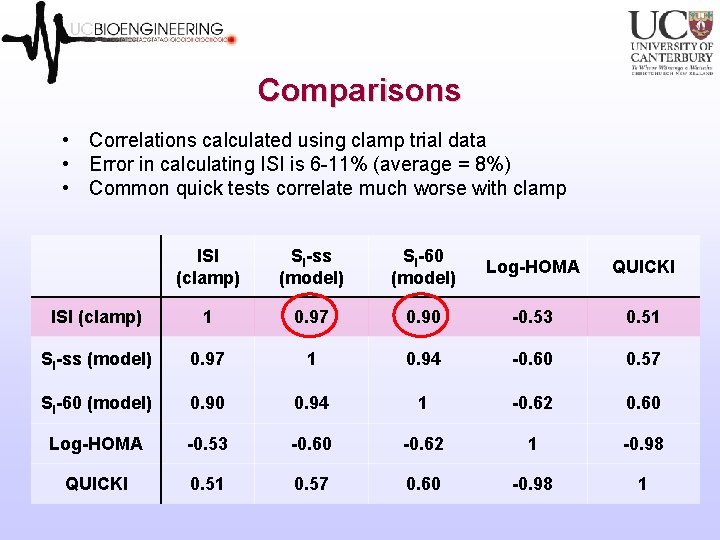
Comparisons • Correlations calculated using clamp trial data • Error in calculating ISI is 6 -11% (average = 8%) • Common quick tests correlate much worse with clamp ISI (clamp) SI-ss (model) SI-60 (model) Log-HOMA QUICKI ISI (clamp) 1 0. 97 0. 90 -0. 53 0. 51 SI-ss (model) 0. 97 1 0. 94 -0. 60 0. 57 SI-60 (model) 0. 90 0. 94 1 -0. 62 0. 60 Log-HOMA -0. 53 -0. 60 -0. 62 1 -0. 98 QUICKI 0. 51 0. 57 0. 60 -0. 98 1
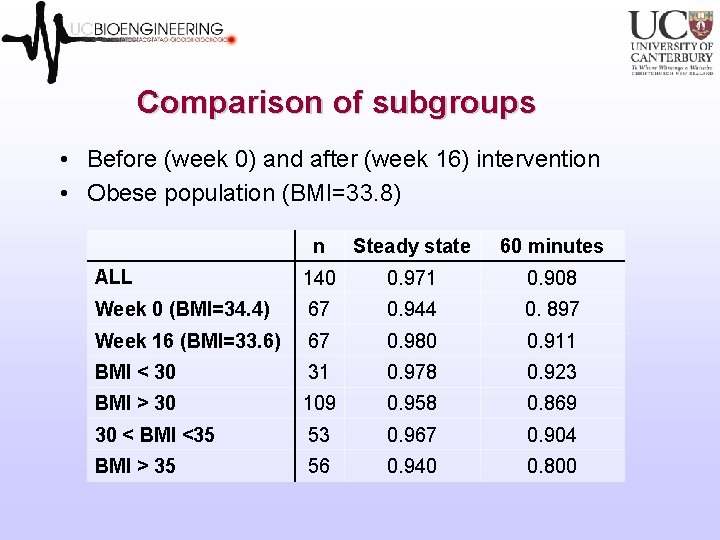
Comparison of subgroups • Before (week 0) and after (week 16) intervention • Obese population (BMI=33. 8) n Steady state 60 minutes ALL 140 0. 971 0. 908 Week 0 (BMI=34. 4) 67 0. 944 0. 897 Week 16 (BMI=33. 6) 67 0. 980 0. 911 BMI < 30 31 0. 978 0. 923 BMI > 30 109 0. 958 0. 869 30 < BMI <35 53 0. 967 0. 904 BMI > 35 56 0. 940 0. 800
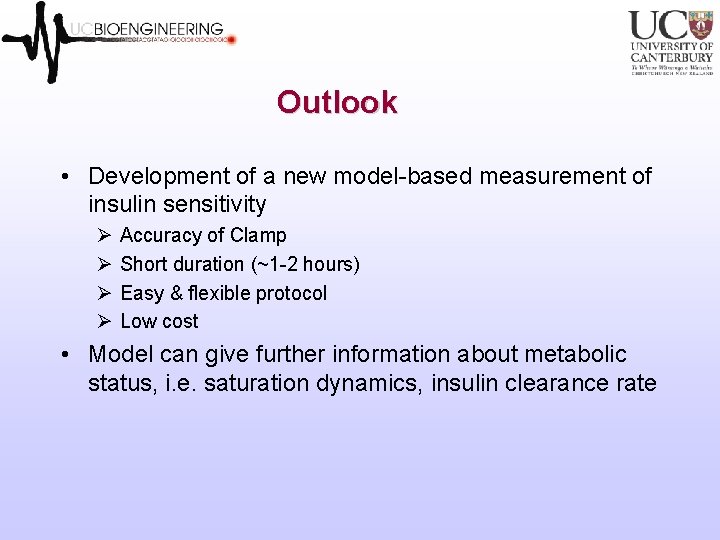
Outlook • Development of a new model-based measurement of insulin sensitivity Ø Ø Accuracy of Clamp Short duration (~1 -2 hours) Easy & flexible protocol Low cost • Model can give further information about metabolic status, i. e. saturation dynamics, insulin clearance rate
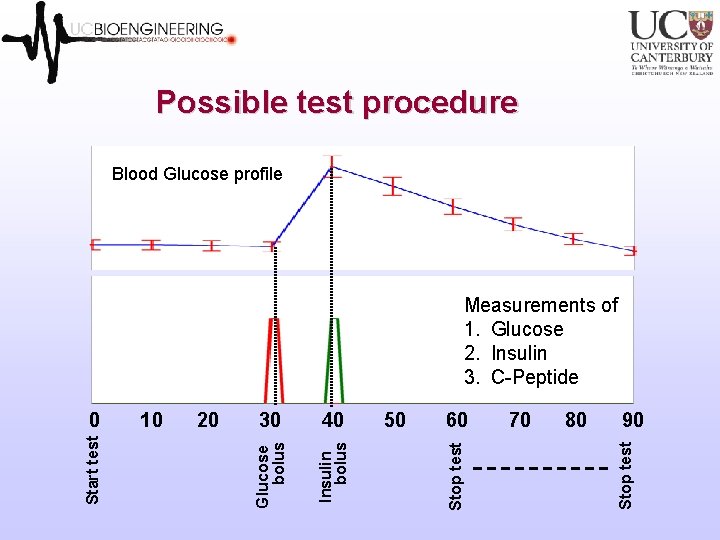
Possible test procedure Blood Glucose profile 30 40 50 60 70 80 90 Stop test 20 Stop test 10 Insulin bolus Start test 0 Glucose bolus Measurements of 1. Glucose 2. Insulin 3. C-Peptide
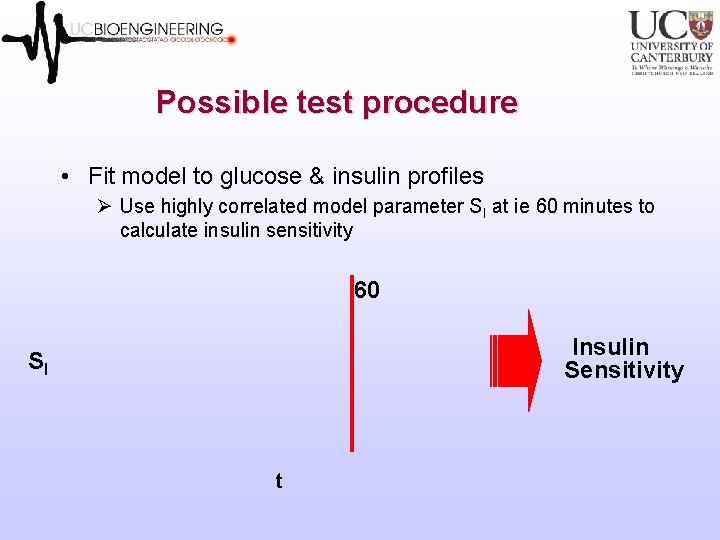
Possible test procedure • Fit model to glucose & insulin profiles Ø Use highly correlated model parameter SI at ie 60 minutes to calculate insulin sensitivity 60 Insulin Sensitivity SI t
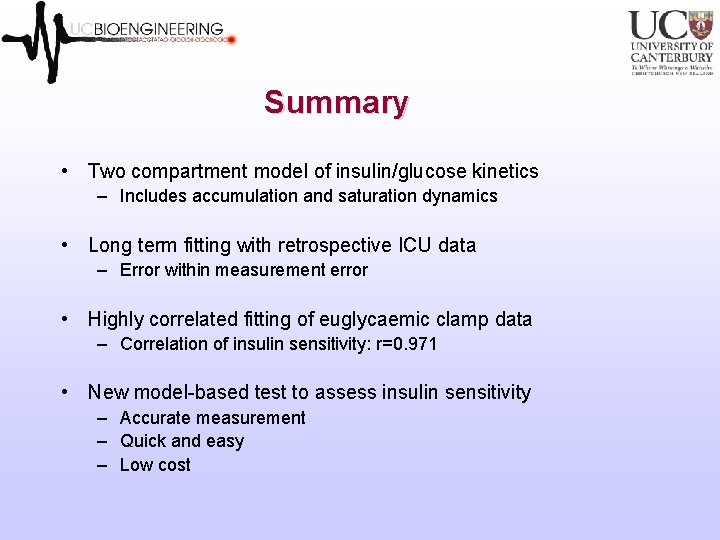
Summary • Two compartment model of insulin/glucose kinetics – Includes accumulation and saturation dynamics • Long term fitting with retrospective ICU data – Error within measurement error • Highly correlated fitting of euglycaemic clamp data – Correlation of insulin sensitivity: r=0. 971 • New model-based test to assess insulin sensitivity – Accurate measurement – Quick and easy – Low cost
Acknowledgements Engineers and Docs Dr Geoff Chase Dr Geoff Shaw Other Minions Jessica Lin Dunedin Dr Kirsten Mc. Auley Prof Jim Mann Maths and Stats The Danes Questions? Dr Steen Andreassen Dr Dominic Lee Prof Dr Chris Hann Graeme Wake