GEOGRAPHICAL INFORMATION SYSTEMS GIS Siti Kamariah Md Saat
 Siti Kamariah Md Sa’at School of Bioprocess Engineering Uni. MAP")
 • Information • System 2")
 are computerized systems designed for the")
 o a system of earth-orbiting satellites")


 o primarily")


 • Sometimes interchangeably called graphic data, consists in general")


- Slides: 28
GEOGRAPHICAL INFORMATION SYSTEMS (GIS) Siti Kamariah Md Sa’at School of Bioprocess Engineering Uni. MAP
What does GIS stand for? • Geographic (Geography) • Information • System 2
What is GIS? • Geographic Information Systems (GIS) are computerized systems designed for the storage, retrieval and analysis of geographically referenced data • A system of integrated computer-based tools for end-toend processing (capture, storage, retrieval, analysis, display) of data using location on the earth’s surface for interrelation in support of operations management, decision making, and science. • GIS uses advanced analytical tools to explore at a scientific level the spatial relationships, patterns, and processes of cultural, biological, demographic, economic, geographic, and physical phenomena
Geographic Information Technologies • Global Positioning Systems (GPS) o a system of earth-orbiting satellites which can provide precise (100 meter to sub-cm. ) location on the earth’s surface (in lat/long coordinates or equiv. ) • Remote Sensing (RS) o use of satellites or aircraft to capture information about the earth’s surface o Digital ortho images a key product (map accurate digital photos) • Geographic Information Systems (GISy) o Software systems with capability for input, storage, manipulation/analysis and output/display of geographic (spatial) information GPS and RS are sources of input data for a GIS. A GIS provides for storing and manipulating GPS and RS data.
GIS Objectives • Maximize the efficiency of planning and decision making • Provide efficient means for data distribution and handling • Elimination of redundant data base - minimize duplication • Capacity to integrate information from many sources • Complex analysis/query involving geographical referenced data to generate new information.
GIS Function Capture Store Query Analyze Display Output
GIS function • A reference framework such as a map or a network of coordinated points, lines and areas stored in digital form on a computer. • A means of inputting additional data to the computer, which is relevant to the reference framework. • A means of linking this additional data to the reference framework. • A means of analysing and manipulating both the additional data and the reference framework. • A means of outputting required information in suitable formats.
GIS Component
Tools of GIS • Hardware o Computer o Digitizer o Scanner o Printer/Plotter • Software o Desktop GIS o Internet GIS o CAD Software o Database Software • Multimedia (photos, videos, 3 D models)
GIS software
How GIS differs from CAD/CAM • CAD/CAM (Computer aided design/drafting and manufacturing) o primarily 3 -D graphic creation (engineering design) & display systems o don’t reference via geographic location o CAD sees the world as a 3 -D cube, GIS as a 3 -D sphere o limited (if any) database ability (especially for non-spatial data)
The GIS Data Model: Purpose • Allows the geographic features in real world locations to be digitally represented and stored in a database so that they can be abstractly presented in map (analog) form, and can also be worked with and manipulated to address some problem • GIS stores related geographic features in separate collections of files called map layers. Map layers can be reused easily and assembled into any number of map compositions and overlaid for analysis
The GIS Data Model: Implementation Geographic Integration of Information Administrative Boundaries Utilities Zoning Buildings Parcels Hydrography Streets Digital Orthophoto • Data is organized by layers, coverages or themes (synonomous concepts), with each layer representing a common feature. • Layers are integrated using explicit location on the earth’s surface, thus geographic location is the organizing principal.
Data Layers
GIS Data Spatial Data (where) • Sometimes interchangeably called graphic data, consists in general of natural and cultural features that can be shown with lines or symbols on maps, or seen as images on photographs. • In a GIS these data must be represented and spatially located, in digital form. Non-spatial Data (what, how much, when) • Often called as attribute or descriptive data that describe geographic region and define characteristics of spatial features within geographic region. • Nonspatial data are usually alphanumeric and provide information such as color, texture, quantity, quality, and value of features “GIS systems traditionally maintain spatial and attribute data separately, then “join” them for display or analysis”
Spatial Data & Attributes
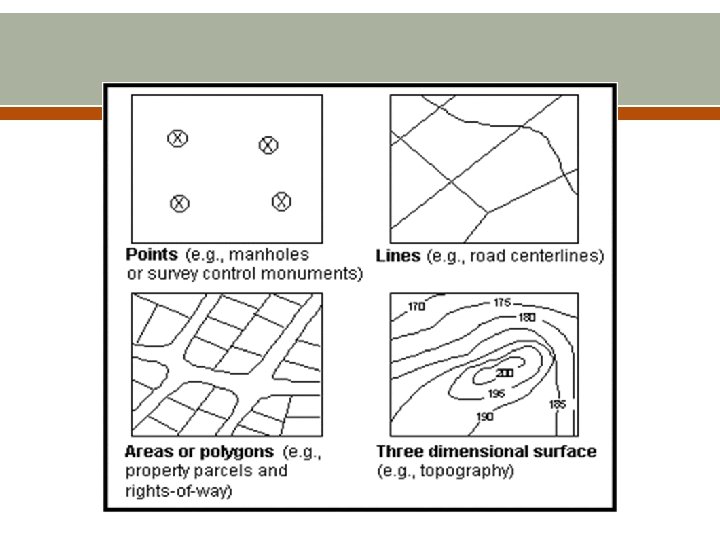
Spatial Data Representative 1. Points define single geometric locations. They are used to locate features such as houses, wells, mines, or bridges. Their coordinates give the spatial locations of points. 2. Lines and strings are obtained by connecting points. A line connects two points, and a string is a sequence of two or more connected lines. Lines and strings are used to represent and locate roads, streams, fences, property lines, etc. 3. Interior areas consist of the continuous space within three or more connected lines or strings that form a closed loop. For example, interior areas are used to represent and locate the limits of governmental jurisdictions, parcels of land ownership, different types of land cover, or large buildings.
Spatial Data Representative 4. Pixels are usually tiny squares that represent the smallest elements into which a digital image is divided. Continuous arrays of pixels, arranged in rows and columns, are used to enter data from aerial photos, orthophotos, satellite images, etc. 5. Grid cells are single elements, usually square, within a continuous geographic variable. Similar to pixels, their sizes can be varied, with smaller cells yielding improved resolution. Grid cells may be used to represent slopes, soil types, land cover, water table depths, land values, population density, and so on.
Representing Data with Raster and Vector Models Raster Model • area is covered by grid with (usually) equal-sized, square cells • attributes are recorded by assigning each cell a single value based on the majority feature (attribute) in the cell, such as land use type. • Image data is a special case of raster data in which the “attribute” is a reflectance value from the geomagnetic spectrum o cells in image data often called pixels (picture elements) Vector Model The fundamental concept of vector GIS is that all geographic features in the real work can be represented either as: • points or dots (nodes): trees, poles, fire plugs, airports, cities • lines (arcs): streams, streets, sewers, • areas (polygons): land parcels, cities, counties, forest, rock type Because representation depends on shape, Arc. View refers to files containing vector data as shapefiles
Data format: Vector and Raster Real World Raster Representation Vector Representation point line polygon
Vector vs Raster Model Raster Vector Real world
Projection, Scale, Accuracy and Resolution the key properties of spatial data • Projection: the method by which the curved 3 -D surface of the earth is represented by X, Y coordinates on a 2 -D flat map/screen o distortion is inevitable • Scale: the ratio of distance on a map to the equivalent distance on the ground o in theory GIS is scale independent but in practice there is an implicit range of scales for data output in any project • • Accuracy: how well does the database info match the real world o o Positional: how close are features to their real world location? Consistency: do feature characteristics in database match those in real world o Completeness: are all real world instances of features present in the database? • is a road in the database a road in the real world? • Are all roads included. Resolution: the size of the smallest feature able to be recognized o for raster data, it is the pixel size
Application of gis
GIS Application • • Agricultural development Land evaluation analysis Change detection of vegetated areas Analysis of deforestation and associated environmental hazards Monitoring vegetation health Mapping percentage vegetation cover for the management of land Crop acreage and production estimation Wasteland mapping
Agriculture • How can food production be improved? • GIS is used in making crop management decisions to maximize yields & minimize fertilizer input.