Genetics of qualitative and quantitative phenotypes Qualitative traits


- Slides: 24

Genetics of qualitative and quantitative phenotypes

Qualitative traits • Qualitative traits can be defined by simple discrete categories and are often under the control for just one or two loci. • In selecting for simply-inherited traits, it is important to identify genotypes of individuals for loci of interest and select those individuals with the most favourable genotypes. • Easiest to observe because an individual falls either into one discrete, descriptive, non-overlapping category or another.

• These phenotypes are controlled by one or two genes. • The alternate forms of a phenotype (for example, blue vs yellow) are produced by the alternate forms of a gene. • The normal phenotype is called the “common” or “wild-type” phenotype, while the others are referred to as “mutant” phenotypes. • Qualitative phenotypes can be divided into autosomal and sex-linked.

Autosomal phenotypes • Autosomal phenotypes are those that are controlled by genes located on an autosome. • Autosomal genes are inherited and expressed identically in males and females. • All qualitative phenotypes that have been deciphered in fish are autosomal.

Sex-linked phenotypes • Sex-linked phenotypes are controlled by genes located on the pair of chromosomes that determine sex. • Sex-linked genes are inherited and expressed differently in males and females. • Sex-linked genes are known only in ornamental fish and most information about this type of inheritance comes from guppy and platyfish.

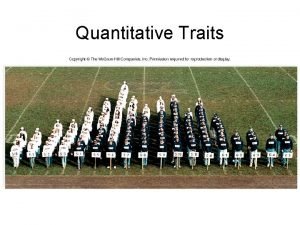
Quantitative Phenotypes (Polygenic traits) • The branch of genetics dealing with the genetic model for quantitative traits and its applications is called quantitative genetics. • It includes phenotypes that are measured, such as length, weight, and fecundity. • The important production phenotypes are quantitative ones. • Since quantitative phenotypes are measured each phenotype is a single category, such as length.

• It is controlled by numerous genes, as well as environmental variables. • The way to work with these phenotypes is to analyze the phenotypic variance that exists in the population and to divide the phenotypic variance into its component part. • Phenotypic variance (VP) is the sum of the genetic variance (VG), environmental variance (VE), and genetic-environmental interaction variance (VG-E) components. VP = VG + VE + VG-E

• Genetic variance is the sum of additive genetic variance (VA), dominance genetic variance (VD), and epistatic genetic variance (VI): VG = V A + V D + V I • Additive genetic variance (VA) are not disrupted in each generation and represents the additive effect of all the fish’s alleles taken independently i. e. , the sum of the effects that each allele makes to the production of phenotype. • Additive genetic variance is the most important component of VP, and the percentage of VP, that is controlled by VA is called “heritability” (h 2). h 2 = VA / VP

• Dominance genetic variance is the component that is due to the sum of each interaction that exists between the two alleles at each locus. • It is a function of the diploid state, and offspring inherit alleles that exist in the haploid set of chromosomes from the mother pairs with the haploid set of chromosomes from the father.

• Determining the heritability of a quantitative phenotype can be used to predict the results of a selective breeding programme by using the following formula, R=S h 2 Where R - response to selection (gain per generation), S - selection differential (the superiority of the select broodstock over the population average) h 2 -heritability.

Heritability • The ability of an individual to transmit its phenotype to the next generation can be viewed as heritability. • It is used in the study of metric characters for prediction of performance of the progeny. • It expresses the reliability of the phenotypic value as a guide to the breeding value.

• It is the degree of correspondence between the phenotypic value and the breeding value of the character. • It is computed as the ratio of additive genetic variance and phenotypic variance. h 2= VA/VP • It is also expressed as the regression of breeding value on phenotypic value (b. AP). • The main use of h 2 is that an individual’s estimated breeding value (A) can be known from its phenotypic value (P), A = h 2 P.

Properties of heritability • It is the property of a character. Characters of fertility and reproduction usually have low heritability. Characters of growth and conformation have high heritability. • The populations have actual gene frequency differences, which are reflected in the magnitude of the variance components used for h 2 calculation. Hence, heritability is also a property of the population.

• The environment where the population is reared influences the magnitude of variance components. More variable conditions in environment decrease the h 2 estimate whereas more uniformity increases it. • Inbreeding in a population also decreases the heritability estimate due to increased genetic uniformity and increase in environmental variance.

General combining ability • When there are several lines or sub-populations, the general combing ability (GCA) of a line is calculated by crossing one line with many lines separately and expressing the average of the crosses as a deviation from population mean. • The GCA indicates the additive genetic effect for the character in the line.

Specific combining ability • When the lines are crossed among themselves, the superiority or inferiority of a cross over the mean of all crosses indicates the specific combining ability (SCA) of the cross. • When the lines or sub-populations are mated in all possible combinations, it is known as ‘diallel mating’. • In a diallel mating design it is possible to calculate the GCA of the lines and SCA of the crosses. • It is done to test the performance of the lines in cross combinations.

Heterosis or hybrid vigour • It is a phenomenon observed in cross bred population. • When the lines or sub-populations are crossed, the mean of the crossed progeny for one or more character becomes more than the average of the parental lines in most of the cases known as ‘heterosis’ or ‘hybrid vigour’. • Heterosis is due to non- additive gene action in the character. • It is the opposite of the inbreeding depression that is observed due to inbreeding in the lines.

Phenotypic Value • The value observed when a character is measured on an individual is that phenotypic value of the individual. • The mean, variance and covariance are based on the phenotypic value of the character. P = G + E, where, P - phenotypic value, G - genotypic value and E - environmental deviation.

Genotypic Value • Genotype is the particular assemblage of genes possessed by an individual. • Genotypic value is attributable to the influence of the genotype. • The genotype of the individual confers certain value to the individual, which is called the genotypic value.

Environmental deviation • The genotype confers a certain value on the individual and environment causing a deviation. • So it is known as environmental deviation in the population. • The mean environmental deviation would be equal to the genotypic value.

Average effect • Transmission of values from parents to offspring can be assessed by a new measure of values that will refer to genes and not to genotypes. • This enables us to assign a ‘breeding value’ to individuals, a value associated with the genes carried by the individual and transmitted to its offspring. • The new value associated with the genes is known as ‘average effect’.

Breeding Value • Breeding value is defined as parental value - the value of an individual as a contributor of genes to the next generation. • It represents only that part of genotypic value that can be transmitted from parent to offspring. The breeding value A = 2 (P-H), where P - progeny average of the individual, H - population average.

Population It is defined as an intraspecific (within a species) group of randomly mating individuals which exists (and can therefore be sampled) in a defined geographic position or at a defined time.

THANK U
 Qualitative traits vs quantitative traits
 Qualitative traits vs quantitative traits
 Qualitative traits vs quantitative traits
 Quantitative and qualitative traits
 Punnett square percentages
 Achillea millefolium
 Punnett square for color blindness
 Narrative report with contextual descriptions
 Qualitative vs quantitative
 Difference between qualitative and quantitative data
 Definition of qualitative and quantitative observations
 Qualitative needs assessment
 Qualitative variables and quantitative variables
 Qualitative and quantitative data analysis
 Quantitative and qualitative variables examples
 Quantitative test for lipids
 Qualitative vs quantitative observation
 Similarities between qualitative and quantitative research
 Similarities between qualitative and quantitative research
 Qualitative properties of matter
 Qualitative and quantitative difference
 Qualitative and quantitative difference
 What is the sample size in qualitative research?
 Research content example
 Purpose of qualitative research


