Gary Radloff Sheldon Du Pam Porter and Troy


")


 Residue Quantity")


- Slides: 19
Gary Radloff, Sheldon Du, Pam Porter and Troy Runge
Agenda • Background: Research for WI Energy Office • Quality – Survey on sample properties – Impact on conversion limitations • Quantity – Where is the biomass? – How much is available? At what cost? • Impact to current business and next steps
Theme and Topics • Planning a transition to new energy economy • Biomass is already WI leading renewable energy source – Have abundant supply for the future • Biogas leading opportunity: On-Farm AD, Wastewater Treatment Plants AD, and Landfill Diversions and CHP combinations & thermal • Need supportive public policy to achieve success in Wisconsin
Simplified Conversion Pathways Biomass to Energy/Fuels Wood Residuals Combustion Grasses & Corn Stover Pyrolysis / Gasification Solid fuels Manure Saccharification & fermentation Liquid fuels Solid Waste Anaerobic digestion Gaseous fuels Primary Heat & Power Secondary Transportation
Wisconsin Biomass Numbers Biomass Type / Estimate methodology Million Dry Tons/year Corn Stover Estimates NASS Data 2. 81 BTS Data@$60/MT 2. 49 Wood Residuals TPO Roundwood 1. 29 TPO Harvest residuals 1. 52 Energy Crops BTS Woody@$60/MT 2. 29 BTS Grasses@$80/MT 0. 15 WBA Fallow Hay/CRP 3. 13 Manure NASS Dairy Aus 4. 77
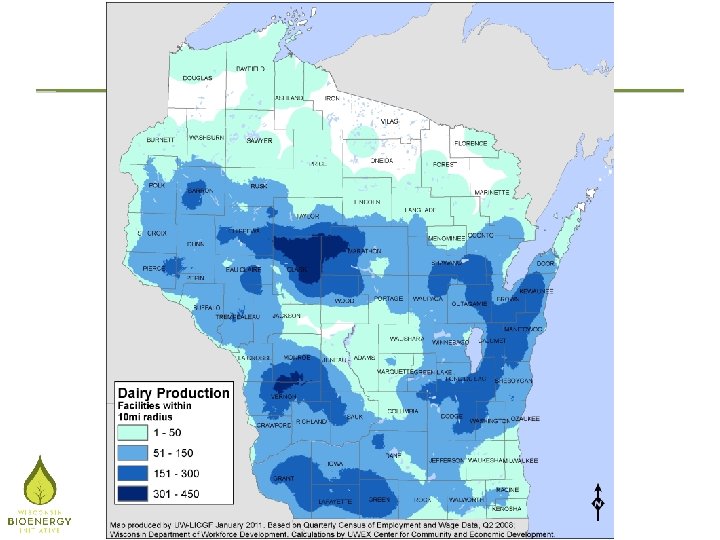
Biomass Opportunities • Identified top counties with biomass densities • Looked for natural groupings • Used circles to identify processing sites >200, 000 tons/year
Quality - Biomass Analyses • Proximate Analysis – Moistures, Volatile Matter, Fixed Carbon, Ash • Heating Value • Ultimate Analysis – C, H, N, O, S • • Cl, Hg, Mineral Ash Analysis Crude Protein Carbohydrate Lignin
Identified Thermal Conversion Issues Fuel Characteristic unit Woody Herbaceous Residuals Moisture (% wt wb) 2. 74% - 49. 94% 2. 45% - 18. 32% 6. 96% - 28. 62% LHV Btu/lb 3200 - 8946 5926 - 6923 5019 - 8145 Ash (% wt db) 0. 63% - 9. 33% 2. 66% - 10. 83% 5. 21% - 19. 38% N ppm db 200 - 10200 3700 - 15500 2500 - 42700 S ppm db 110 - 670 370 - 3130 1400 - 8590 Cl ppm db 19 - 617 293 - 6516 786 - 12550 Hg ppm db <0. 001 - 0. 024 <0. 001 - 0. 017 <0. 001 - 0. 027 Fouling Index lb alkali/MMBtu 0. 099 - 1. 471 0. 227 - 1. 919 0. 314 - 1. 482
Quality Summary • Link known technologies with Biomass based on quantity • Thermochemical Woody & Woody Waste – Combustion – Gasification • Biological Herbaceous & Herbaceous Waste – Fermentation – Anaerobic digestion
Biomass Opportunities • Manure assumed to be on CAFOs
Woody Biomass Economic Scenarios • Residuals and pulpwood markets – RPS demand for woody biomass – Biofuel feedstock demand – Pulpwood demand from pulp/paper industry – Mill capacity expands or contracts by 10% • Potential overlaps – High bioenergy demand – Expanding pulp/paper markets
Analysis Framework-Scenarios Price Sawlogs Pulp/Paper industry demand Pulpwood Bioenergy demand (RPS, RFS…) Residue Quantity
Impact to Existing Industry • Most developed biomass industry is forest products • Wisconsin has a large pulp & paper industry • What would the impact of increased woody biomass demand be? Roundwood (MCF) Sawlogs Pulpwood 360. 8 98. 2 (27%) 250. 8 (70%) Source: Wisconsin Timber Industry: An Assessment of Timber Product Output and Use in 2003. http: //nrs. fed. us/pubs/rb/rb_nrs 19. pdf
Impact on NW Region Pulpwood Market 200. 0 180. 0 174. 5 Region 3 Pulpwood Prices ($/ton) 160. 0 142. 3 140. 0 130. 2 120. 0 110. 0 100. 0 97. 9 87. 2 80. 0 85. 8 65. 6 60. 0 53. 5 42. 8 40. 0 21. 3 20. 0 200, 000 300, 000 0. 0 400, 000 500, 000 600, 000 700, 000 800, 000 Biomass Demand for T-C Conversion (tons) 10% pulping capacity decrease no capacity change 900, 000 1, 100, 000 10% capacity increase
Conclusions Wisconsin has a large amount of biomass available for bioenergy projects • Pockets of high density biomass create opportunities for aggregation • Woody biomass is only source tested to consistently have quality need for thermal conversion • With a developed forest products industry only wood residuals can be used without impacting regional wood prices – NW region of WI - 2 plants at 200, 000 ton/year each – NE region of WI - 1 plants at 200, 000 ton/year each
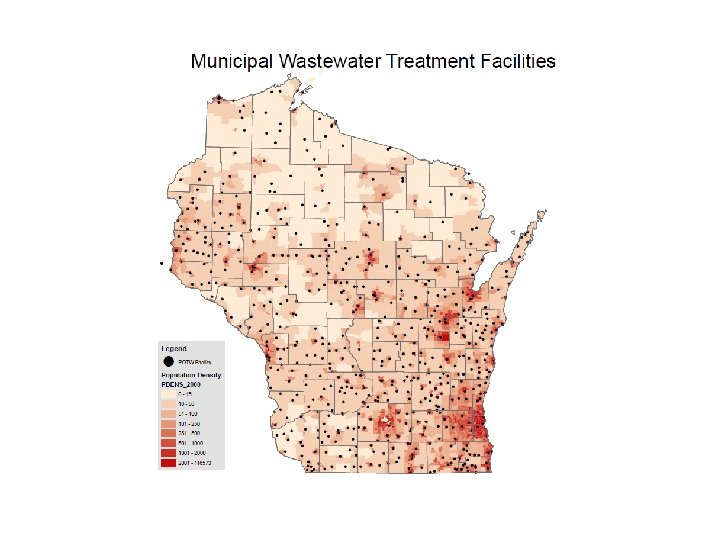
Conclusions Part II WI should look to investments in waste handling and processing as opportunities for energy production (wastewater treatment, landfills and industrial sites). • Biomass feedstock manure is already aggregated at CAFOs and farms, these are logical energy sites • Small to mid-size thermal is cost competitive today with propane and heating oil. WI can do much more. • Tipping Point for WI: A highly vulnerable economy dependent on global energy or innovative domestic leadership in biogas, thermal, CHP and microgrids.
Gary Radloff gradloff@wbi. wisc. edu