Finance and Logistics John H Vande Vate Spring


- Slides: 30
Finance and Logistics John H. Vande Vate Spring, 2005 1 1
The Real Contest • Financing (Money) is the fuel of business • Everyone competes in the financial markets • Logistics only really matters to top management if it improves financial performance 2 2
What Drives Share Price • • Revenue Growth Profitability Capital Utilization Cash Flow 3 3
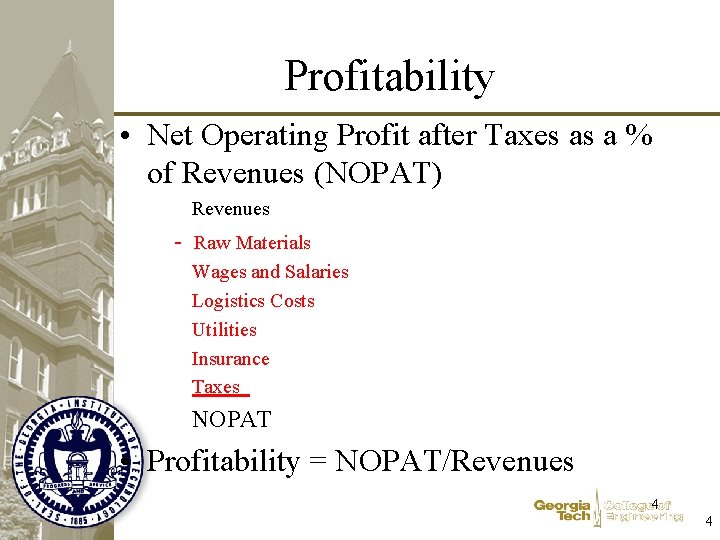
Profitability • Net Operating Profit after Taxes as a % of Revenues (NOPAT) Revenues - Raw Materials Wages and Salaries Logistics Costs Utilities Insurance Taxes NOPAT • Profitability = NOPAT/Revenues 4 4
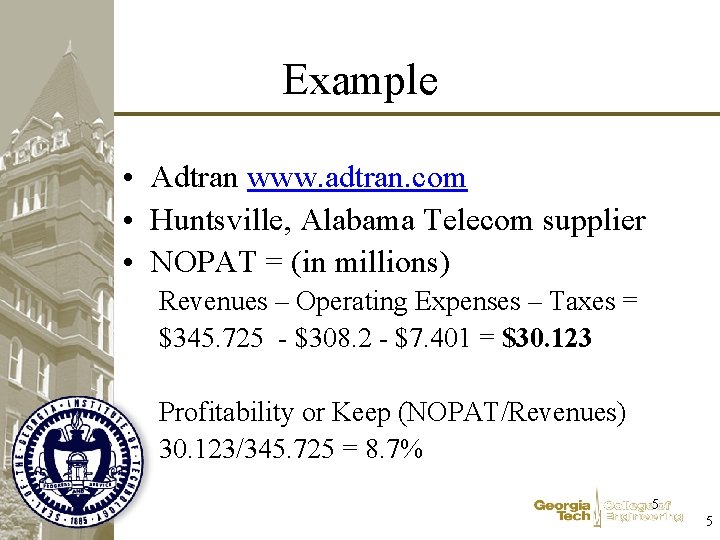
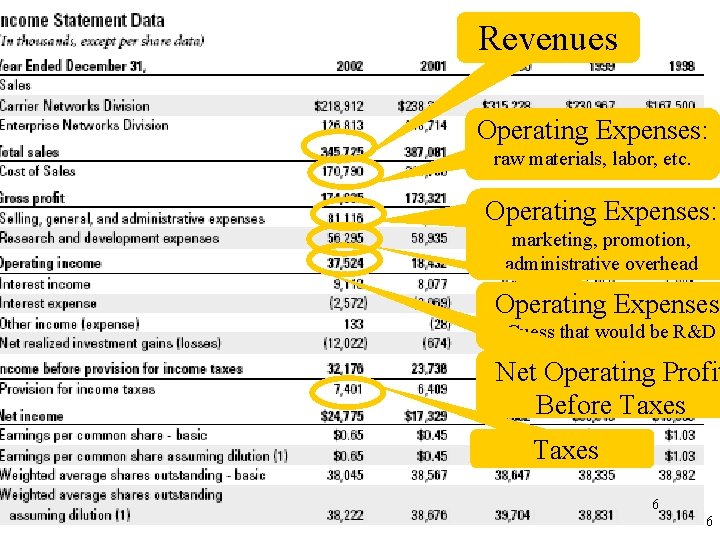
Example • Adtran www. adtran. com • Huntsville, Alabama Telecom supplier • NOPAT = (in millions) Revenues – Operating Expenses – Taxes = $345. 725 - $308. 2 - $7. 401 = $30. 123 Profitability or Keep (NOPAT/Revenues) 30. 123/345. 725 = 8. 7% 5 5
Revenues Operating Expenses: raw materials, labor, etc. Operating Expenses: marketing, promotion, administrative overhead Operating Expenses: Guess that would be R&D Net Operating Profit Before Taxes 6 6
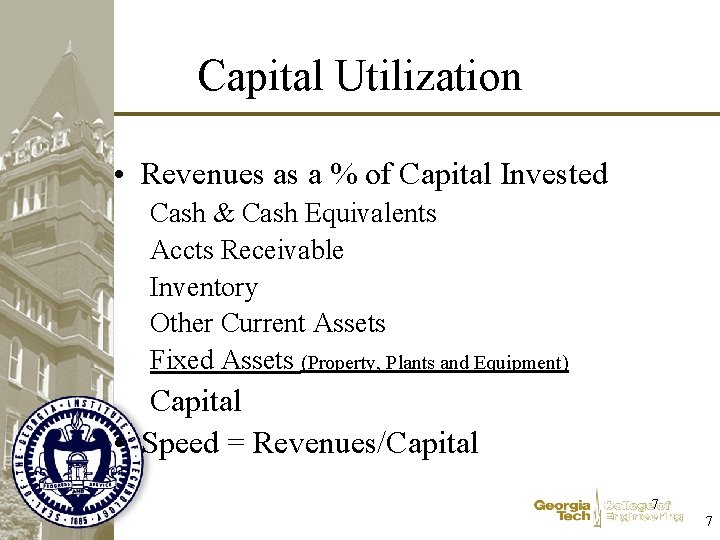
Capital Utilization • Revenues as a % of Capital Invested Cash & Cash Equivalents Accts Receivable Inventory Other Current Assets Fixed Assets (Property, Plants and Equipment) Capital • Speed = Revenues/Capital 7 7
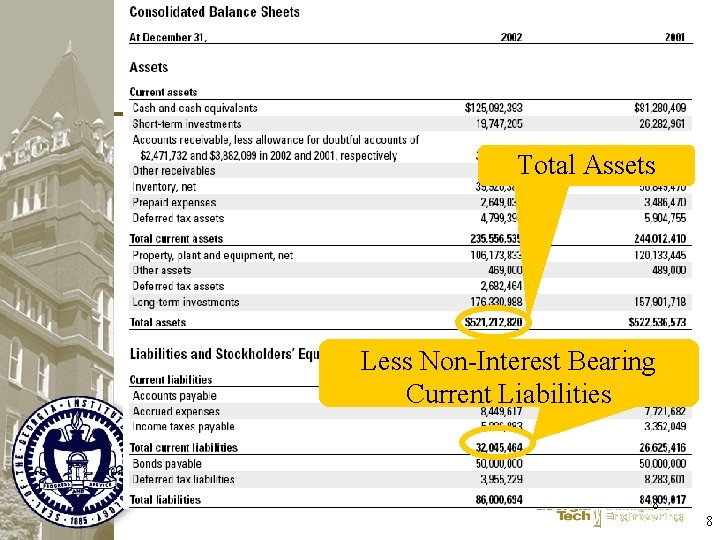
Total Assets Less Non-Interest Bearing Current Liabilities 8 8
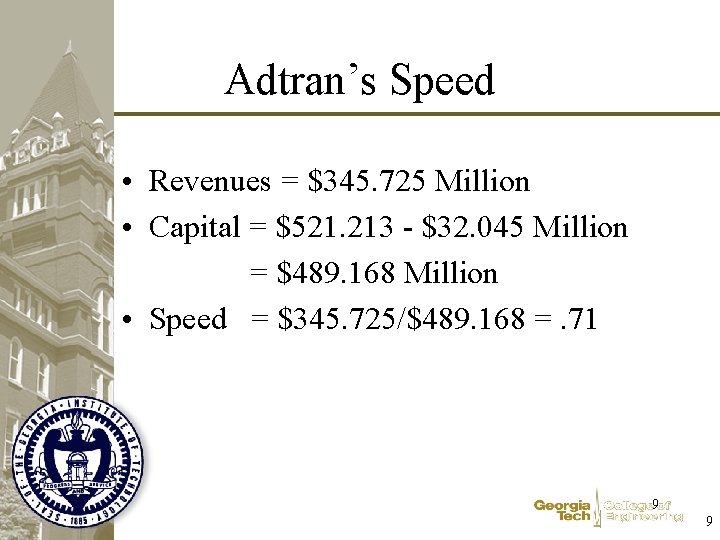
Adtran’s Speed • Revenues = $345. 725 Million • Capital = $521. 213 - $32. 045 Million = $489. 168 Million • Speed = $345. 725/$489. 168 =. 71 9 9
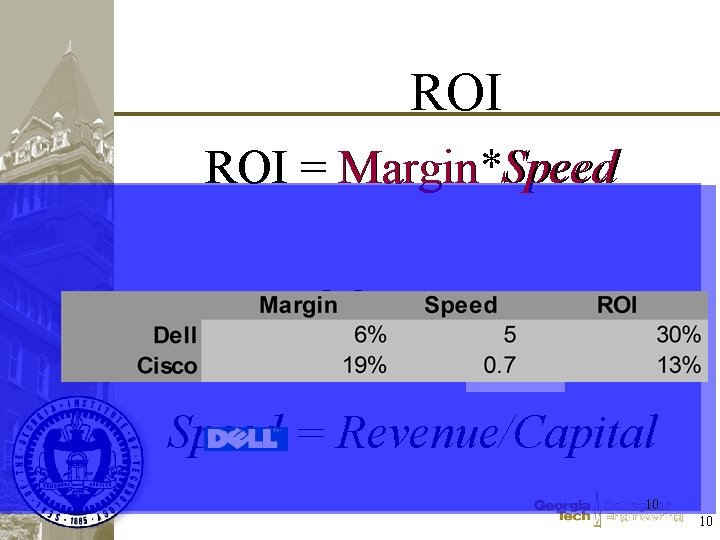
ROI = Margin*Speed Margin = NOPAT/Revenue Speed = Revenue/Capital 10 10
Capital Charge • Annualizing Capital Investments • Cost of Capital • Combination of – Fair return to bond holders (creditors) – Fair return to share holders (owners) • Which return is higher? • Why? 11 11
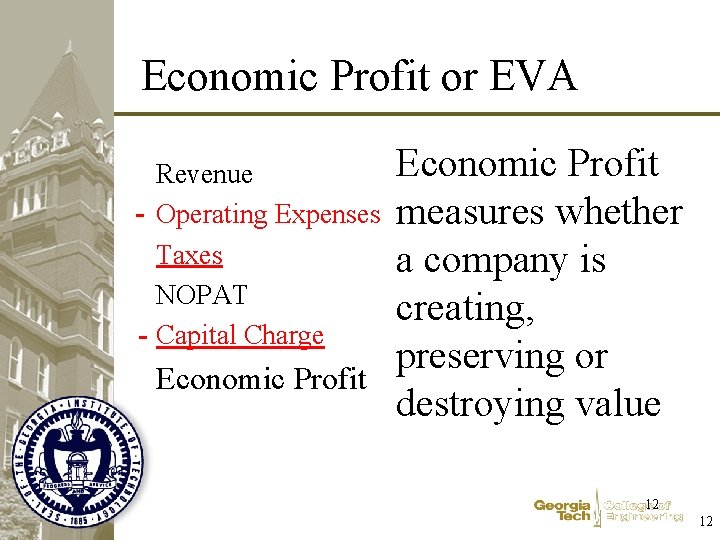
Economic Profit or EVA Revenue - Operating Expenses Taxes NOPAT - Capital Charge Economic Profit measures whether a company is creating, preserving or destroying value 12 12
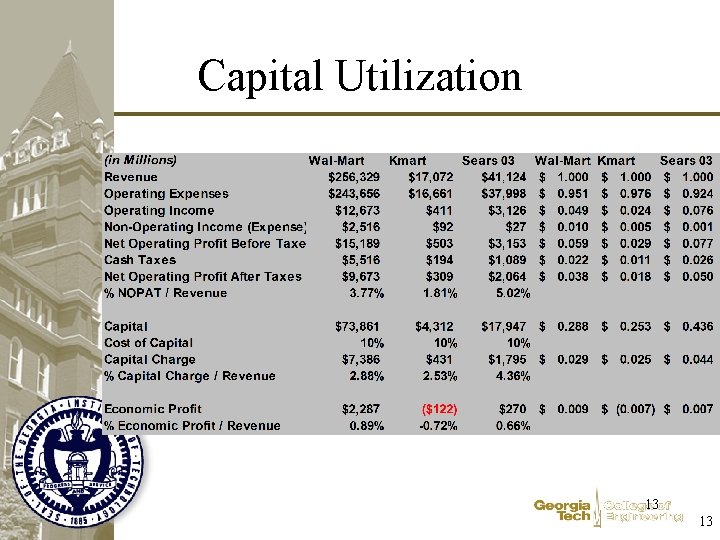
Capital Utilization 13 13
Operating Aspects of Capital • • Inventory Accounts Receivable Accounts Payable. . . 14 14
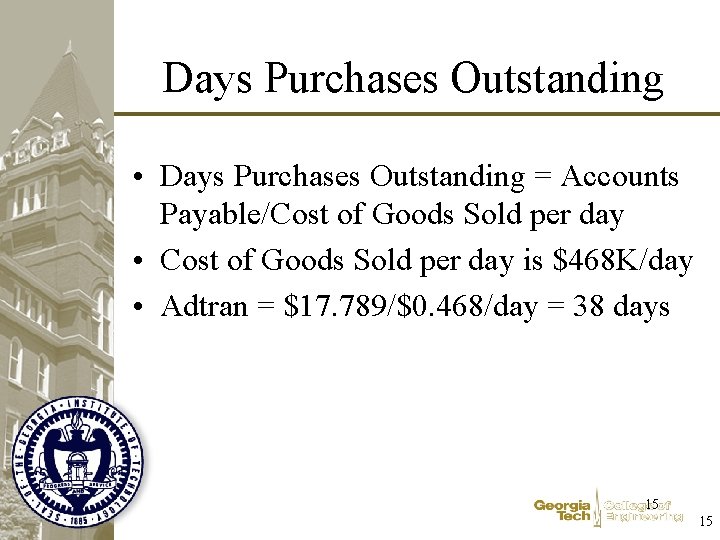
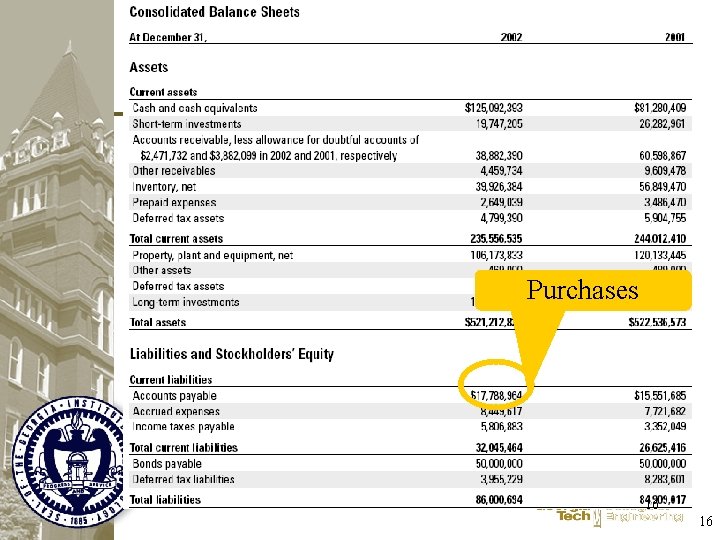
Days Purchases Outstanding • Days Purchases Outstanding = Accounts Payable/Cost of Goods Sold per day • Cost of Goods Sold per day is $468 K/day • Adtran = $17. 789/$0. 468/day = 38 days 15 15
Adtran Example Purchases 16 16
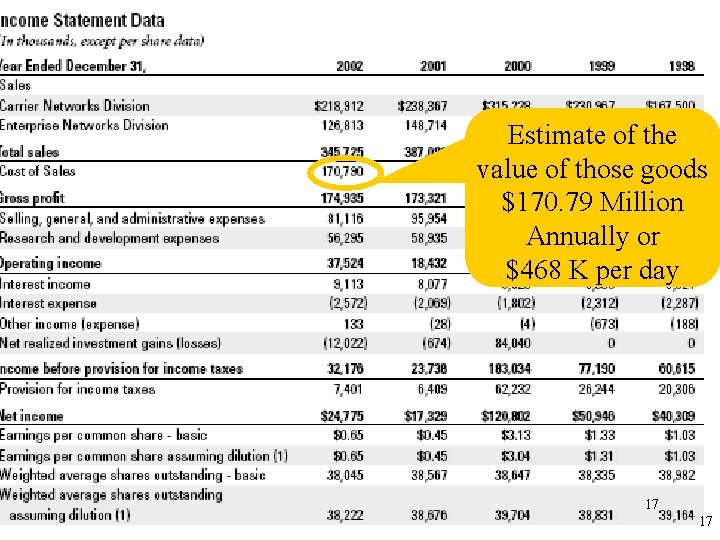
Estimate of the value of those goods $170. 79 Million Annually or $468 K per day 17 17
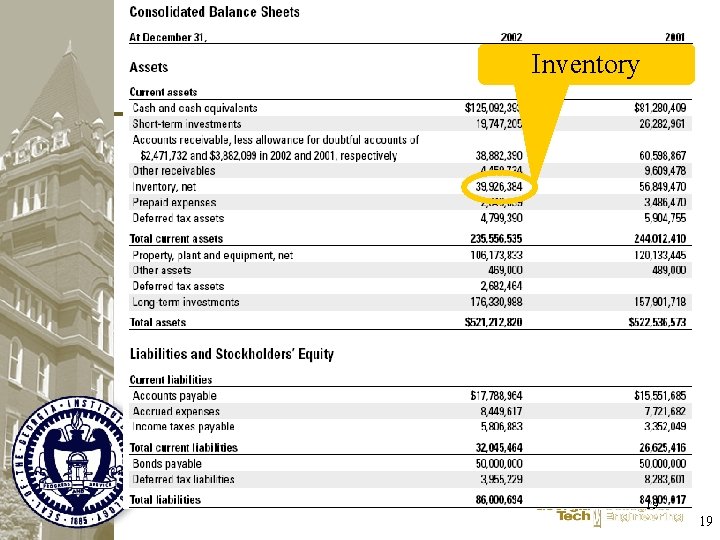
Adtran Days of Inventory • Inventory = $39. 926 Million • Value of one days sales = $468 K/day • Days of sales in Inventory = $39. 926/$0. 468/day = ~85 days 18 18
Adtran Example Inventory 19 19
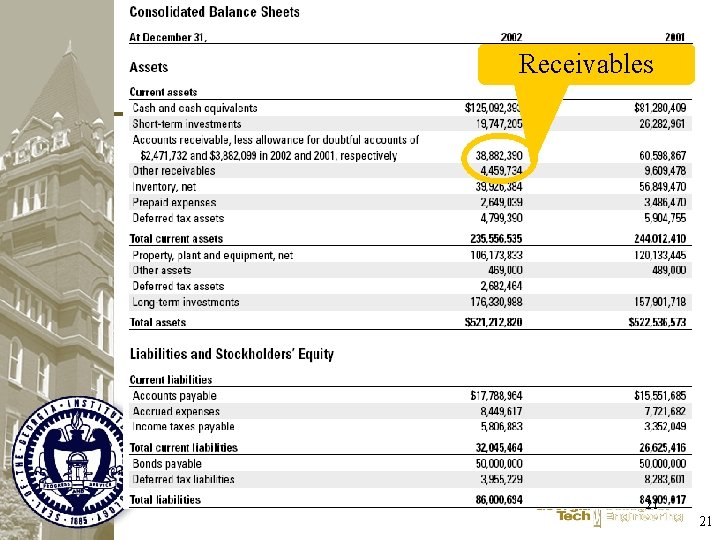
Days Sales Outstanding • Accounts Receivable/Daily Revenues • Adtran $43. 342 Million in Receivables $345. 725 Million in Annual Sales $0. 947 Million in sales per day Days Sales Outstanding = $43. 342/$0. 947/day = 45. 8 days 20 20
Adtran Example Receivables 21 21
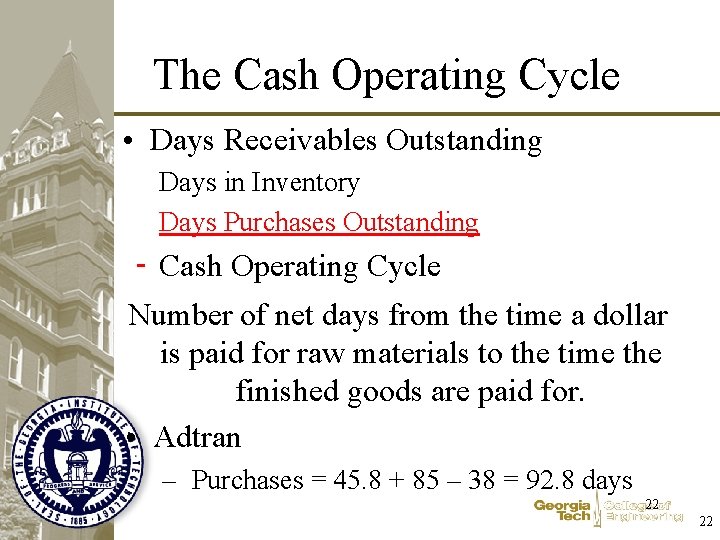
The Cash Operating Cycle • Days Receivables Outstanding Days in Inventory Days Purchases Outstanding - Cash Operating Cycle Number of net days from the time a dollar is paid for raw materials to the time the finished goods are paid for. • Adtran – Purchases = 45. 8 + 85 – 38 = 92. 8 days 22 22
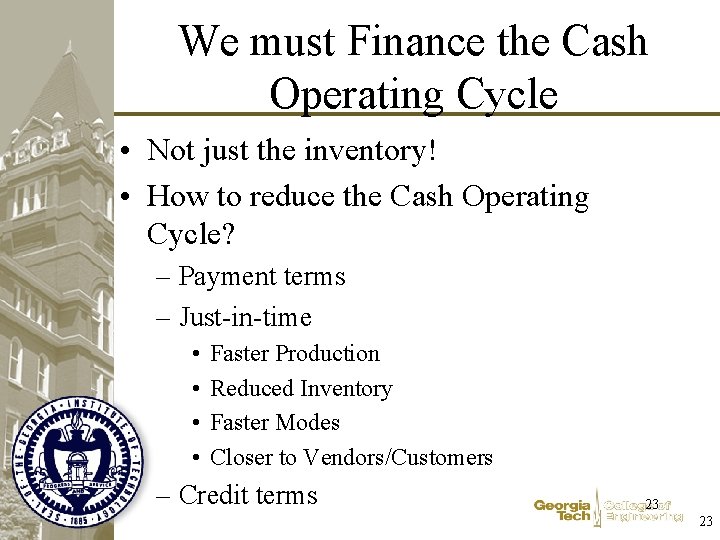
We must Finance the Cash Operating Cycle • Not just the inventory! • How to reduce the Cash Operating Cycle? – Payment terms – Just-in-time • • Faster Production Reduced Inventory Faster Modes Closer to Vendors/Customers – Credit terms 23 23
Extremes 24 24
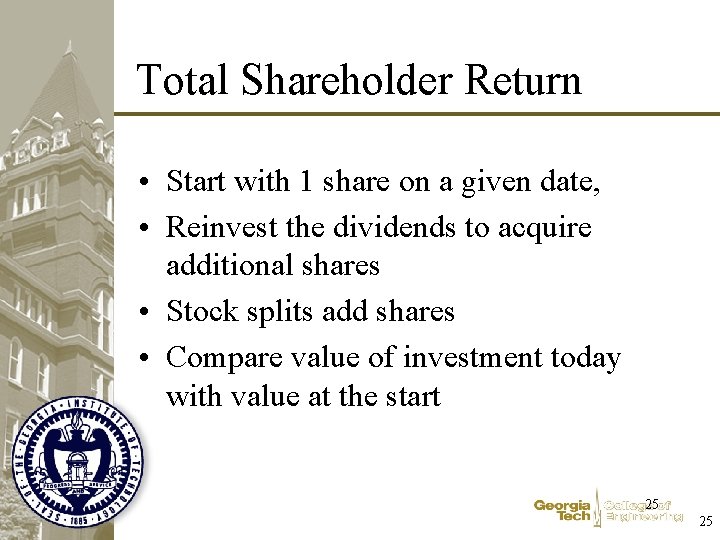
Total Shareholder Return • Start with 1 share on a given date, • Reinvest the dividends to acquire additional shares • Stock splits add shares • Compare value of investment today with value at the start 25 25
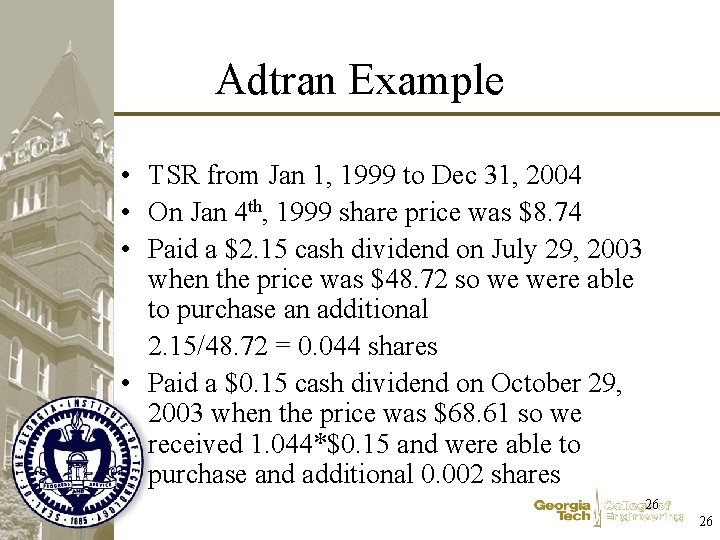
Adtran Example • TSR from Jan 1, 1999 to Dec 31, 2004 • On Jan 4 th, 1999 share price was $8. 74 • Paid a $2. 15 cash dividend on July 29, 2003 when the price was $48. 72 so we were able to purchase an additional 2. 15/48. 72 = 0. 044 shares • Paid a $0. 15 cash dividend on October 29, 2003 when the price was $68. 61 so we received 1. 044*$0. 15 and were able to purchase and additional 0. 002 shares 26 26
Adtran Example Cont’d • 2: 1 stock split on December 16, 2003 so we now have 2*(1+0. 044+0. 002) =2. 092 shares • Paid a $0. 08 cash dividend on January 30, 2004 when the price was $34. 42 so we were able to purchase 2. 092*0. 08/34. 42 =. 005 additional shares • Paid a $0. 08 cash dividend on April 30, 2004 when the price was $24. 52 so we were able to purchase 2. 097*0. 08/24. 52 =. 007 additional shares 27 27
Adtran Example Cont’d • Paid a $0. 08 cash dividend on July 30, 2004 when the price was $26. 71 so we were able to purchase 2. 104*0. 08/26. 71 =. 006 additional shares • Paid a $0. 08 cash dividend on October 29, 2004 when the price was $21. 60 so we were able to purchase 2. 110*0. 08/21. 60 =. 008 additional shares • Closed at $19. 14 on December 31, 2004 28 28
TSR • Started with $8. 74 on January 4, 1999 • Ended with 2. 118 shares each worth $19. 14 on December 31, 2004 • Starting value $8. 74 • Ending Value $40. 54 • TSR = (40. 54 -8. 74)/8. 74 = 364% • CAGR = 24% 29 29
An Example 30 30