
Global Supply Chain Design John H Vande Vate
Global Supply Chain Design John H. Vande Vate Spring 2005 1

Basics of SC Design • EU Ports Case – Where to manufacture? • • Asia EU Central EU Eastern EU – Which ports to use? – Where to locate DCs? 2

Context • Almost Greenfield study – Fixed pool points • Aggregate study – Demand aggregated to pool points by population and per capita income – Products aggregated to a single product • Time – Growth? Seasonality? Life cycle? Labor rates? 3

Our Job • Recommend a high-level supply chain design • Provide estimates of costs for comparisons and to weigh risks • Identify where to focus effort in more detailed assessment 4

Questions Hierarchy of costs? 5
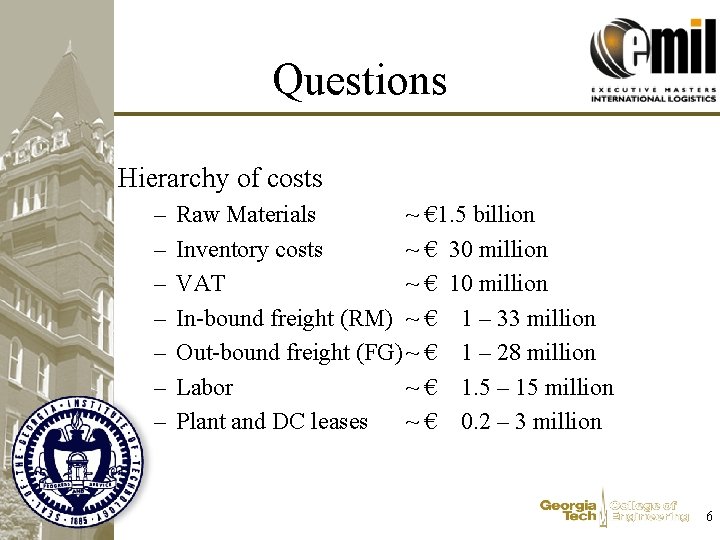
Questions Hierarchy of costs – – – – Raw Materials ~ € 1. 5 billion Inventory costs ~ € 30 million VAT ~ € 10 million In-bound freight (RM) ~ € 1 – 33 million Out-bound freight (FG) ~ € 1 – 28 million Labor ~ € 1. 5 – 15 million Plant and DC leases ~ € 0. 2 – 3 million 6

Questions • Hierarchy of confidence/indifference – What data are you most sure of or care the least about http: //www. isye. gatech. edu/~jvandeva/Classes/6203/HW 1 7
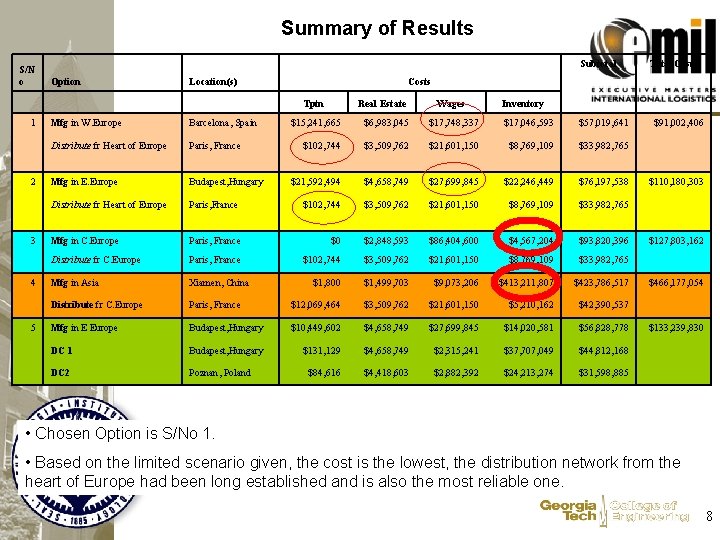
Summary of Results Subtotal S/N o Option Location(s) Mfg in W. Europe Barcelona, Spain Distribute fr Heart of Europe Paris, France Mfg in E. Europe Budapest, Hungary Distribute fr Heart of Europe 1 Total Costs Tptn Real Estate Wages Inventory $15, 241, 665 $6, 983, 045 $17, 748, 337 $17, 046, 593 $57, 019, 641 $102, 744 $3, 509, 762 $21, 601, 150 $8, 769, 109 $33, 982, 765 $21, 592, 494 $4, 658, 749 $27, 699, 845 $22, 246, 449 $76, 197, 538 Paris, France $102, 744 $3, 509, 762 $21, 601, 150 $8, 769, 109 $33, 982, 765 Mfg in C. Europe Paris, France $0 $2, 848, 593 $86, 404, 600 $4, 567, 204 $93, 820, 396 Distribute fr C. Europe Paris, France $102, 744 $3, 509, 762 $21, 601, 150 $8, 769, 109 $33, 982, 765 Mfg in Asia Xiamen, China $1, 800 $1, 499, 703 $9, 073, 206 $413, 211, 807 $423, 786, 517 Distribute fr C. Europe Paris, France $12, 069, 464 $3, 509, 762 $21, 601, 150 $5, 210, 162 $42, 390, 537 Mfg in E Europe Budapest, Hungary $10, 449, 602 $4, 658, 749 $27, 699, 845 $14, 020, 581 $56, 828, 778 DC 1 Budapest, Hungary $131, 129 $4, 658, 749 $2, 315, 241 $37, 707, 049 $44, 812, 168 DC 2 Poznan, Poland $84, 616 $4, 418, 603 $2, 882, 392 $24, 213, 274 $31, 598, 885 2 3 4 5 $91, 002, 406 $110, 180, 303 $127, 803, 162 $466, 177, 054 $133, 239, 830 • Chosen Option is S/No 1. • Based on the limited scenario given, the cost is the lowest, the distribution network from the heart of Europe had been long established and is also the most reliable one. 8

DC Inventory Costs • Average Inventory Formula The reasoning behind this formula is the basic b*h/2 formula for the area of a triangle. Our period is 3 days long here, so each triangle gets 1/3 of a period. Q 1/(3*2) + Q 2/(3*2) + Q 3/(3*2) 9
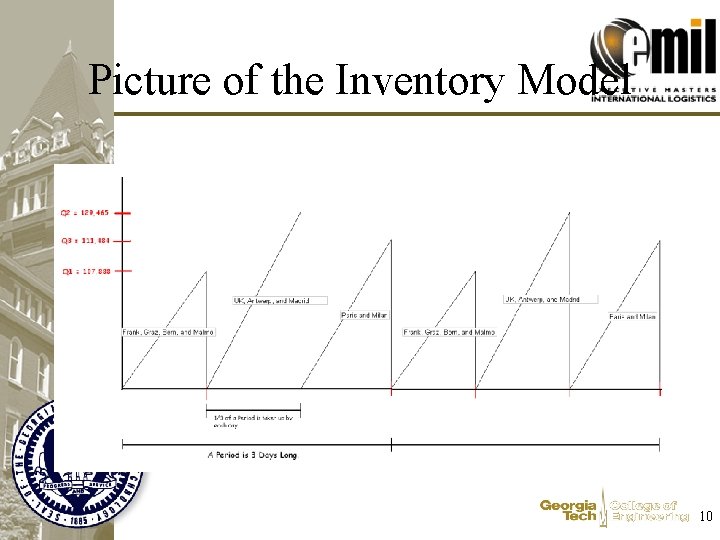
Picture of the Inventory Model 10
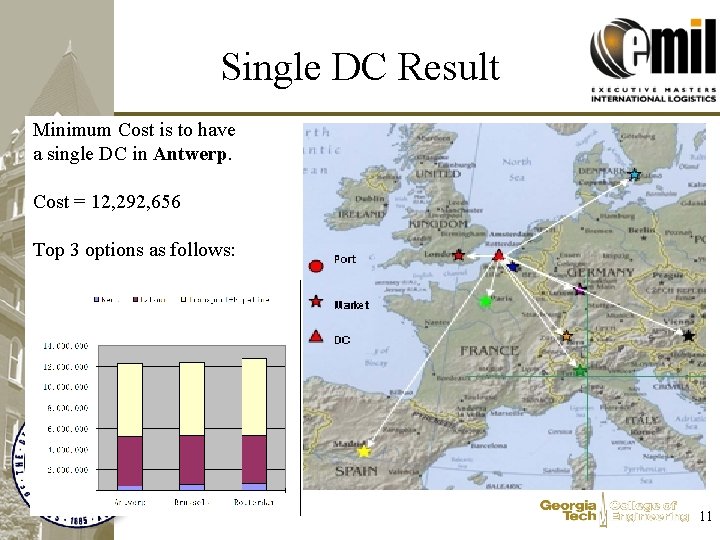
Single DC Result Minimum Cost is to have a single DC in Antwerp. Cost = 12, 292, 656 Top 3 options as follows: 11
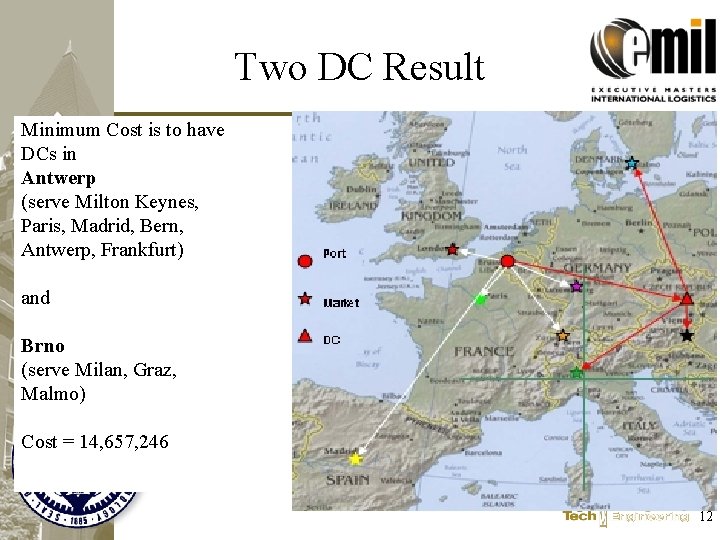
Two DC Result Minimum Cost is to have DCs in Antwerp (serve Milton Keynes, Paris, Madrid, Bern, Antwerp, Frankfurt) and Brno (serve Milan, Graz, Malmo) Cost = 14, 657, 246 12

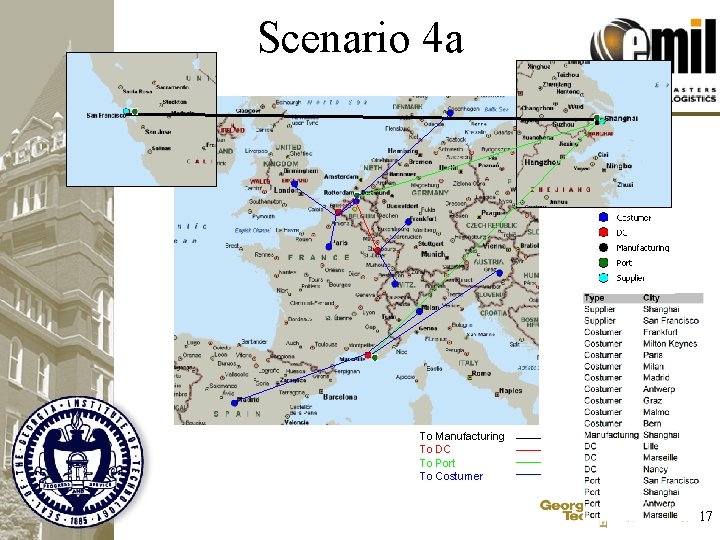
Material flow map of proposed solution 13
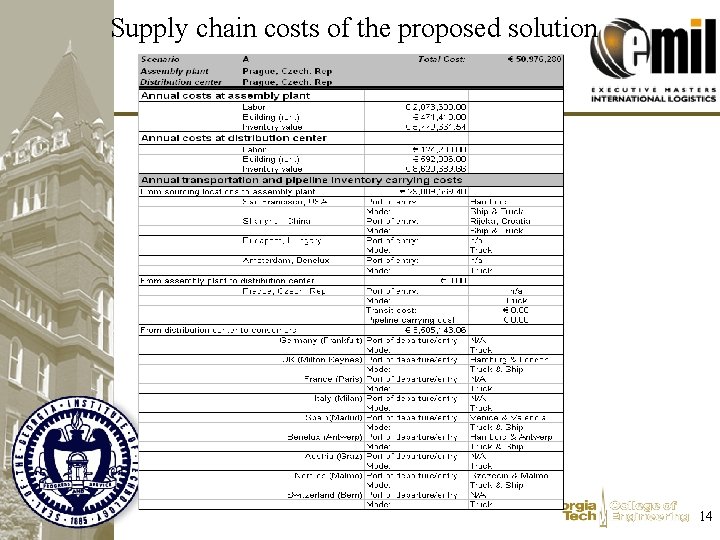
Supply chain costs of the proposed solution 14
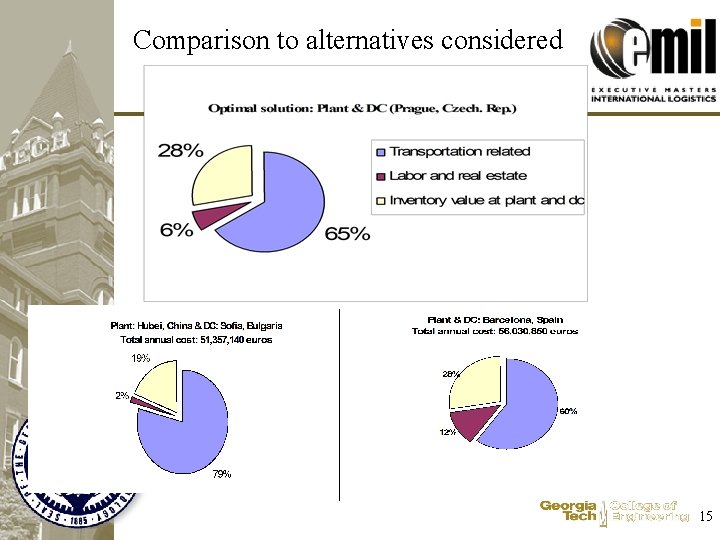
Comparison to alternatives considered 15
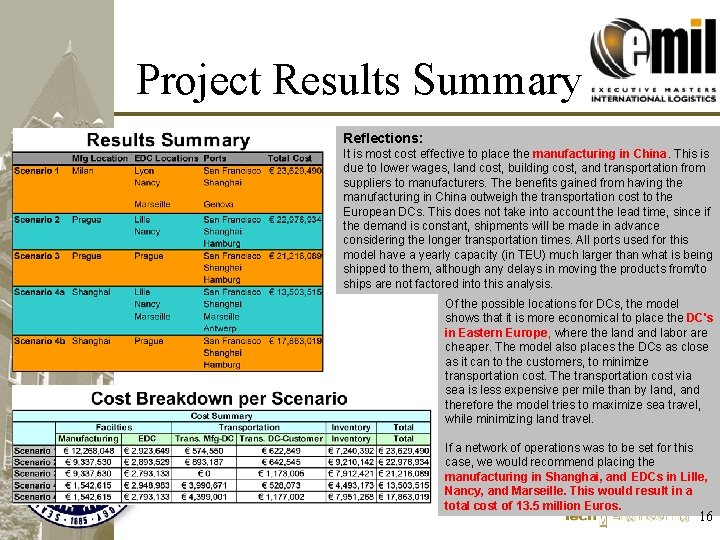
Project Results Summary Reflections: It is most cost effective to place the manufacturing in China. This is due to lower wages, land cost, building cost, and transportation from suppliers to manufacturers. The benefits gained from having the manufacturing in China outweigh the transportation cost to the European DCs. This does not take into account the lead time, since if the demand is constant, shipments will be made in advance considering the longer transportation times. All ports used for this model have a yearly capacity (in TEU) much larger than what is being shipped to them, although any delays in moving the products from/to ships are not factored into this analysis. Of the possible locations for DCs, the model shows that it is more economical to place the DC's in Eastern Europe, where the land labor are cheaper. The model also places the DCs as close as it can to the customers, to minimize transportation cost. The transportation cost via sea is less expensive per mile than by land, and therefore the model tries to maximize sea travel, while minimizing land travel. If a network of operations was to be set for this case, we would recommend placing the manufacturing in Shanghai, and EDCs in Lille, Nancy, and Marseille. This would result in a total cost of 13. 5 million Euros. 16
Scenario 4 a To Manufacturing To DC To Port To Costumer 17
- Slides: 17