
Transportation Supply Chain Systems John H Vande Vate









- Slides: 46
Transportation & Supply Chain Systems John H. Vande Vate Fall, 2002 1 1
Who am I? • • • John H. Vande Vate Professor and EMIL Executive Director Office: 433 Phone: (404) 894 -3035 Office Hours: – Tuesday, Thursday 11 -12 (after class) or – By appointment 2 2
Our TA • • Seyhmus Inci E-mail: gtg 348 c@prism. gatech. edu Office Hours: 11 -12 TH Location: TBA 3 3
Administrative Details • Class Home Page: www. isye. gatech. edu/~jvandeva/Classes/6203/syllabus 2002. htm Keep up with information here! • Text: None. Use articles, class notes, etc. 4 4
Other Resources • You may also want to read: – Contemporary Logistics by Johnson, Wardlow, Wood and Murphy – Logistic Systems Analysis by Daganzo – Business Logistics Management 4 th Edition by R. H. Ballou, Prentice Hall, 1999 – Bramel, J. and D. Simchi-Levi, The Logic of Logistics: Theory, Algorithms and Applications for Logistics Management, Springer-Verlag, 1997 – Logistics and Supply Chain Management: Strategies for Reducing Cost and Improving Service (2 nd Edition) by Martin Christopher – Modeling the Supply Chain by Jeremy F. Shapiro 5 5
Grading • Exams: 60% – September 12 th 30% October 31 st 30% Week of Dec. 9 th 30% – Drop your lowest exam grade • Project: 35% – Groups of 6 or 7 • Class Lecture Notes: 5% – – – 2 Volunteers for today? 2 Volunteers for Thursday? Turn them in to Seyhmus will coordinate subsequent assignments 6 Everyone gets a turn 6
Objectives • Knowledge and understanding of the issues and modeling tools underlying supply chain management • Course discussion – Analytical tools – Industry background • Project – Industry and/or regional issues – Optionally applications of analytical tools 7 7
Projects • Teams of 6 -7 unless video • Deliverables – A powerpoint presentation designed for an audience similar to this class – A clearly written and well organized report to accompany the presentation (approximately 15 – 20 pages) 8 8
Projects: Schedule September 24 th: Submit your team composition and selected topic to me via e-mail October 17 th: Submit an outline of your report with assigned responsibilities to me via e-mail November 26 th: Submit your powerpoint presentation and report to me via e-mail 9 9
Project Topics Asian Logistic Networks. This should provide a comprehensive overview of the key freight transportation systems in the region bounded by China, India, Australia and Japan. It should describe: – – – – the key goods moving in the region, the flows of these goods, the modes these goods move by, the principal carriers, the key transport facilities (ports, airports, etc) the different roles organizations play in the process special challenges to shippers and carriers in the 10 region 10
Project Topics Latin American Logistic Networks. This should provide a comprehensive overview of the key freight transportation systems in South and Central America. It should describe: – – – – the key goods moving in the region, the flows of these goods, the modes these goods move by, the principal carriers, the key transport facilities (ports, airports, etc) the different roles organizations play in the process special challenges to shippers and carriers in the region 11 11
Project Topics Comparison of Asian and North American automobile manufacturing practices. Emphasize the relationships with suppliers, customers and logistics service providers. Focus on the supply chain relationships including: – – The principal marketing channels How finished vehicles are delivered to customers Product diversity Mfg strategy including discussion of whether vehicles are pushed onto the market or pulled by the market, whether one model or several models are made in a plant, the proximity of suppliers to assembly plants, the level inventory in the assembly plants 12 12 – Sourcing and in-bound supply strategy
Project Topics Comparison of European and North American automobile manufacturing practices Emphasize the relationships with suppliers, customers and logistics service providers. Focus on the supply chain relationships including: – – The principal marketing channels How finished vehicles are delivered to customers Product diversity Mfg strategy including discussion of whether vehicles are pushed onto the market or pulled by the market, whether one model or several models are made in a plant, the proximity of suppliers to assembly plants, the level inventory in the assembly plants 13 13 – Sourcing and in-bound supply strategy
Project Topics Best Practices and Trends in the Electronics Manufacturing Supply Chain emphasize relationships with suppliers, customers and logistics service providers. Focus on the supply chain relationships including: – – The principal marketing channels How finished goods are delivered to customers Product diversity Manufacturing strategy. Is manufacturing done internally or outsourced, are products pushed onto the market or pulled by the market, how many different products are made in a plant, the proximity of suppliers, the level inventories in the assembly plants 14 14 – Sourcing and in-bound supply strategy
Project Topics Comparison of best practices and trends in the automotive and electronics manufacturing supply chains Emphasize the relationships with suppliers, customers and logistics service providers. – – The principal marketing channels How finished products are delivered to customers Product diversity Manufacturing strategy. Are products pushed onto the market or pulled by the market, whether one model or several models are made in a plant, the proximity of suppliers to assembly plants, the level of inventories in the assembly plants – Sourcing and in-bound supply strategy including who 15 owns the raw materials inventories and where is it 15
Algebraic Modeling Languages • AMPL – www. ampl. com - Free student version – AMPL A Modeling Language for Mathematical Programming, Fourer, Gay and Kernighan – No full version generally available • XPress-MP: – Full version available in the graduate and undergraduate labs. 16 16
More Options • AIMMS: – This application is supported in the Lab. – Student version? ? • MPL or related tools: – Can be downloaded free from www. maximalusa. com/download/ – No full version available • OPL Studio Free trial version at www. ilog. com/products/oplstudio/trial. cfm 17 17
Worst Option • Solver in Excel – Not industrial strength – Not reliable – Model and data confounded – But if you’re really struggling… 18 18
Good and Bad of EMIL • Good: – Executive Master’s in International Logistics – VP’s, Directors and Managers from • Baxter, Bell. South, Ford, GM, Intel, K&N, Milliken, Ryder, Schneider, USPS, … – Meeting with Execs from • GM, Siemens, Nokia, Coca Cola, Unilever, Wal. Mart, Dell, … –. . . 19 19
Good and Bad of EMIL • Bad: – I will be out of the country • Sept 8 – Sept 22 • Oct 26 – Nov 2 • Still wanted to do this class. 20 20
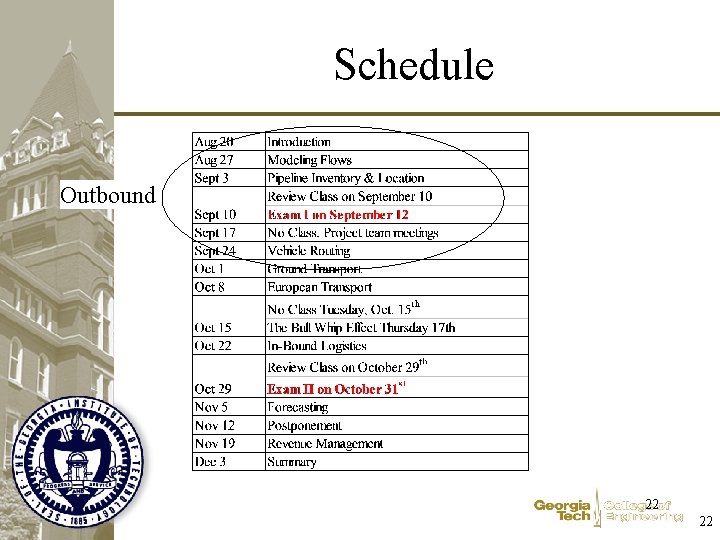
Resolution • September 10 th Review Session – Practice exam • September 12 th Exam I • Week of September 17 th – No class that week. Work on your projects • October 29 th Review Session – Practice exam • October 31 st Exam II 21 21
Schedule Outbound 22 22
Illustrative Example • Develop a distribution strategy to minimize inventory and transportation costs • Purpose: – Outline issues covered in outbound logistics 23 23
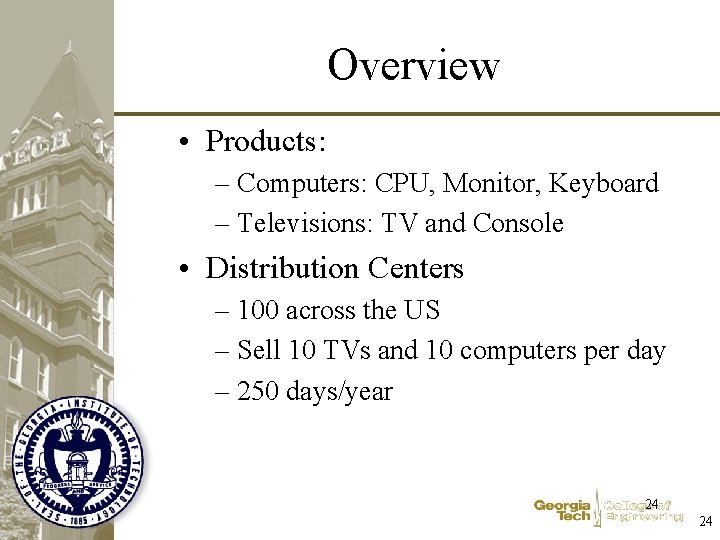
Overview • Products: – Computers: CPU, Monitor, Keyboard – Televisions: TV and Console • Distribution Centers – 100 across the US – Sell 10 TVs and 10 computers per day – 250 days/year 24 24
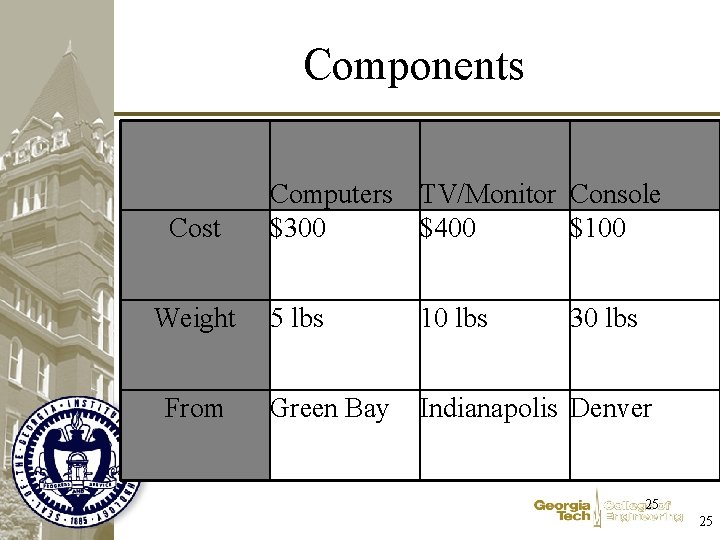
Components Cost Weight From Computers TV/Monitor Console $300 $400 $100 5 lbs 10 lbs 30 lbs Green Bay Indianapolis Denver 25 25
An Illustrative Example Facts 26 26
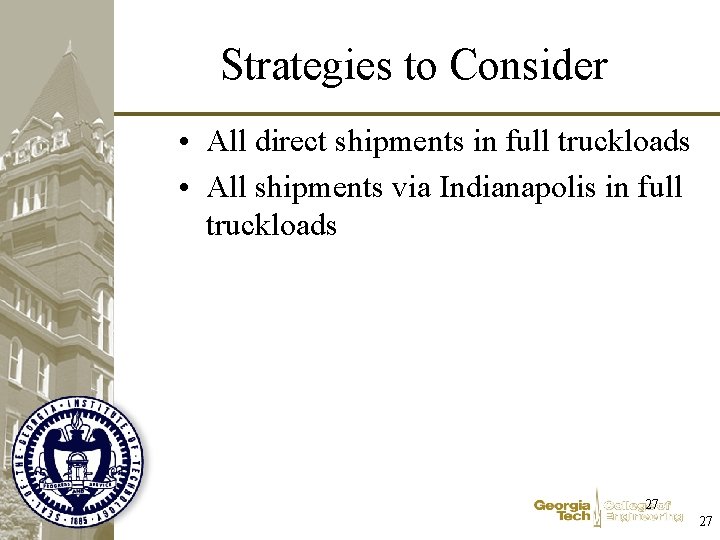
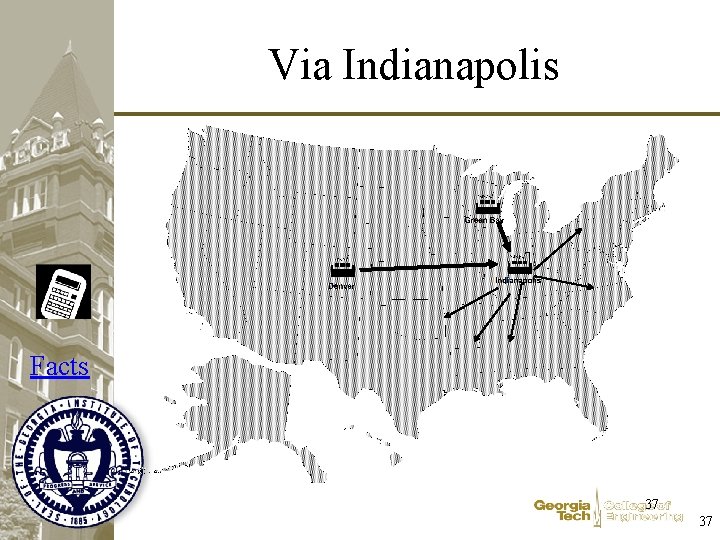
Strategies to Consider • All direct shipments in full truckloads • All shipments via Indianapolis in full truckloads 27 27
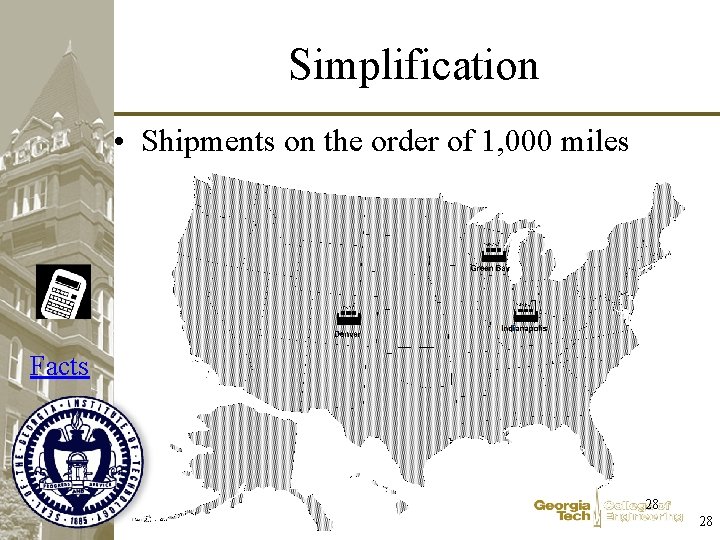
Simplification • Shipments on the order of 1, 000 miles Facts 28 28
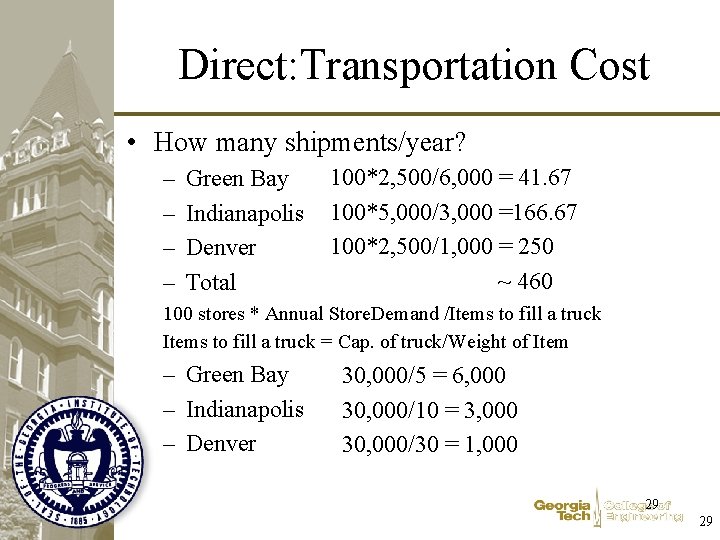
Direct: Transportation Cost • How many shipments/year? – – Green Bay Indianapolis Denver Total 100*2, 500/6, 000 = 41. 67 100*5, 000/3, 000 =166. 67 100*2, 500/1, 000 = 250 ~ 460 100 stores * Annual Store. Demand /Items to fill a truck = Cap. of truck/Weight of Item – Green Bay – Indianapolis – Denver 30, 000/5 = 6, 000 30, 000/10 = 3, 000 30, 000/30 = 1, 000 29 29
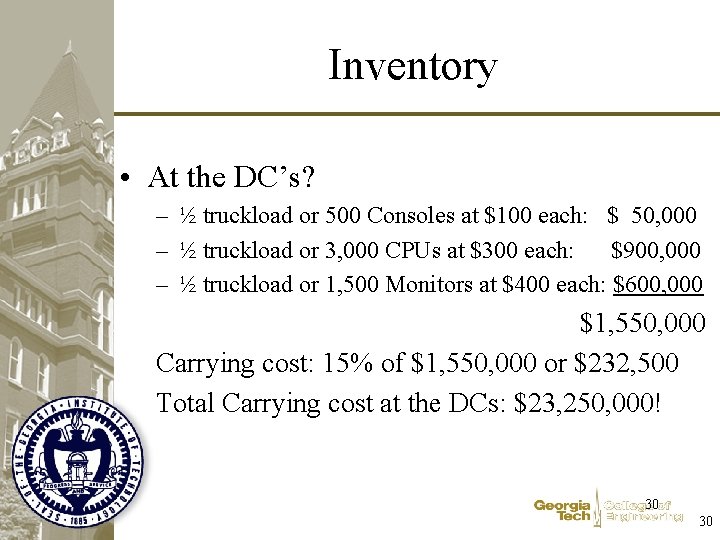
Inventory • At the DC’s? – ½ truckload or 500 Consoles at $100 each: $ 50, 000 – ½ truckload or 3, 000 CPUs at $300 each: $900, 000 – ½ truckload or 1, 500 Monitors at $400 each: $600, 000 $1, 550, 000 Carrying cost: 15% of $1, 550, 000 or $232, 500 Total Carrying cost at the DCs: $23, 250, 000! 30 30
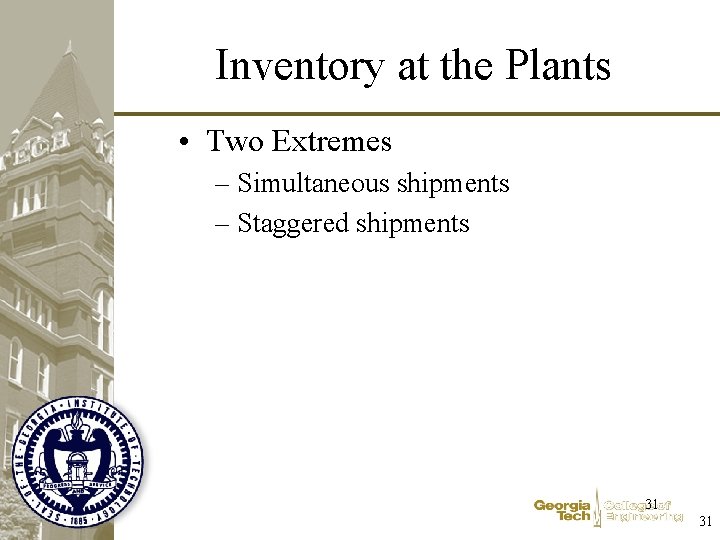
Inventory at the Plants • Two Extremes – Simultaneous shipments – Staggered shipments 31 31
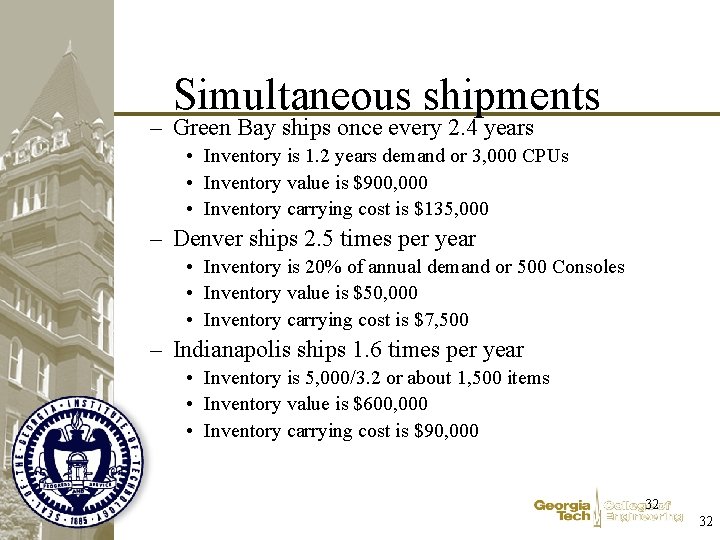
Simultaneous shipments – Green Bay ships once every 2. 4 years • Inventory is 1. 2 years demand or 3, 000 CPUs • Inventory value is $900, 000 • Inventory carrying cost is $135, 000 – Denver ships 2. 5 times per year • Inventory is 20% of annual demand or 500 Consoles • Inventory value is $50, 000 • Inventory carrying cost is $7, 500 – Indianapolis ships 1. 6 times per year • Inventory is 5, 000/3. 2 or about 1, 500 items • Inventory value is $600, 000 • Inventory carrying cost is $90, 000 32 32
Why Not? • What are problems with simultaneous shipments? • When are simultaneous shipments likely? • What alternatives? 33 33
Staggered Shipments • Each plant holds ½ a truck load – Comments? • Total plant inventory like one more DC 34 34
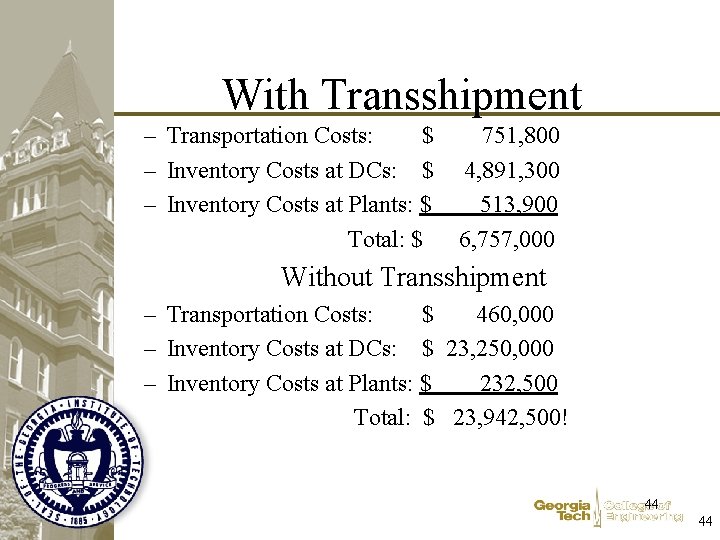
Total Cost Direct • Transportation Costs: $ 460, 000 • Inventory Costs at DCs: $ 23, 250, 000 • Inventory Costs at Plants: $ 232, 500 Total: $ 23, 942, 500! 35 35
Consolidation • Strategy 2: Assemble Products in Indianapolis and distribute by truckload from there • What will happen to costs? – Transportation – At plants – At Indianapolis Warehouse – At DCs 36 36
Via Indianapolis Facts 37 37
Indirect: Transportation • To Indianapolis – Green Bay 400 miles* 42 trips = 16, 800 – Indianapolis 0 miles*167 trips = ~ 0 – Denver 1, 100 miles*250 trips = 275, 000 – Total $291, 800 38 38
Inventory Effects • Inventory at a DC: – Visited by truck 4. 6 times per year – Same as before – So inventory costs at DC are the same as before, right? 39 39
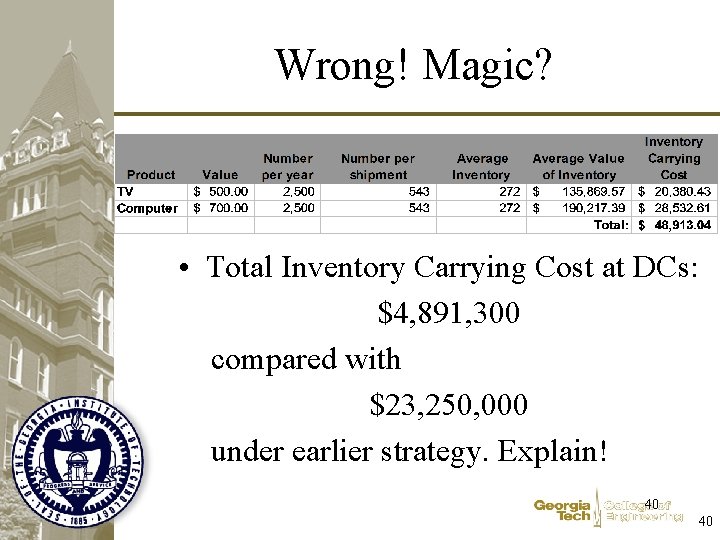
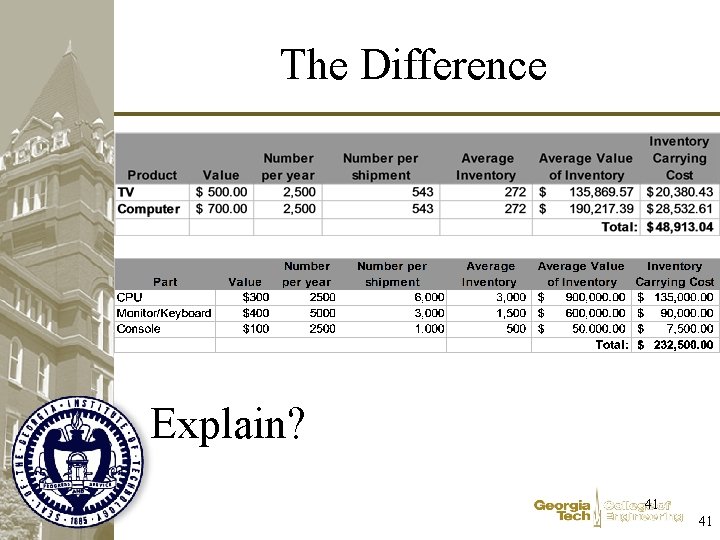
Wrong! Magic? • Total Inventory Carrying Cost at DCs: $4, 891, 300 compared with $23, 250, 000 under earlier strategy. Explain! 40 40
The Difference Explain? 41 41
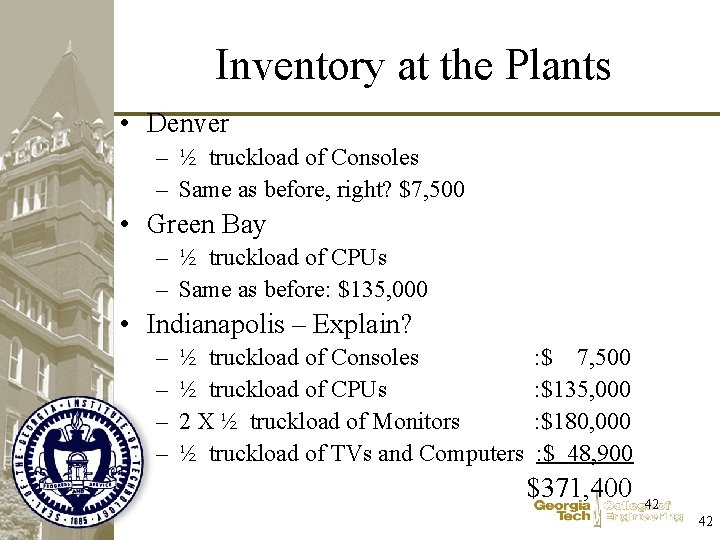
Inventory at the Plants • Denver – ½ truckload of Consoles – Same as before, right? $7, 500 • Green Bay – ½ truckload of CPUs – Same as before: $135, 000 • Indianapolis – Explain? – – ½ truckload of Consoles : $ 7, 500 ½ truckload of CPUs : $135, 000 2 X ½ truckload of Monitors : $180, 000 ½ truckload of TVs and Computers : $ 48, 900 $371, 400 42 42
Cross Dock • Warehouse – purpose is to hold inventory • Cross Dock – consolidate freight but don’t hold inventory • There’s always some inventory 43 43
With Transshipment – Transportation Costs: $ 751, 800 – Inventory Costs at DCs: $ 4, 891, 300 – Inventory Costs at Plants: $ 513, 900 Total: $ 6, 757, 000 Without Transshipment – Transportation Costs: $ 460, 000 – Inventory Costs at DCs: $ 23, 250, 000 – Inventory Costs at Plants: $ 232, 500 Total: $ 23, 942, 500! 44 44
Other Advantages/Disadvantages • Disadvantages – Capital Cost of Warehouse – Extra handling at Warehouse • Advantages – Economies of Scale in Assembly – Reduced demands on DC labor 45 45
46 46