Extrema and Average Rates of Change Unit 1

- Slides: 36
Extrema and Average Rates of Change Unit 1 Lesson 4
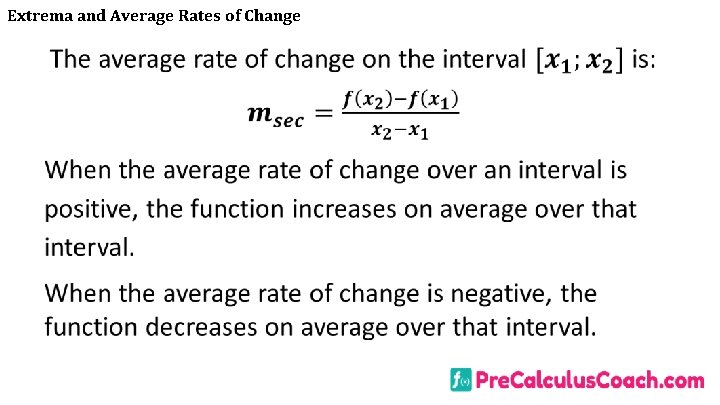
Extrema and Average Rates of Change Students will be able to: Interpret key features of graphs and tables in terms of the quantities, and sketch graphs showing key features given a verbal description of the relationship. Key features include: intervals where the function is increasing, decreasing, positive, or negative; relative maximums and minimums. Calculate and interpret the average rate of change of a function (presented symbolically or as a table) over a specified interval. Estimate the rate of change from a graph.
Extrema and Average Rates of Change Key Vocabulary: Critical points, Absolute maximum and minimum, Relative maximum and minimum, A point of inflection, Average rates of change.
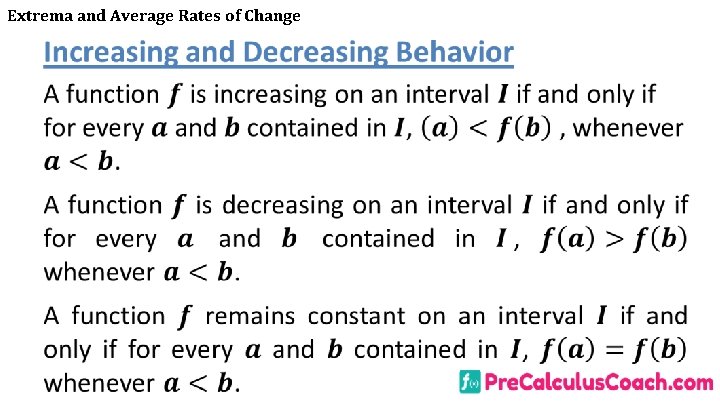
Extrema and Average Rates of Change
Extrema and Average Rates of Change Points in the domain of a function where the function changes from increasing to decreasing or from decreasing to increasing are called critical points. At these points, a line drawn tangent to the curve is horizontal or vertical.
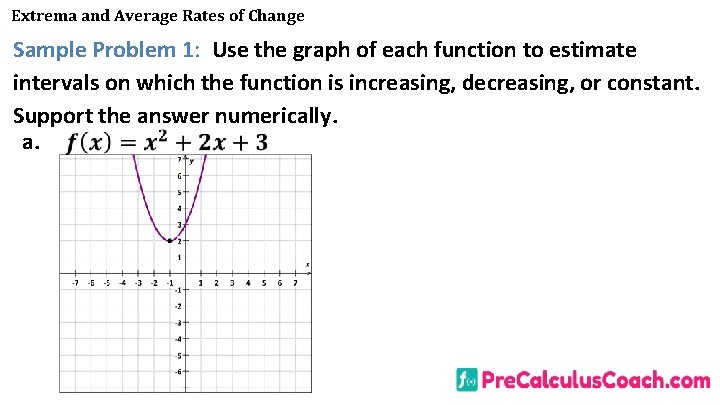
Extrema and Average Rates of Change Sample Problem 1: Use the graph of each function to estimate intervals on which the function is increasing, decreasing, or constant. Support the answer numerically. a.
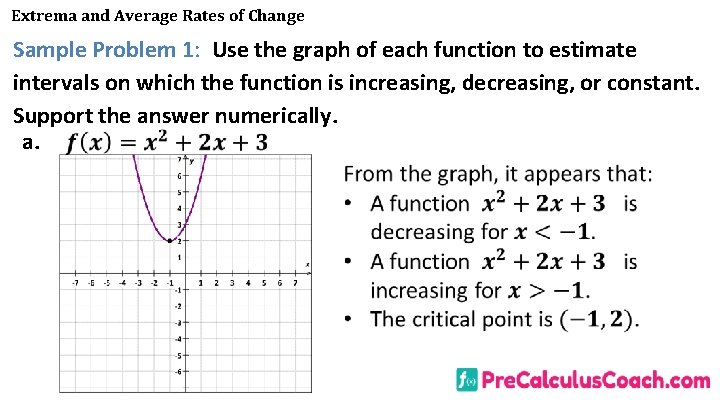
Extrema and Average Rates of Change Sample Problem 1: Use the graph of each function to estimate intervals on which the function is increasing, decreasing, or constant. Support the answer numerically. a.
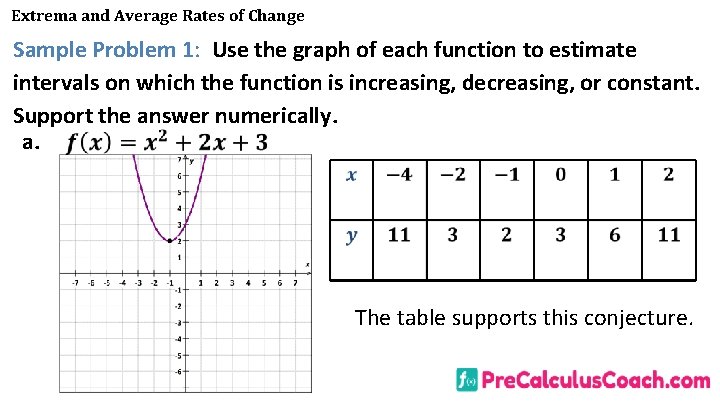
Extrema and Average Rates of Change Sample Problem 1: Use the graph of each function to estimate intervals on which the function is increasing, decreasing, or constant. Support the answer numerically. a. The table supports this conjecture.
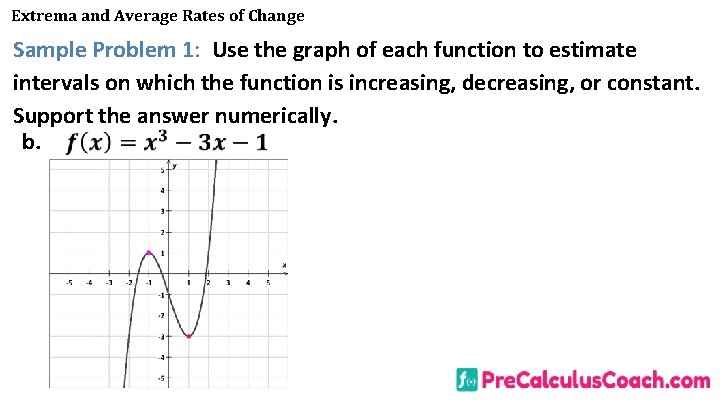
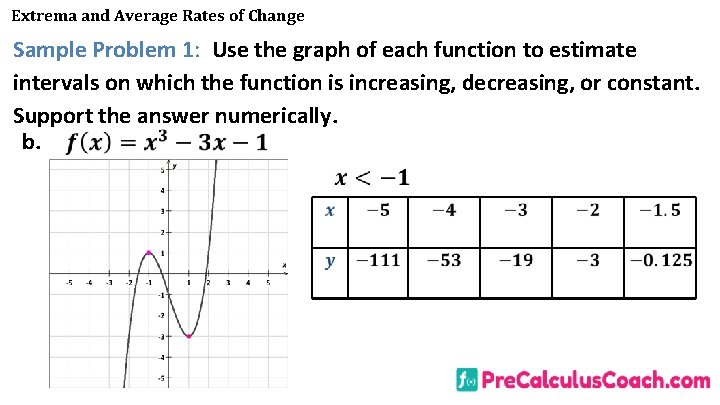
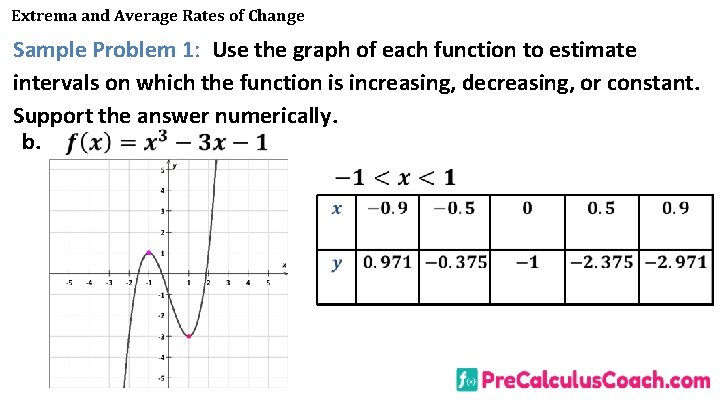
Extrema and Average Rates of Change Sample Problem 1: Use the graph of each function to estimate intervals on which the function is increasing, decreasing, or constant. Support the answer numerically. b.
Extrema and Average Rates of Change Sample Problem 1: Use the graph of each function to estimate intervals on which the function is increasing, decreasing, or constant. Support the answer numerically. b.
Extrema and Average Rates of Change Sample Problem 1: Use the graph of each function to estimate intervals on which the function is increasing, decreasing, or constant. Support the answer numerically. b.
Extrema and Average Rates of Change Sample Problem 1: Use the graph of each function to estimate intervals on which the function is increasing, decreasing, or constant. Support the answer numerically. b.
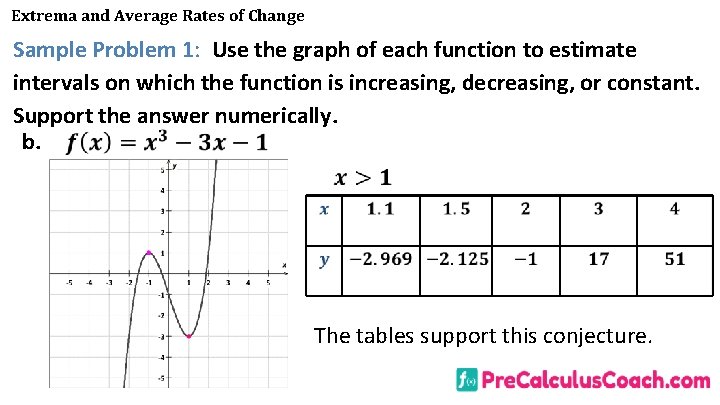
Extrema and Average Rates of Change Sample Problem 1: Use the graph of each function to estimate intervals on which the function is increasing, decreasing, or constant. Support the answer numerically. b. The tables support this conjecture.
Extrema and Average Rates of Change • Extrema are critical points at which a function changes its increasing or decreasing behavior. At these points, the function has a maximum or a minimum value, either relative or absolute. • The greatest value that a function assumes over its domain is called the absolute maximum. • The least value that a function assumes over its domain is called the absolute minimum.
Extrema and Average Rates of Change
Extrema and Average Rates of Change A point of inflection can also be a critical point. At these points, the graph changes its shape, but not it’s increasing or decreasing behavior. Instead, the curve changes from being bent upward to being bent downward, or vice versa.
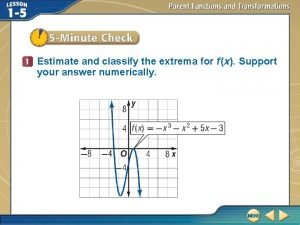
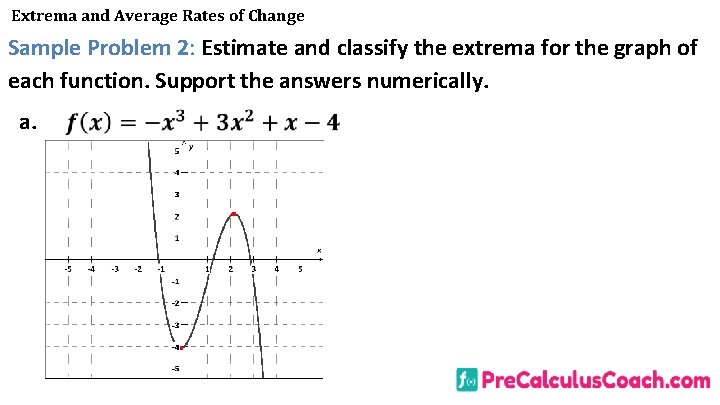
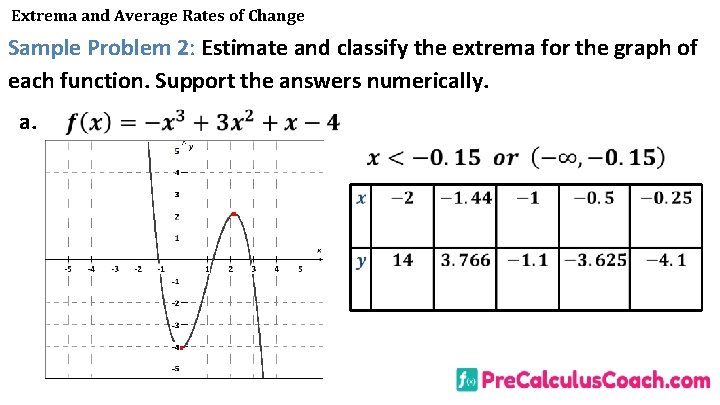
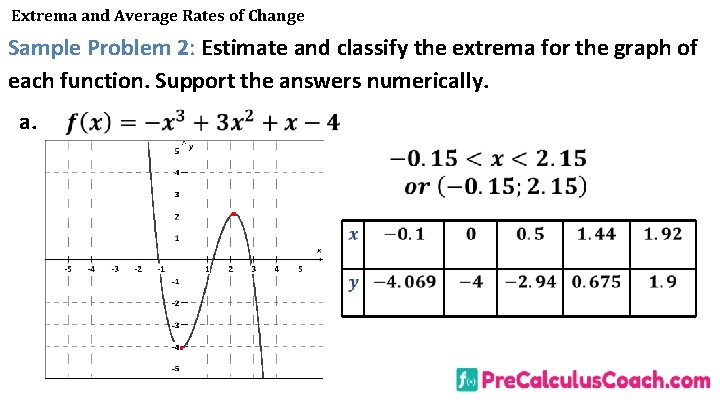
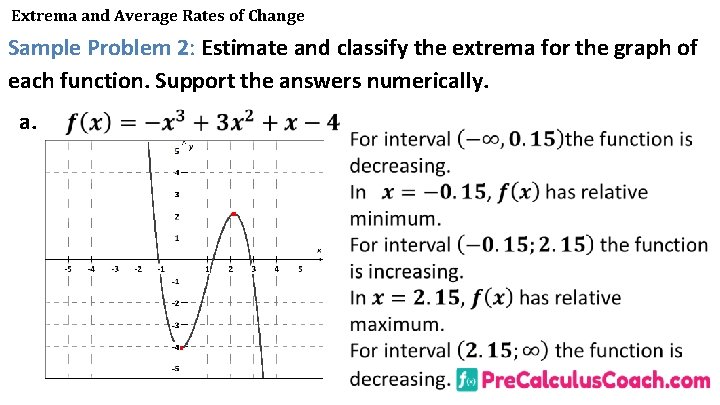
Extrema and Average Rates of Change Sample Problem 2: Estimate and classify the extrema for the graph of each function. Support the answers numerically. a.
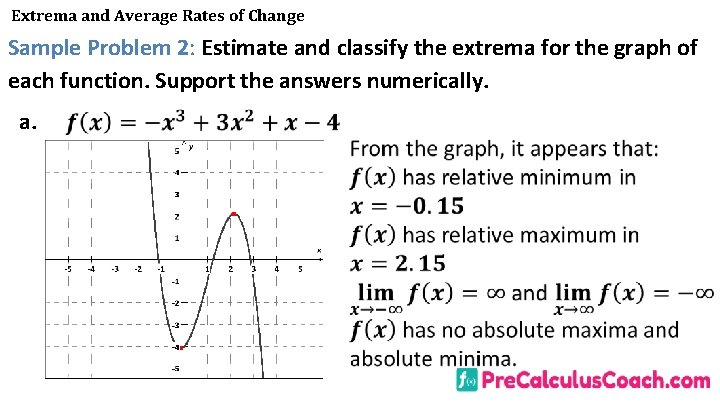
Extrema and Average Rates of Change Sample Problem 2: Estimate and classify the extrema for the graph of each function. Support the answers numerically. a.
Extrema and Average Rates of Change Sample Problem 2: Estimate and classify the extrema for the graph of each function. Support the answers numerically. a.
Extrema and Average Rates of Change Sample Problem 2: Estimate and classify the extrema for the graph of each function. Support the answers numerically. a.
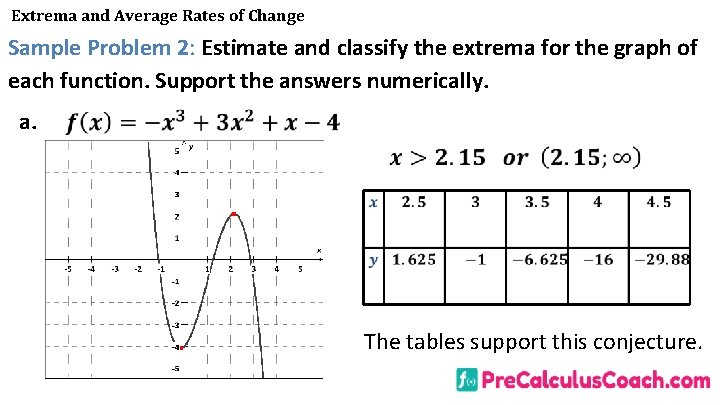
Extrema and Average Rates of Change Sample Problem 2: Estimate and classify the extrema for the graph of each function. Support the answers numerically. a. The tables support this conjecture.
Extrema and Average Rates of Change Sample Problem 2: Estimate and classify the extrema for the graph of each function. Support the answers numerically. a.
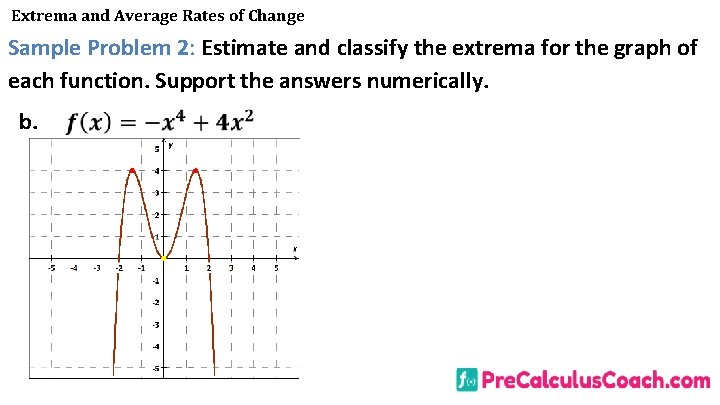
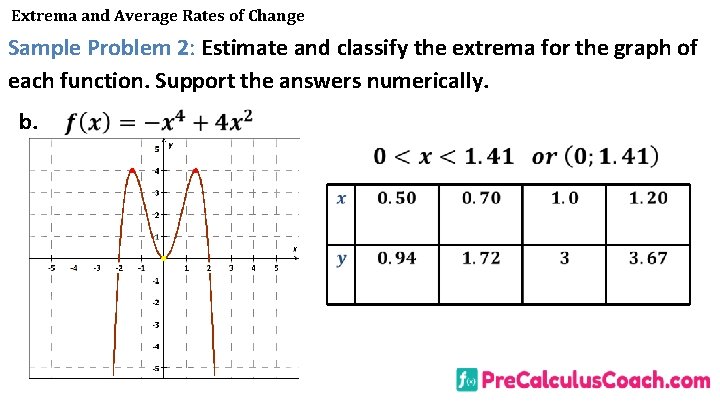
Extrema and Average Rates of Change Sample Problem 2: Estimate and classify the extrema for the graph of each function. Support the answers numerically. b.
Extrema and Average Rates of Change Sample Problem 2: Estimate and classify the extrema for the graph of each function. Support the answers numerically. b.
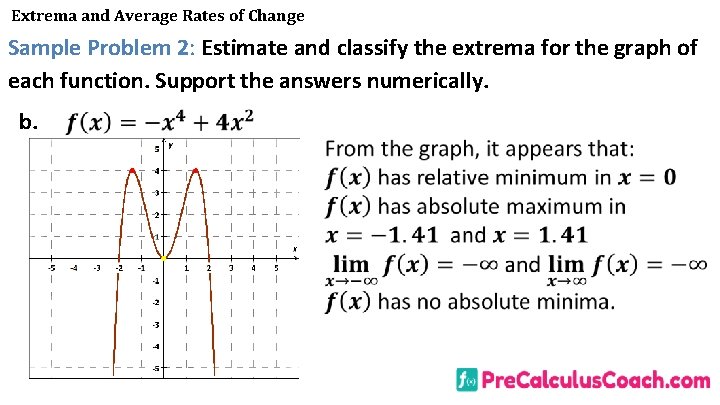
Extrema and Average Rates of Change Sample Problem 2: Estimate and classify the extrema for the graph of each function. Support the answers numerically. b.
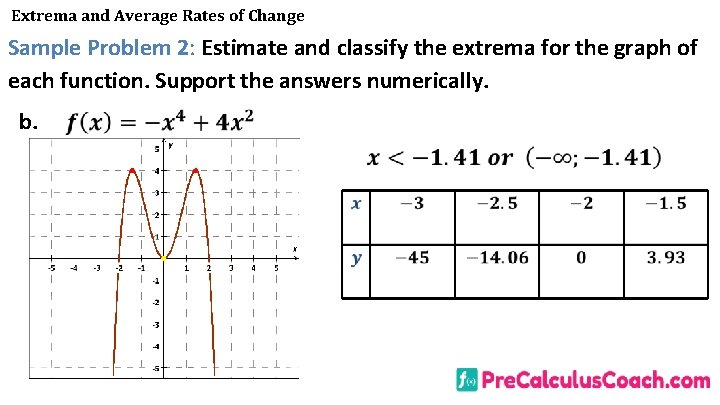
Extrema and Average Rates of Change Sample Problem 2: Estimate and classify the extrema for the graph of each function. Support the answers numerically. b.
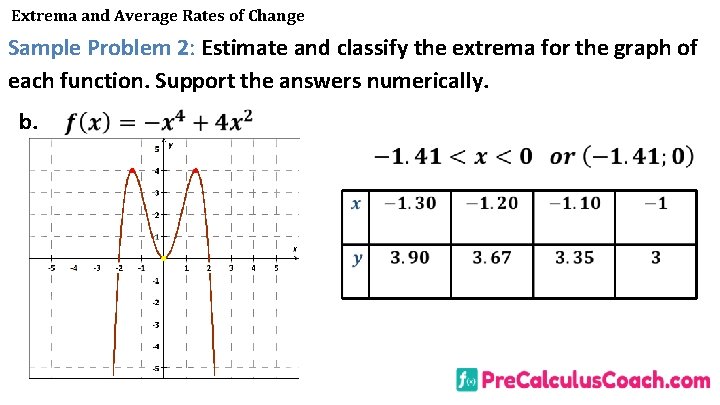
Extrema and Average Rates of Change Sample Problem 2: Estimate and classify the extrema for the graph of each function. Support the answers numerically. b.
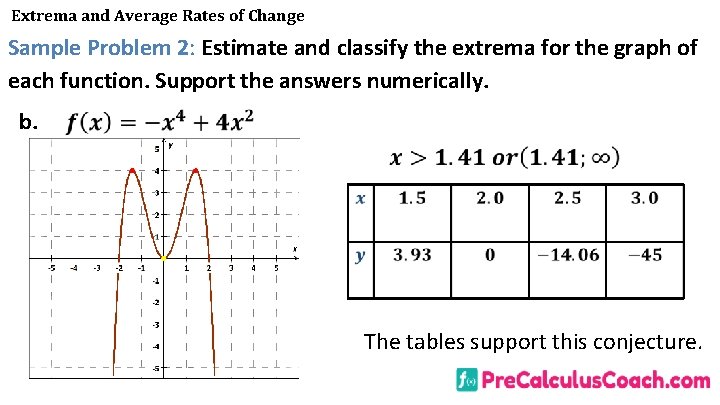
Extrema and Average Rates of Change Sample Problem 2: Estimate and classify the extrema for the graph of each function. Support the answers numerically. b. The tables support this conjecture.
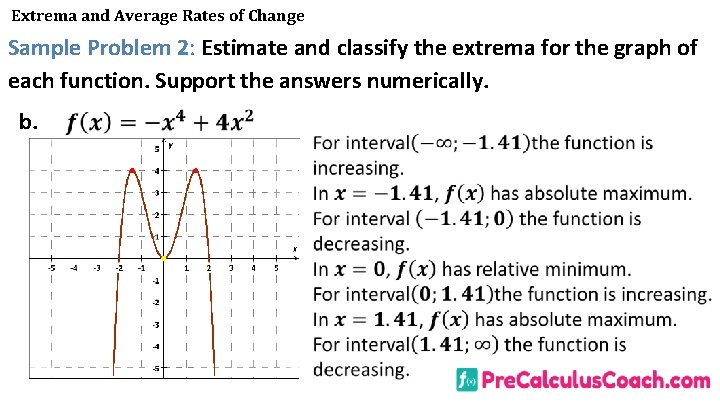
Extrema and Average Rates of Change Sample Problem 2: Estimate and classify the extrema for the graph of each function. Support the answers numerically. b.
Extrema and Average Rates of Change
Extrema and Average Rates of Change
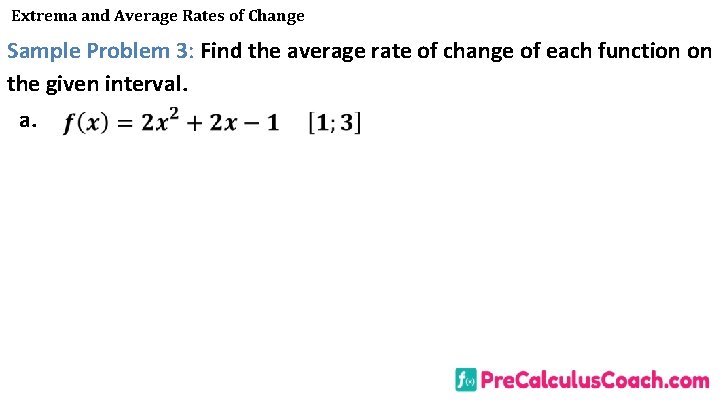
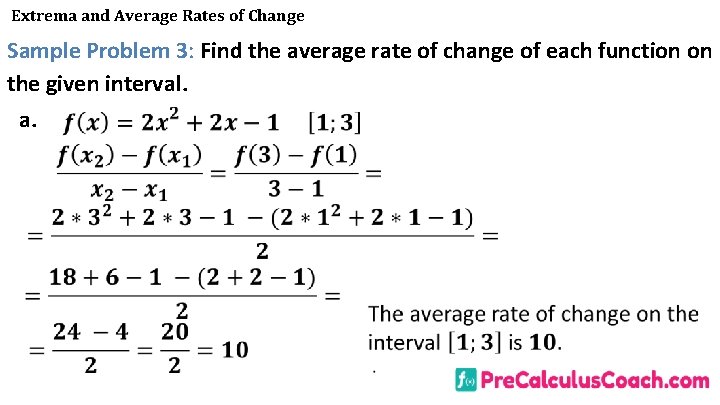
Extrema and Average Rates of Change Sample Problem 3: Find the average rate of change of each function on the given interval. a.
Extrema and Average Rates of Change Sample Problem 3: Find the average rate of change of each function on the given interval. a.
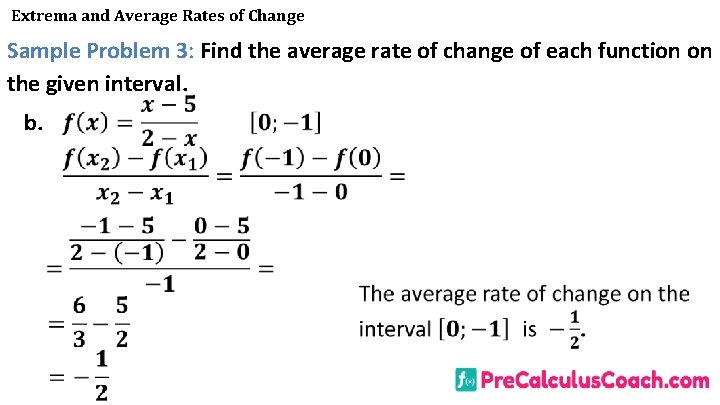
Extrema and Average Rates of Change Sample Problem 3: Find the average rate of change of each function on the given interval. b.
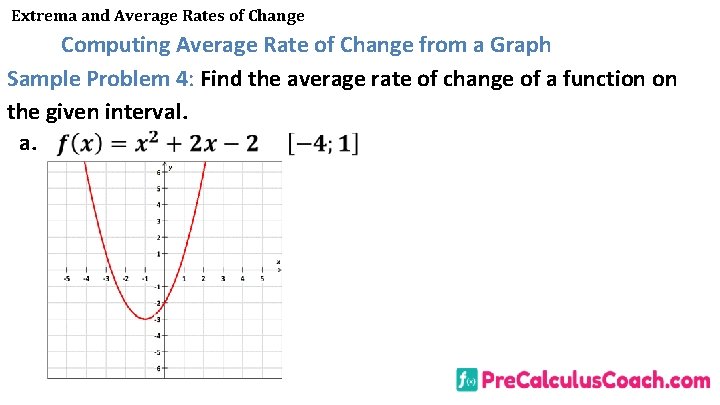
Extrema and Average Rates of Change Computing Average Rate of Change from a Graph Sample Problem 4: Find the average rate of change of a function on the given interval. a.
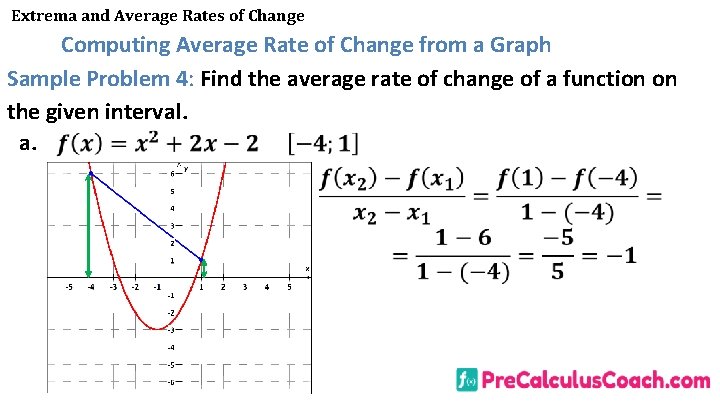
Extrema and Average Rates of Change Computing Average Rate of Change from a Graph Sample Problem 4: Find the average rate of change of a function on the given interval. a.