Evaluating the Effectiveness of the Food Program UST

")
 Clearly identify the goals of the programs within DEH • 2)")
 - Part of the Consumer Protection Division Program -")


 business plans, toxic gas")

 -34 cases Count of substances released Ratio of cases")
 650")


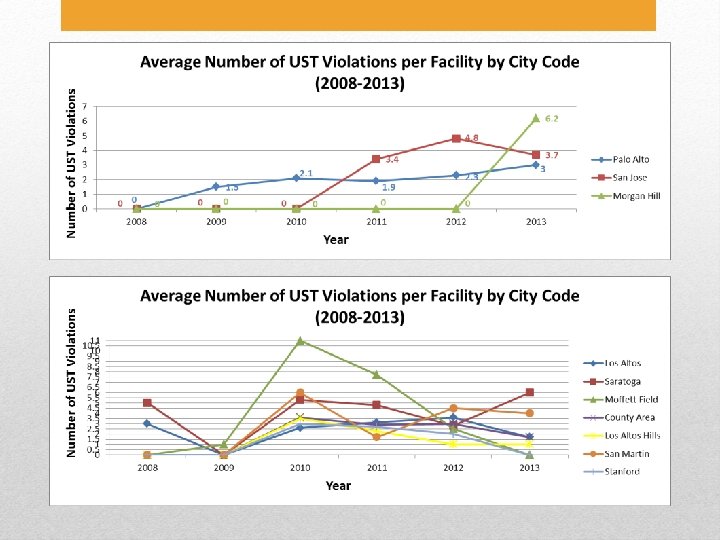
 Number of UST")
 350,")


- Slides: 19
Evaluating the Effectiveness of the Food Program & UST Program at Santa Clara County DEH By: Michelle Santos University of San Francisco December 5, 2013
Santa Clara County Department of Environmental Health Hazardous Materials Compliance Division (SCC DEH HMCD) Background
• 1) Clearly identify the goals of the programs within DEH • 2) Identify methods and metrics for evaluating the effectiveness of DEH programs in meeting their goals • 3) Gather and analyze data related to program effectiveness • 4) Provide an Excel model that allows the DEH to evaluate current and future trends in program effectiveness Objectives
• Food Program (FP) - Part of the Consumer Protection Division Program - • UST Recreational pools and spas, land use, drinking water, certified farmers markets, etc. - Specifically Food Safety - Grocery stores, liquor stores, bakeries, restaurants, mobile food facilities, etc. Programs - conduct routine and follow-up inspections - investigate complaints and suspected foodborne illnesses - Carry out food recalls - Conduct multi-lingual food safety classes, - Conduct plan reviews for new and remodeled facilities - Issues permits.
* Major risk factor violations & Foodborne Illness Complaints Specific major risk factor violations that were most predictive of foodborne illness complaints Food Program
497, 449 violations TOTAL 390 Foodborne Illness Investigations -15, 088 Facilities 24, 224 linked to 014 investigation/s -296 Facilities 95 Major Violations w/ valid 014 within 6 months -53 Facilities -74 Serial Numbers 473, 225 NOT linked to 014 investigation/s -14, 792 Facilities 846 Major Violations without valid 014 within 6 months -223 Facilities -616 Serial Numbers 16, 016 Major Violations -5, 154 Facilities -11, 439 Serial Numbers Food Program (cont’d. )
Top 3 Major Risk Factor Violations Linked to Foodborne Illness Investigations Number of violations 30 27 25 20 15 14 13 adequate hand-wash facilities supplied, accessible; hands clean, properly washed; gloves used properly food contact surfaces clean, sanitiized 10 5 0 proper hot/cold holding temperatures Data
- Part of HMCD • -Food Program Hazardous materials (FP) business plans, toxic gas storage, hazardous materials compliance, etc. - Specifically UST Program - Gas stations - conduct routine and follow-up inspections - Operating permit - Leak detection systems - Financial responsibility Programs • UST Program
Decrease in the number of leaks/spills and the duration of each case UST Program
LOP data (FY 2008 -2013) -34 cases Count of substances released Ratio of cases completed to cases still open Average duration of each case UST Program (cont’d. )
Count of Substance Releases and Their Average Number of Days Open (2008 -2013) 650 600 555 550 500 450 447 400 350 Count of Substance Releases 321 300 274 250 203 200 150 100 50 0 2 3 2008 2009 3 2010 2 1 2012 Average # Days Open
Percentage of Cases Completed vs. Open 120% 100% 0% 25% 80% 50% Percentage Not Completed 60% Percentage Completed 100% 40% 75% 50% 2011 2012 20% 0% 2008 2009 2010
497, 449 violations TOTAL -15, 088 Facilities 2, 463 Violations Under PE 2399 (Underground Storage Tanks) Year City Code Facility ID UST Program (cont’d. )
Average Number of UST Violations Per Facility by Year (2008 -2013) Number of UST Violations 5 4, 4 4, 0 4 3, 6 3, 5 3, 3 3, 2 2010 2011 3 2, 5 2 1, 3 1, 5 1 0, 5 0 2008 2009 2012 Year UST Program (cont’d. ) 2013
Average Total Number of UST Violations per year By City Code (2008 -2013) 350, 0 Number of UST Violations 310, 3 300, 0 250, 0 200, 0 150, 0 100, 0 50, 0 11, 8 10, 8 8, 5 Los Altos Saratoga Moffett Field 26, 0 28, 7 2, 7 4, 0 5, 2 2, 5 0, 0 Palo Alto County Area Los Altos San Martin Stanford Hills San Jose Morgan Hill City Code UST Program (cont’d. )
Food Program UST Program • Relevant data • Allows inspectors to better focus their efforts to specific facilities • Improve coding of violations • Small data set • Difficult to establish trends • Possibly positive in showing that there weren’t a lot of cases • Improvement within a few years • No duplicates • Include “major” Conclusion
QUESTIONS?
• • Staff of Santa Clara County HMCD Staff of Santa Clara County CPD Staff of San Diego County DEH CCDEH References