
Making the Cath Lab Run Efficiently with Cost

Making the Cath Lab Run Efficiently with Cost Savings Bradley Kappalman Vice President Med. Star Heart and Vascular Institute

Bradley Kappalman I have no relevant financial relationships

The Changing Cath Lab Cost Structure • Over the last few years hospitals have seen drops in pricing for drug-eluting coronary stents, pacemakers and implantable defibrillators • New Technology may increase departmental cost as much as 25 to 35 percent * * Data from Innovations in Cardiovascular Devices, Spring 2014
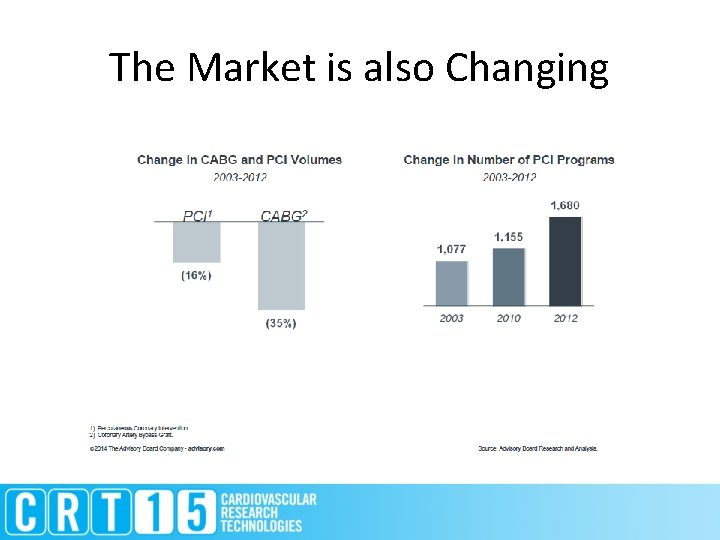
The Market is also Changing
Pressure to Adopt New Technology • • • TAVR Mitral Clip Drug Coated Balloon Bioabsorbable Coronary Scaffolds MRI-conditional devices Left Atrial Appendage Closure
How do we Survive? • We have to change the cost structure of the work we do every day in the Cath Lab
Efficiency and Cost Savings Opportunities • • • Benchmarking Productivity Work Standardization Rationalization of Services Supply Chain Clinical Collaboration
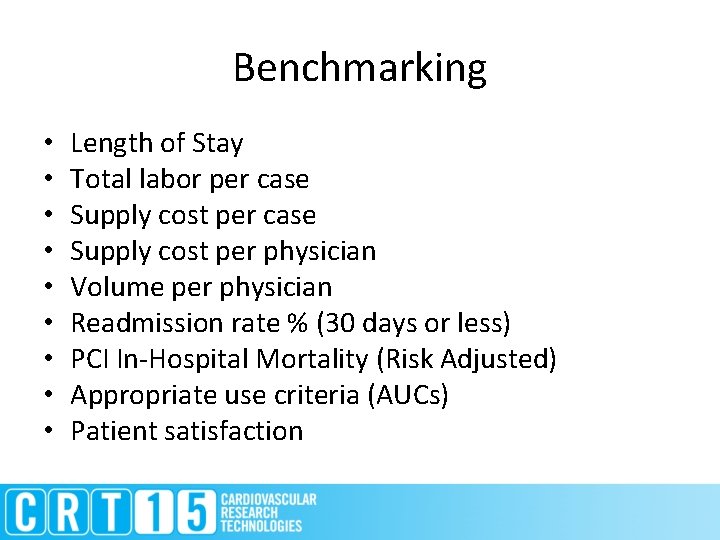
Benchmarking • • • Length of Stay Total labor per case Supply cost per physician Volume per physician Readmission rate % (30 days or less) PCI In-Hospital Mortality (Risk Adjusted) Appropriate use criteria (AUCs) Patient satisfaction
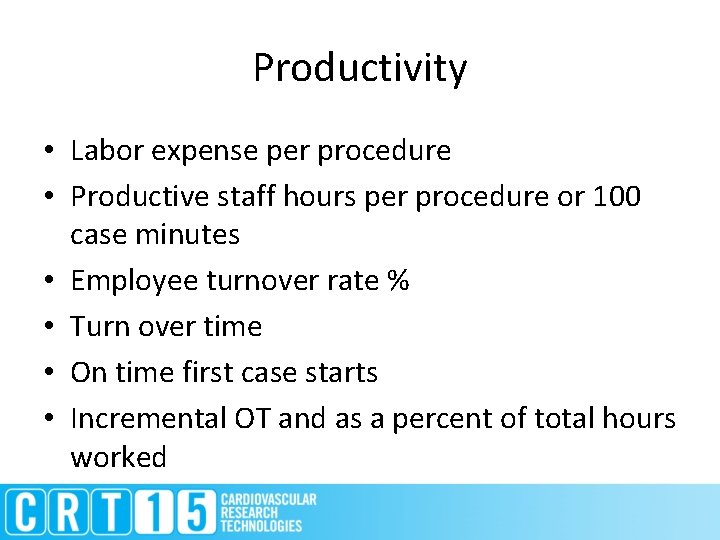
Productivity • Labor expense per procedure • Productive staff hours per procedure or 100 case minutes • Employee turnover rate % • Turn over time • On time first case starts • Incremental OT and as a percent of total hours worked
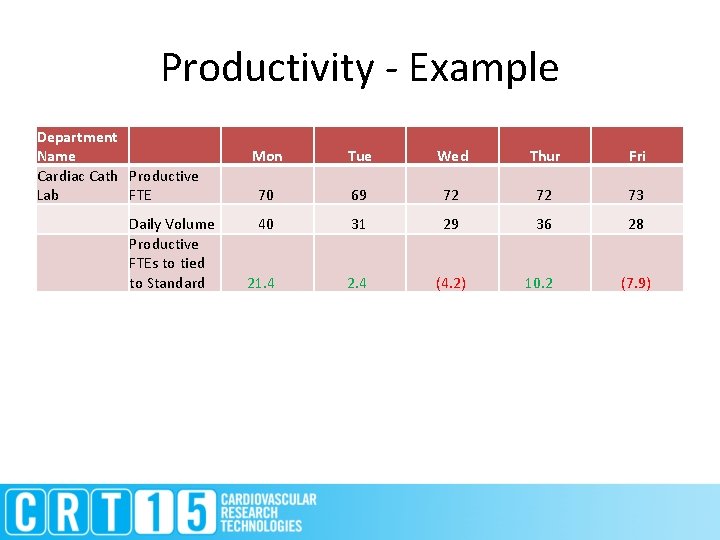
Productivity - Example Department Name Cardiac Cath Productive Lab FTE Mon Tue Wed Thur Fri 70 69 72 73 Daily Volume 40 Productive FTEs to tied to Standard 21. 4 31 29 36 28 2. 4 (4. 2) 10. 2 (7. 9)
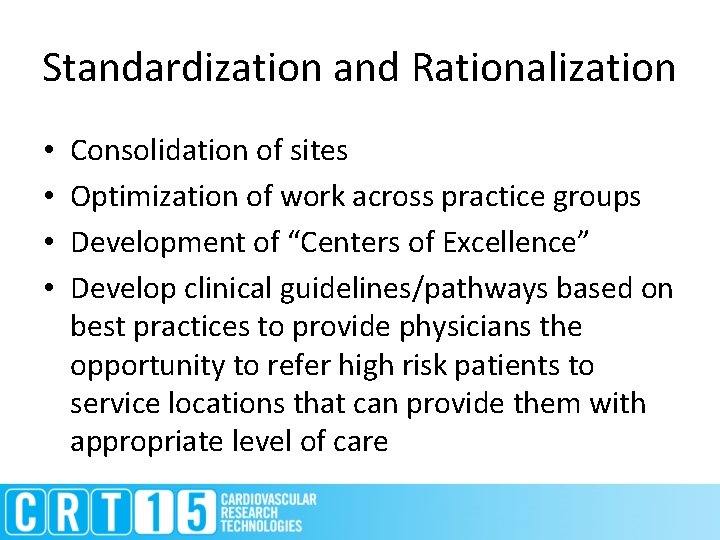
Standardization and Rationalization • • Consolidation of sites Optimization of work across practice groups Development of “Centers of Excellence” Develop clinical guidelines/pathways based on best practices to provide physicians the opportunity to refer high risk patients to service locations that can provide them with appropriate level of care
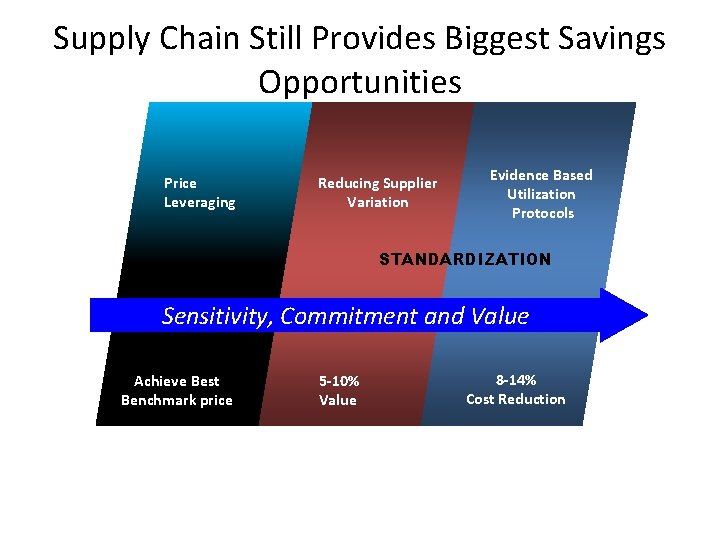
Supply Chain Still Provides Biggest Savings Opportunities Price Leveraging Reducing Supplier Variation Evidence Based Utilization Protocols STANDARDIZATION Sensitivity, Commitment and Value Achieve Best Benchmark price 5 -10% Value 8 -14% Cost Reduction
Price Leveraging • “All play” process for any supplier agreeing to meet benchmark price • Benchmark pricing based on credible data sources (i. e. VHA) • Suppliers engaged at regional and/or national level if possible • Suppliers encouraged to provide additional value beyond the benchmark – Lower pricing – consignment – bulk-buy discounts (20%) – extended payment terms • Engage suppliers with the greatest upside potential first
Reduce Supplier Variation • • Dual Vendor Agreements Market Share Commitments Consolidation by product or service line Partnership
Evidence Based Utilization Protocols • Physician and Hospital Alignment • Shared Incentives • Quality health care is easily defined as doing the right thing (getting the health care services you need), at the right time (when you need it), in the right way (using the appropriate test or procedure), to achieve the best possible results.

Clinical Collaboration • Role of CCL Medical Director • Aligned incentives • All other initiatives will be less successful without true collaboration • Integration with Health Systems

Clinical Collaboration

- Slides: 18