ENVE 201 Environmental Engineering Chemistry 1 p H


- Slides: 14
ENVE 201 Environmental Engineering Chemistry 1 p. H Dr. Aslıhan Kerç
Definition of p. H • Used to express the intensity of the acid or alkaline condition of a solution • Express hydrogen ion concentration • Express hydrogen ion activity
Why p. H is important in environmental engineering? In environmental engineering p. H must be considered in: • Chemical coagulation • Disinfection • Water softening • Corrosion control • Microorganisms in biological treatment • Sludge dewatering • Oxidation of certain substances (such as cyanide)
Common characteristics of Acids and Bases • All acids contain element hydrogen • Neutralization reaction between acids- bases? produce water • Bases contain hydroxyl groups • Strong acid ? Weak acid? • Strong acids and bases are highly ionized • Weak acids and bases are poorly ionized in aqueous solutions.
Hydrogen Electrode • Used to measure hydrogen ion activity • Pure water dissociates to produce hydrogen and hydroxyl ions H 2 O H+ + OH- H ions 10 -7 mol/L OH ions 10 -7 mol/L Equilibrium equation?
Equilibrium Equation • Since concentration of water is constant, activity =1 • {H+} {OH-}=10 -7 x 10 -7 = 10 -14
• When acid is added to water, hydrogen activity increases • When base is added to water hydoxile ion activity increases • {H+} and {OH-} can never be zero
Sorenson, 1909 • • • p. H = - log {H+} p. H range 0 -14 p. H 7 @25 o. C represent absolute neutrality Neutrality @ 0 o. C p. H 7. 5 Neutrality @ 60 o. C p. H 6. 5 Kw changes with change in temperature p. H of neutrality changes with temperature
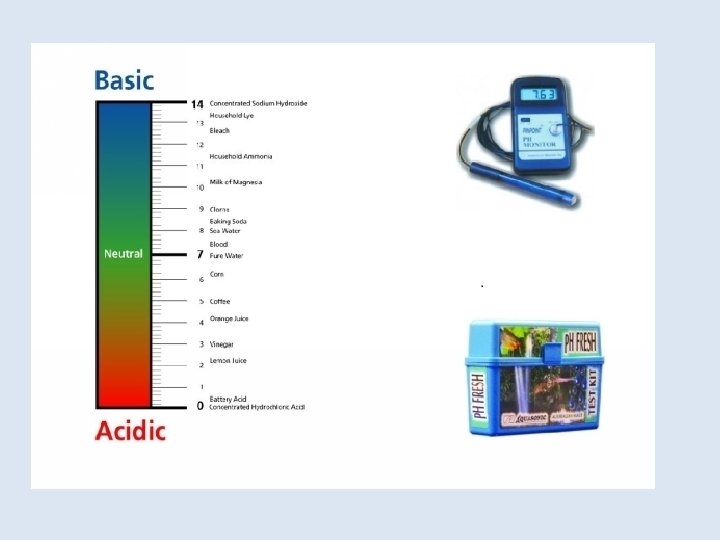
Measurement of p. H • Hydrogen electrode absolute standard for p. H measurement. Not practical in use • Indicators calibrated with hydrogen electrode. Different color characteristics at different p. H levels
Indicator p. H Range Quantity per 10 ml Acid Base Thymol Blue 1. 2 -2. 8 1 -2 drops 0. 1% soln. in aq. red yellow Pentamethoxy red 1. 2 -2. 3 1 drop 0. 1% soln. in 70% alc. red-violet colorless Tropeolin OO 1. 3 -3. 2 1 drop 1% aq. soln. red yellow 2, 4 -Dinitrophenol 2. 4 -4. 0 1 -2 drops 0. 1% soln. in 50% alc. colorless yellow Methyl yellow 2. 9 -4. 0 1 drop 0. 1% soln. in 90% alc. red yellow Methyl orange 3. 1 -4. 4 1 drop 0. 1% aq. soln. red orange Bromphenol blue 3. 0 -4. 6 1 drop 0. 1% aq. soln. yellow blue-violet Tetrabromphenol blue 3. 0 -4. 6 1 drop 0. 1% aq. soln. yellow blue Alizarin sodium sulfonate 3. 7 -5. 2 1 drop 0. 1% aq. soln. yellow violet α-Naphthyl red 3. 7 -5. 0 1 drop 0. 1% soln. in 70% alc. red yellow p-Ethoxychrysoidine 3. 5 -5. 5 1 drop 0. 1% aq. soln. red yellow Bromcresol green 4. 0 -5. 6 1 drop 0. 1% aq. soln. yellow blue Methyl red 4. 4 -6. 2 1 drop 0. 1% aq. soln. red yellow Bromcresol purple 5. 2 -6. 8 1 drop 0. 1% aq. soln. yellow purple Chlorphenol red 5. 4 -6. 8 1 drop 0. 1% aq. soln. yellow red Bromphenol blue 6. 2 -7. 6 1 drop 0. 1% aq. soln. yellow blue p-Nitrophenol 5. 0 -7. 0 1 -5 drops 0. 1% aq. soln. colorless yellow Azolitmin 5. 0 -8. 0 5 drops 0. 5% aq. soln. red blue Phenol red 6. 4 -8. 0 1 drop 0. 1% aq. soln. yellow red Neutral red 6. 8 -8. 0 1 drop 0. 1% soln. in 70% alc. red yellow Rosolic acid 6. 8 -8. 0 1 drop 0. 1% soln. in 90% alc. yellow red Cresol red 7. 2 -8. 8 1 drop 0. 1% aq. soln. yellow red α-Naphtholphthalein 7. 3 -8. 7 1 -5 drops 0. 1% soln. in 70% alc. rose green Tropeolin OOO 7. 6 -8. 9 1 drop 0. 1% aq. soln. yellow rose-red Thymol blue 8. 0 -9. 6 1 -5 drops 0. 1% aq. soln. yellow blue Phenolphthalein 8. 0 -10. 0 1 -5 drops 0. 1% soln. in 70% alc. colorless red α-Naphtholbenzein 9. 0 -11. 0 1 -5 drops 0. 1% soln. in 90% alc. yellow blue Thymolphthalein 9. 4 -10. 6 1 drop 0. 1% soln. in 90% alc. colorless blue Nile blue 10. 1 -11. 1 1 drop 0. 1% aq. soln. blue red Alizarin yellow 10. 0 -12. 0 1 drop 0. 1% aq. soln. yellow lilac Salicyl yellow 10. 0 -12. 0 1 -5 drops 0. 1% soln. in 90% alc. yellow orange-brown Diazo violet 10. 1 -12. 0 1 drop 0. 1% aq. soln. yellow violet Tropeolin O 11. 0 -13. 0 1 drop 0. 1% aq. soln. yellow orange-brown Nitramine 11. 0 -13. 0 1 -2 drops 0. 1% soln in 70% alc. colorless orange-brown
Measurement of p. H • Glass electrode standard method of p. H measurement. A potential is developed related to the hydrogen ion activity. Field instruments Benchtop models Standardized with buffer solutions of known p. H values
Interpretation of p. H Data • p. H data should be interpreted in terms of hydrogen ion activity • Approximately we can assume [H+] = {H+} p. H + p. OH = ? = 14 [H+] and [OH-] can never be zero
• p. OH or hydroxy ion activity is important in precipitation reactions involving formation of hydroxides e. g. Precipitation of Mg 2+ in softening of water with lime