Effectively Allocating Homeless Assistance Resources to End Homelessness


 The Budget • The Staff The Clients 19")
 –what is their layout? quality? What are they most suited")


- Slides: 35
Effectively Allocating Homeless Assistance Resources to End Homelessness NAEH Conference, Washington DC July 17, 2012 Katharine Gale Consulting Berkeley, CA (510) 710 -9176 kgaleconsulting@sbcglobal. net www. focusstrategies. net 1
Overview • How do we know what we're buying? • Thinking about the need • Allocating resources across program types • Shifting resources within and between programs
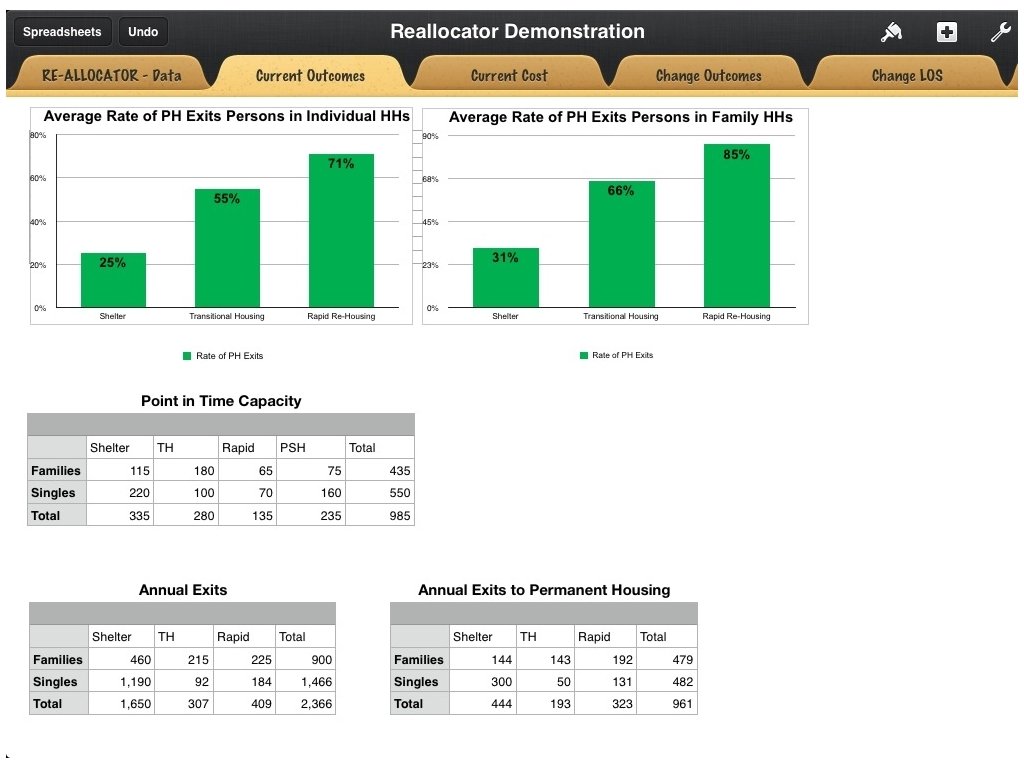
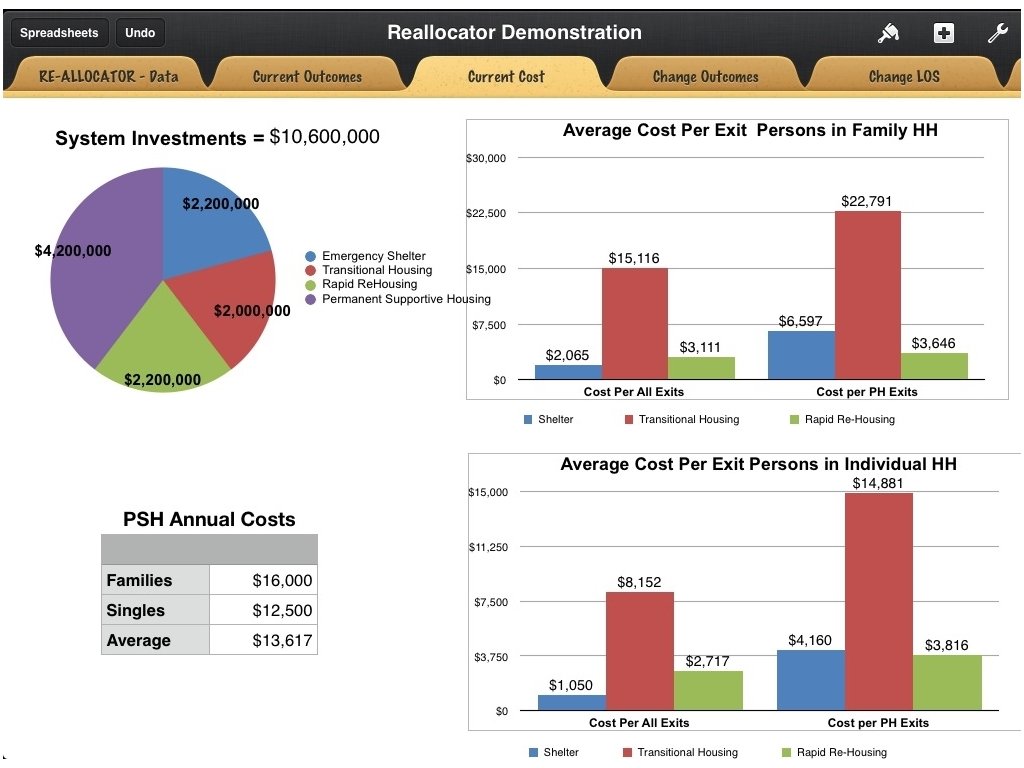
What are we buying now? • Outcomes by program type, household type, and programs • Exits to permanent housing • Lengths of stay • Returns to homelessness • Source: HMIS • Cost for outcomes achieved • Source: outcome data + grants and budgets
Average Rate of Exits to Permanent Housing - Families Source: Data from 14 Continuums in seven states that prepared Evaluators for NAEH Performance Improvement Clinics in 2011 -2012
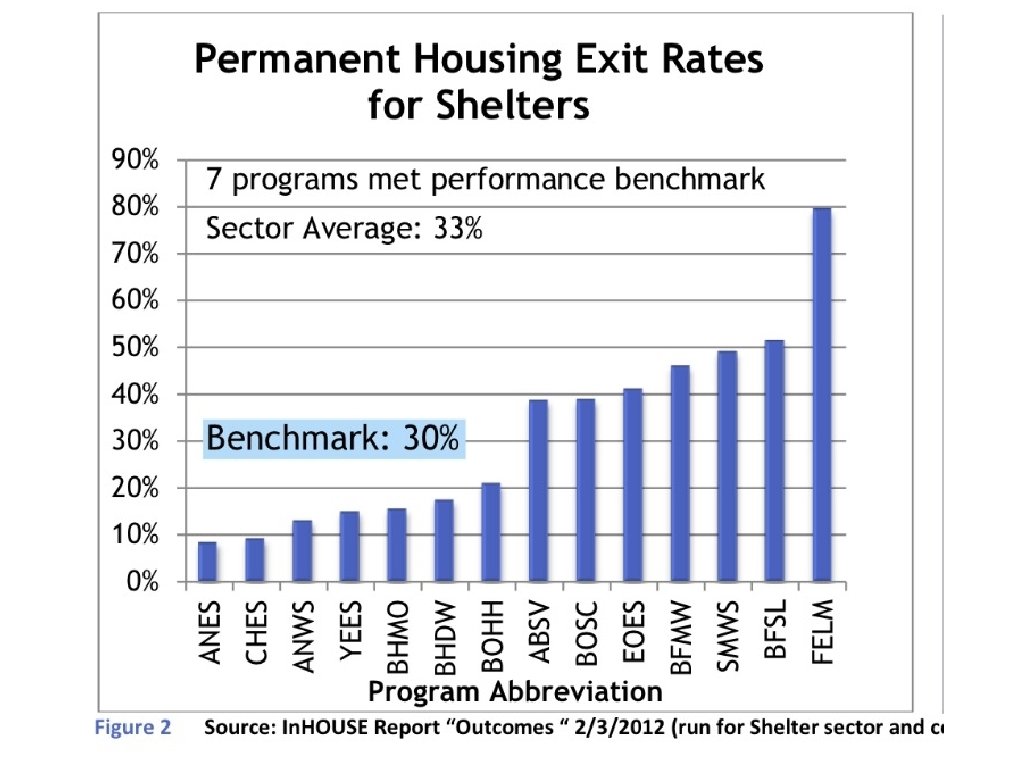
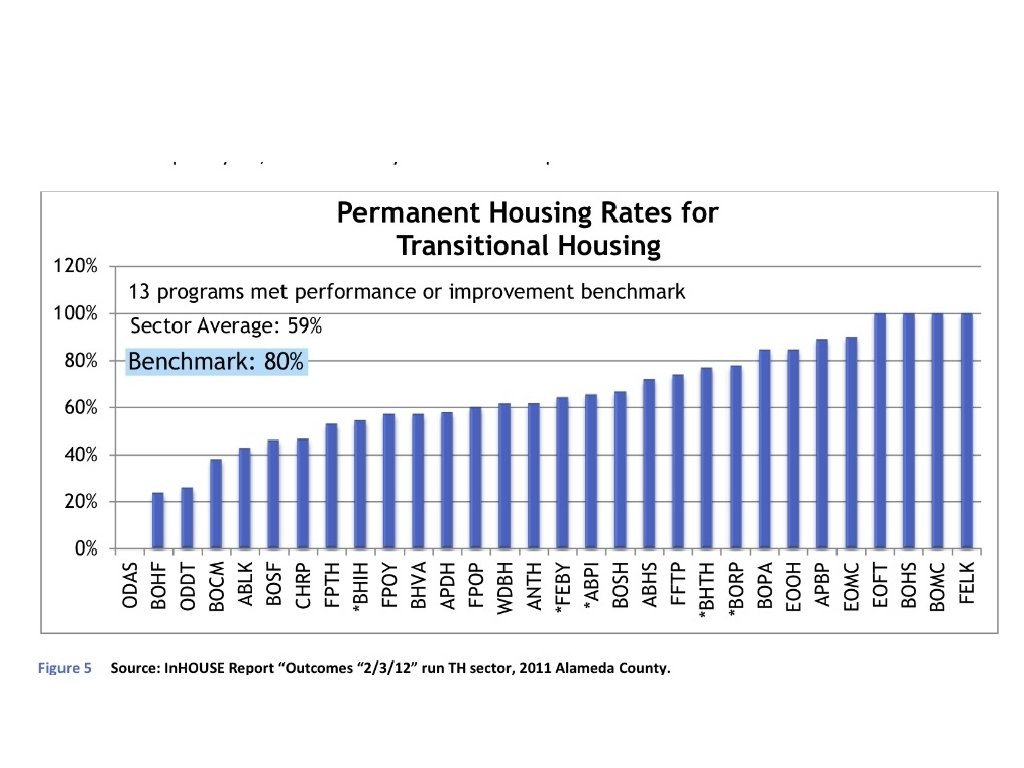
Average Rate of Exits to Permanent Housing - Singles Source: Data from 14 Continuums in seven states that prepared Evaluators for NAEH Performance Improvement Clinics in 2011 - 2012
Average lengths of stay by outcome - system wide and by program type Source: Montana HMIS, 2010 data, Chart prepared by Focus Strategies
Rates of Return within 12 months after gaining permanent housing Source: Data averaged from seven Continuums in four states that prepared Homeless System Evaluators for NAEH Performance Improvement Clinics in 2011 -2012
Averages are only part of the story Outcome vary across programs.
Where's the money going now?
Sample- Investments by Program Type Singles Source: CA county, Data from provider budgets (only partial participation)
Sample - Investments by Program Type Families Source: CA county, Data from provider budgets (only partial participation)
Average Cost Per Exit and Per PH Exit Source: Data from 14 Continuums in seven states that prepared Homeless System Evaluators for NAEH Performance Improvement Clinics in 2011 -2012
Average Cost Per Exit and Per PH Exit Source: Data from 14 Continuums in seven states that prepared Evaluators for NAEH Performance Improvement Clinics in 2011 -2012
Caveat: costs, like outcomes, vary across programs
Do the current programs and outcomes fit the need? 9
Information to think about need • Population data • Source: HMIS, Point in Time count • Utilization data • Source: HMIS, turn away data, other systems of care
Point in Time Count Source: Sacramento PIT 2011 10
Point in Time Count Source: Sacramento PIT 2011 11
Single vs. Multiple Program users - families Source: Sacramento HMIS, analyzed by Focus Strategies 14
Single vs. Multiple Program users - singles Source: Sacramento HMIS, analyzed by Focus Strategies 15
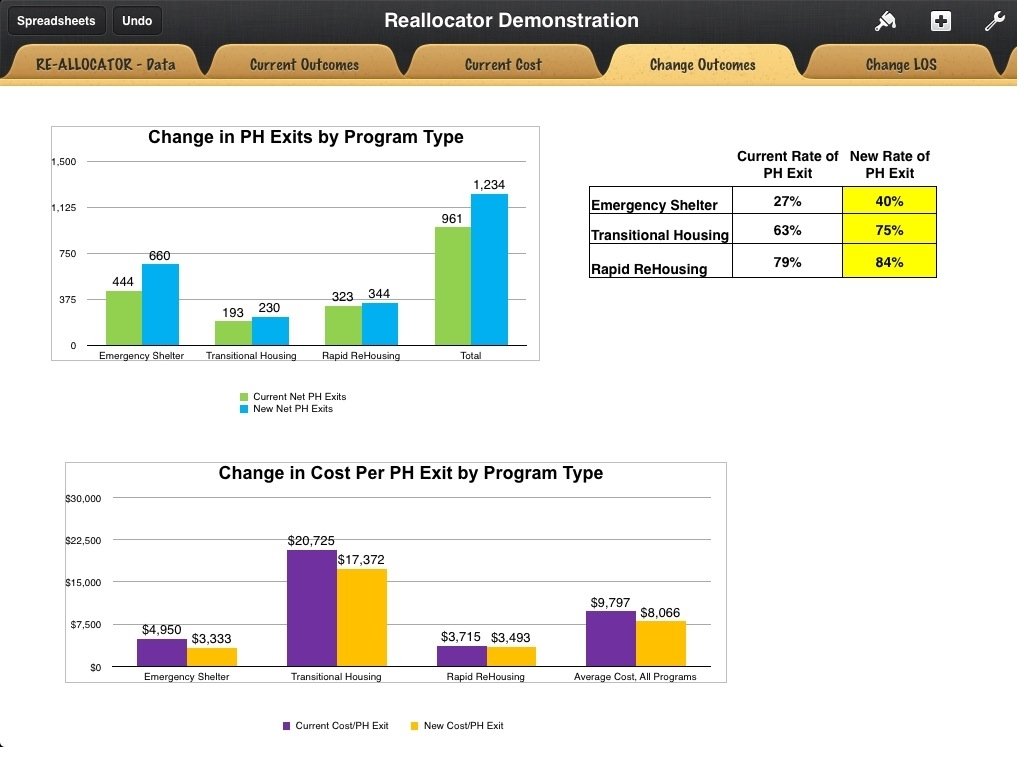
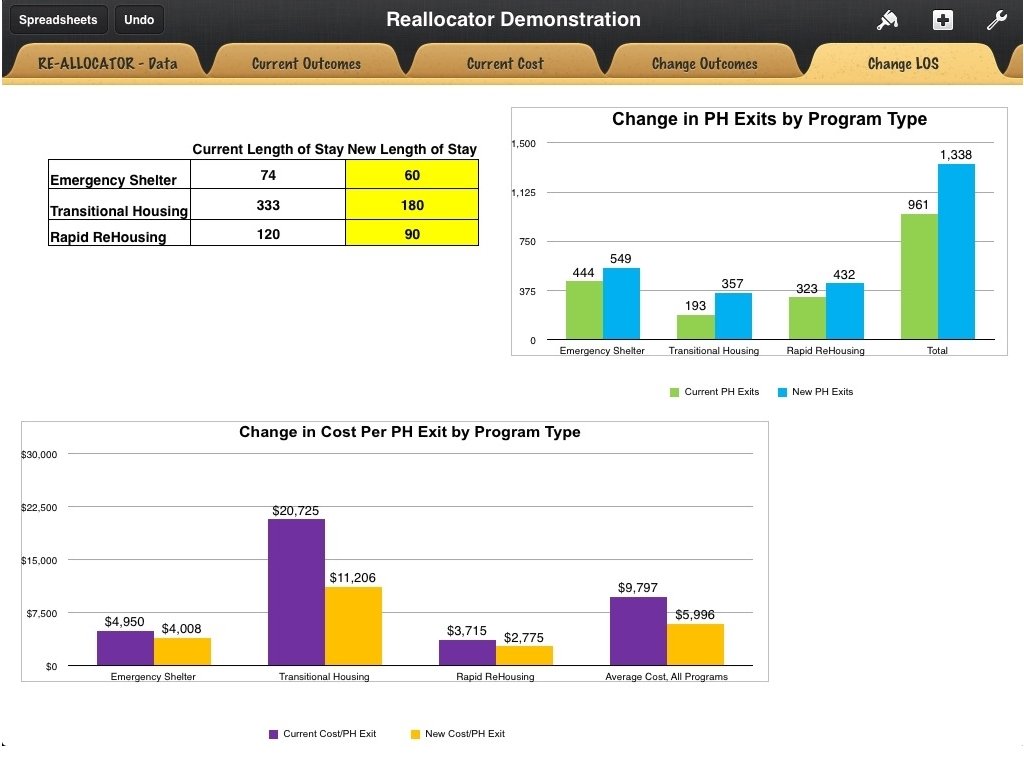
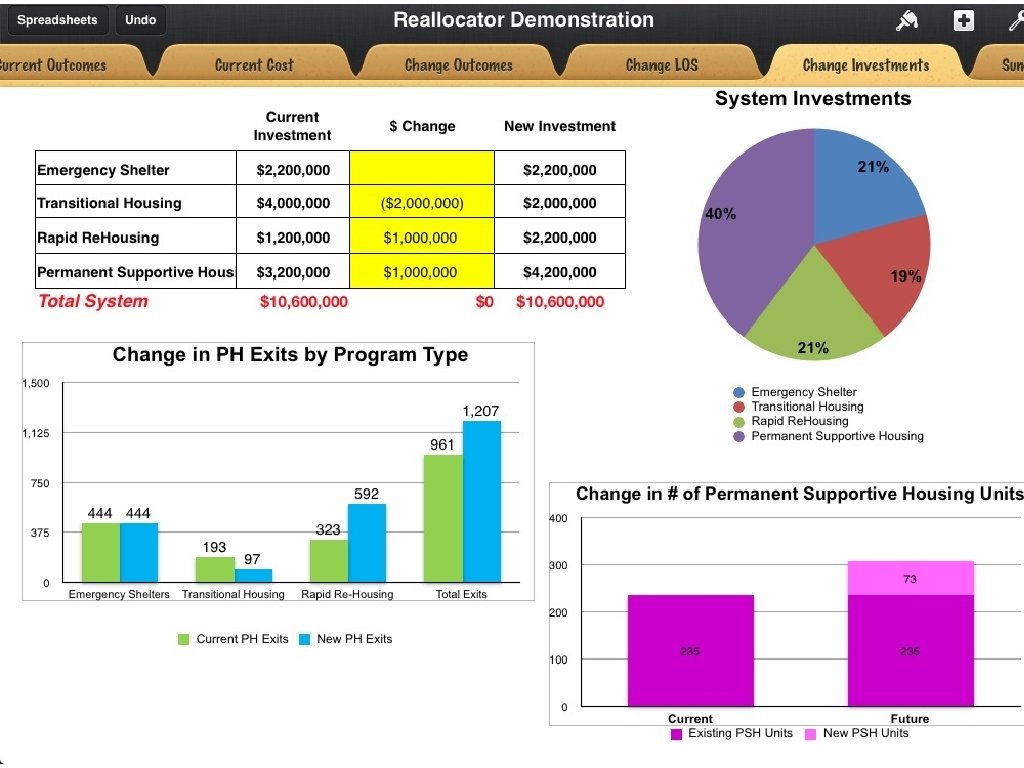
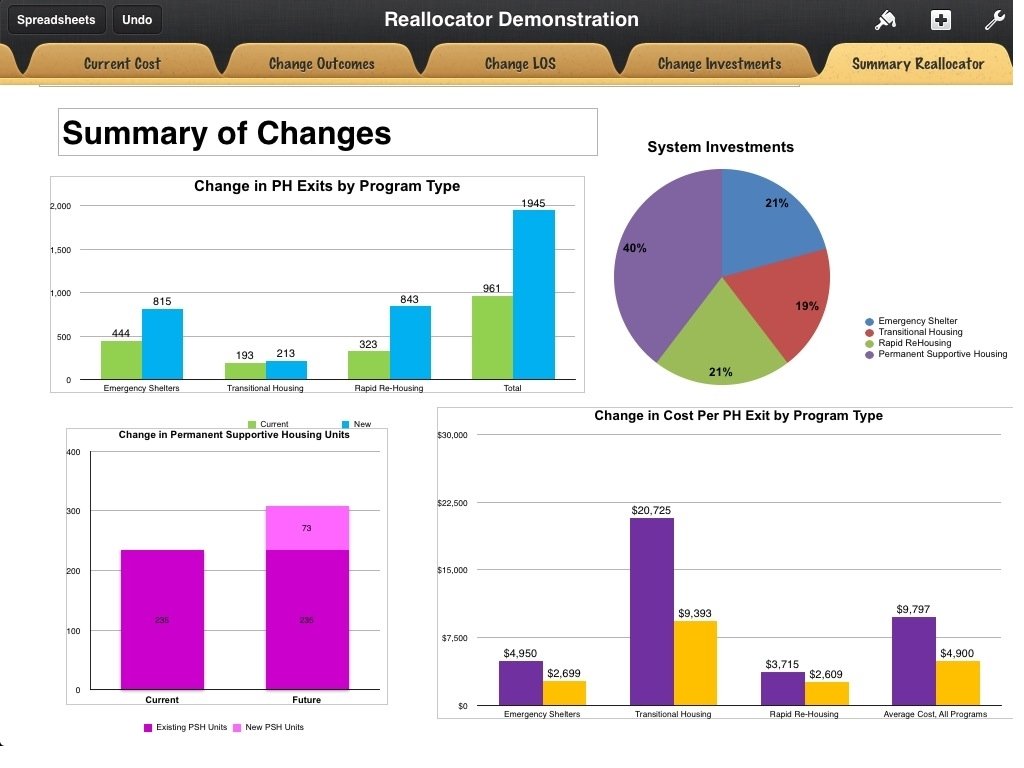
Re-Allocator Demonstration
Reallocation practicalities The Building(s) The Budget • The Staff The Clients 19
Reallocation practicalities • Facility(ies) –what is their layout? quality? What are they most suited for? What about cash? ? (Should you sell? Can you? ) • Funding – will the current resources still be available if the program changes? Are there replacement sources? • Who are current staff? What specialities do they have, and what will you need? • Who are current clients? Will they continued to be served in this program/intervention? If not, where will they go? • *(consider regular permanent affordable housing- especially if some service funds could go to rapid rehousing…) 22
The Memphis Decision • 81 units family TH becoming permanent housing with Project-based Section 8 from PHA • At least 25 units will be PSH, pay for the services from a small SHP grant • Taking the $850, 000 SHP + match that operated the 81 TH units and using that for rapid rehousing = 400 families every year • 25 PSH units + 56 permanent affordable units + 400 rapid rehousing slots every year – 88 transitional housing slots = lots more housing! 20
The Oakland Process • 53 unit SRO used as transitional housing for families. Annual SHP grant > $1 M. • Possible options: – Interim housing (shorter stays) for families plus rapid rehousing support from same grant – Permanent supportive housing for singles with new resources; spin off most of SHP grant for rapid rehousing for families • Process to determine next steps includes City, PHA, Public Health, Behavioral Health and providers 21
How will we know if it’s worked? • • Are lengths of stay for households shorter? Are housing outcomes the same or better? Are we serving more households in need? Do people we help become homeless again at same or lower rate? • (all measured under HEARTH!) • Are clients (our customers) satisfied with the change? 27
Summary • Need to know what we're buying = key outcomes • • AND the cost to get them Improving outcomes/shortening stays increases system capacity with no new money! Reallocating to meet unmet need may mean moving dollars across programs and populations. Evidence to date shows rapid rehousing is very cost-effective. It may not work for everyone but so far it does very well at a fraction of the price. The proof is in the results; measure them!