Dutch Disease and Natural Resource Curse Dutch Disease


 “Dealing with Dutch Disease”")


, “Driving Forces")


 argue that the resource curse – apparent")


- Slides: 49
Dutch Disease and Natural Resource Curse
Dutch Disease u The Dutch Disease refers to some possibly unpleasant side effects of a boom in oil or other mineral and agricultural commodities. n n n a large real appreciation in the currency; an increase in spending; an increase in the price of nontraded goods, relative to traded goods, a resultant shift of labor and land out of non-exportcommodity traded goods, and a current account deficit.
DD and Procyclicality u In most of developing countries, monetary and fiscal policy is procyclical rather than countercyclical: they tend to be expansionary in booms and contractionary in recessions, thus exacerbating the magnitudes of the swings. u Often income inequality and populist political economy are deep fundamental forces underlying the procyclicality. u Capital inflows tend to be procyclical. u Government spending, both investment projects and the government wage bill, tend to be procyclical.
Why a disease? u One interpretation, particularly relevant if the complete cycle is not adequately foreseen, is that it is all painfully reversed when the world price of the export commodity goes back down. u A second interpretation is that, even if the perceived longevity of the increase in world price turns out to be accurate, that the crowding out of non-commodity exports is undesirable, perhaps because the manufacturing sector has greater externalities for long-run growth. n This view is really just another name for the Natural Resource Curse; it has nothing to do with cyclical fluctuations per se.
Transmission channels u Two channels by which traditional tradable sectors may be crowded out by a booming resource sector and the non-tradable sector. n n Resource movement effect: increased productivity in the resource sector pushes wages up, bidding labor out of the production of the manufacturing sector. Spending effect: increased incomes shift demand from the lagging tradable sector to non-tradables, where wages will also be pushed upward. This ‘spending effect’ will further drain factors of production out of the nonresource tradable sector.
Problem of the concept u It is extremely difficult to definitively say that Dutch disease is the cause of the decreasing manufacturing sector. u There are many other factors at play in the very complex global economy. u Not only natural resource discovery, but also any development that results in a large inflow of foreign currency n n n sharp surge in natural resource prices foreign assistance foreign direct investment
Other sources of DD u Dutch Disease can also arise from commodity booms due to the discovery of new deposits or some other expansion in supply, leading to a trade surplus via exports or a capital account surplus via inward investment to develop the new resource. u In addition, the term is also used by analogy for other sorts of inflows such as the receipt of transfers (foreign aid or remittances) or a stabilization-induced capital inflow.
Economic Effects u What is the problem if a country rich in natural resources specialize in the extraction of natural resources? u If the natural resources begin to run out or if there is a downturn in prices, competitive manufacturing industries do not return as quickly or as easily as they left. This is because technological growth is smaller in the booming sector and the non-tradable sector than the non-booming tradable sector. u Also, volatility in the price of natural resources, and thus the real exchange rate, may prevent more investment from firms, since firms will not invest if they are not sure what the future economic conditions will be.
Empirical Studies u. The general impression that emerges from the empirical DD literature is that there is some evidence, although by no means strong, that some countries, specifically oil producers, have shown symptoms of the DD.
DD and manufacture value added u Ismail finds that, in general, a 10. 0 percent increase in an oil windfall is associated with a 3. 4 percent fall in value added across manufacturing sectors. Note: Ƞ is the coefficient of oil windfall shocks Source: Kareem Ismail (2010), “The Structural Manifestation of the `Dutch Disease’: The Case of Oil Exporting Countries”
To. T and RER Source: Brahmbhatt, Canuto, and Vostroknutova (2010) “Dealing with Dutch Disease”
Natural Resources and manufacture Tradable sector in resource rich countries is lower than the norm by approximately 15 percent of GDP.
NR and manufacture value added Table 1. Determinants of the level of industrialization 1990 -2018 Dependent variable: Manufacturing value added as a percentage of GDP (1) (2) (3) (4) ln pop 5. 34*** (0. 49) 6. 03*** (0. 49) 6. 00*** (0. 49) 6. 34*** (0. 49) (ln pop)2 -0. 12*** (0. 02) -0. 14*** (0. 02) -0. 15*** (0. 02) ln pcgdp 14. 21*** (1. 10) 12. 83*** (1. 10) 18. 92*** (1. 83) 20. 83*** (1. 60) (ln pcgdp) 2 -0. 71*** (0. 06) -0. 64*** (0. 06) -0. 98*** (0. 10) -1. 08*** (0. 09) 2000 s -1. 82*** (0. 22) -1. 58*** (0. 21) 37. 36*** (10. 43) -1. 54*** (0. 21) 2010 s -3. 32*** (0. 23) -3. 16*** (0. 23) 36. 01*** (11. 52) -3. 12*** (0. 23) -0. 14*** (0. 01) 2. 42*** (0. 39) nr ln pcgdp*2000 s -9. 05*** (2. 37) (ln pcgdp) 2*2000 s 0. 52*** (0. 13) ln pcgdp*2010 s -8. 91*** (2. 59) (ln pcgdp) 2*2010 s 0. 50*** (0. 14) ln pcgdp*nr -0. 59*** (0. 39) (ln pcgdp) 2*nr 0. 03*** (0. 00) Regional dummies Yes Yes Observations 4784 4565 R 2 0. 31 0. 34 0. 35 Source: Seungho Lee and Chong. Sup Kim (2020), “Driving Forces behind Premature Deindustrialization in Latin America”
NR and manufacture value added Source: Seungho Lee and Chong-Sup Kim (2020), “Driving Forces behind Premature Deindustrialization in Latin America”
NR and manufacture growth
DD and Manufacture exports u Question: Controlling for the other empirically relevant determinants of trade, do energy exporters tend to export less manufacturing in times of booms (and vice versa)? DD: 1) energy price exposure =1(i is net energy exporter) x log(real price of energy) 2) net energy exports
Regression Results Dependent Variable: Real manufacturing trade between country of origin and country of destination
Regression Results
Empirical Results 1. 2. The real energy price elasticity of manufacturing exports in net energy exporting countries is estimated to be, on average, close to -0. 5. In other words, a 1% increase in the price of energy will, everything else held constant, decrease a net energy exporter’s real manufacturing exports by half a percent. The net energy export elasticity of manufacturing exports, when instrumented by world oil prices, is 0. 08. In other words, a 1% increase in net energy exports will, everything else held constant, decrease a net energy exporter’s real manufacturing exports by one eighth of a percent.
Policy options to avoid DD u slowing the appreciation of the real exchange rate n n n Sterilization reduces the spending effect. Letting the revenues into the country slowly, a country can have a stable revenue stream. By saving the boom revenues, a country is saving some of the revenues for future generations. u boosting the competitiveness of the manufacturing sector n Investing in education and infrastructure can increase the competitiveness of the manufacturing sector.
Natural Resource Curse
Resource Curse Thesis u. Economies with abundant natural resources have tended to grow less rapidly than natural-resource-scarce economies.
Reasons u. Why? n n n Easy riches lead to sloth. A discovery of natural resource deposits can lead to a feeding frenzy in which competing factions fight for the natural resource rents, and end up inefficiently exhausting the public good. Rent seeking activity Resource based growth is ineffective because the world prices of primary exports relative to manufactures show a deep tendency towards secular decline. Beneficial forward and linkages from primary exports to the rest of the economy is small.
Cont. n n n The growth in manufacturing, a sector whose expansion is commonly believed to generate positive productivity externalities, is inhibited. Economies of scale and linkage effects in manufacture Exploitation of natural resource wealth may reduce returns to human capital investments, and thus diminish incentives for educational attainment Dutch disease and vulnerability to external shocks Wrong and too optimistic projections u. What about the benefits?
Natural resource dependence and economic growth
Empirical Studies of Natural Resources Curse u Dependent variable: real per capita growth rate of GDP 1970 -89 LGDP 70 SXP SOPEN INV 7089 BUR Const. -1. 921 -7. 806 2. 167 0. 085 0. 370 12. 472 -6. 243 -2. 942 3. 845 2. 679 3. 153 6. 304 R 2=56 • • • No. of observations=56 LGDP 70: real purchasing power parity adjusted GDP per capita in 1970 SXP: Share of primary exports in GDP in 1971 SOPEN: the fraction of years during 1965 -90 in which the country is rated as an open economy (Sachs and Warner) INV 7089: ratio of real gross domestic investment to real GDP averaged over 1970 -89 BUR: The bureaucratic efficiency index in Mauro (1995). Source: Sachs and Warner “Natural Resource Abundance and Economic Growth”
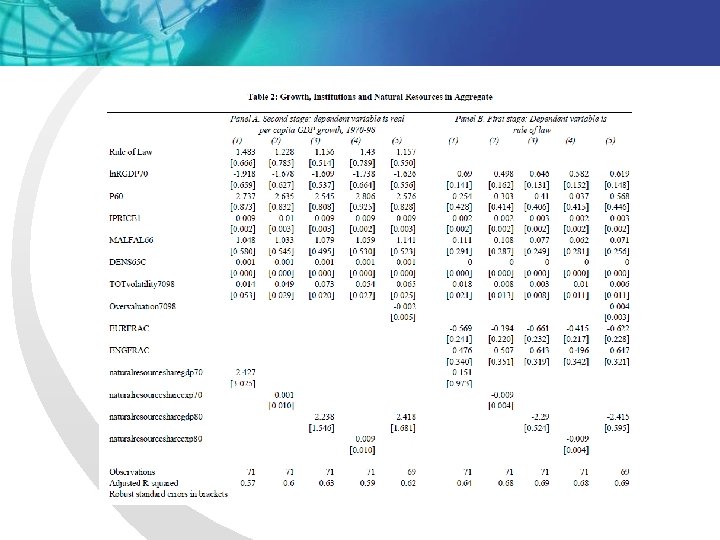
Discussion 1 u However, there are both growth losers and growth winners among countries rich in natural resources constitute. u The main reason for these diverging experiences is differences in the quality of institutions. More natural resources push aggregate income down, when institutions are grabber friendly, while more resources raise income, when institutions are producer friendly.
Interaction between resource abundance and institutional quality Dependent variable is GDP growth Source: Mehlum, Halvor, Karl Moene and Ragnar Torvik. 2006. “Institutions and the resource curse, ” The Economic Journal 116
Neutral effect for countries with high institutional quality u For countries with high institutional quality (higher than the threshold 14. 34/15. 40 =. 93) the resource curse does not apply. u 15 of the 87 countries in our sample have the sufficient institutional quality to neutralize the resource curse.
Discussion 2 u. Some natural resources—oil and minerals in particular—exert a negative and nonlinear impact on growth via their deleterious impact on institutional quality. u. Sala-i-Martin, Xavier, and Arvind Subramanian, (2003) "Addressing the Natural Resource Curse: An Illustration from Nigeria“ Journal of African Economies 03
NR and corruption Natural resource abundance and corruption 1996 -2016 All developing countries Developing Latin American countries Source: Chong-Sup Kim and Seungho Lee (2020), “Natural Resources, Non-Resource Taxation and Corruption: An Illustration from Developing Latin American Countries”
NR and corruption Table 2. Natural resource abundance, non-resource tax and corruption 1996 -2016 Dependent Variable: Control of Corruption NR (1) OLS (2) OLS (3) OLS (4) OLS -0. 018*** (0. 001) -0. 022*** (0. 001) -0. 014*** (0. 001) -0. 017*** (0. 002) 0. 038*** (0. 002) 0. 036*** (0. 003) NRTAX 0. 0003* (0. 0001) NR*NRTAX Ln (per capita gdp) 0. 172*** (0. 013) 0. 279*** (0. 015) 0. 239*** (0. 014) 0. 247*** (0. 015) Ln (population) -0. 086*** (0. 007) -0. 083*** (0. 006) -0. 070*** (0. 006) -0. 072*** (0. 006) Inflation -0. 003*** (0. 001) -0. 002** (0. 001) -0. 001* (0. 001) Openness 0. 001*** (0. 000) 0. 002*** (0. 000) 0. 000 (0. 000) Year dummies No Yes Yes Regional dummies No Yes Yes Observations 1736 1535 R 2 0. 34 0. 42 0. 51 Source: Chong-Sup Kim and Seungho Lee (2020), “Natural Resources, Non-Resource Taxation and Corruption: An Illustration from Developing Latin American Countries”
The effect of non-resource tax Natural resource abundance and corruption 1996 -2016 Observations from the Latin American sample with below-average non-resource tax revenues (% GDP) Observations from the Latin American sample with above -average non-resource tax revenues (% GDP)
NR and Corruption in L. A. Control of Corruption Natural resource rents (% of GDP) 1998 2003 2007 2012 2016 -0. 60 -0. 48 -0. 40 -0. 62 -0. 68 1. 5 3. 5 4. 5 2. 6
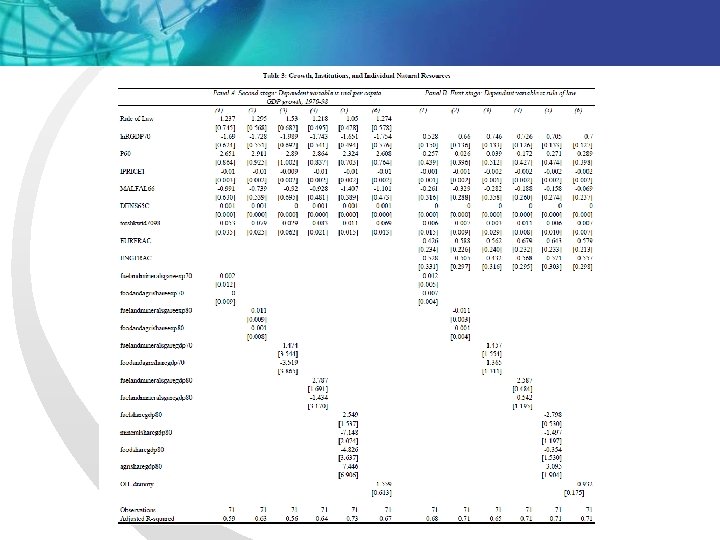
Discussion 3 u Lederman and Maloney (2007) argue that the resource curse – apparent in the simple correlation between specialization and growth – disappears when a measure of export concentration is introduced in the regressions. They thus suggest that the curse is one of lack of diversification, not resources. n Natural resources do spur economic development when combined with the accumulation of knowledge for economic innovation. u Lederman and Maloney (eds. )(2007) Natural Resources – Neither Curse nor Destiny
NR, X Concentration and growth First column shows the variables included. The coefficients are those of NR, HI, and IIT.
NR, X Concentration and growth
Discussion 4 u. It is the volatility of natural resource prices, rather than the trend, that is bad for economic growth.
Export diversification and growth Export Diversificati on Export growth variance ρ = -0. 420 GDP growth variance ρ = 0. 377 GDP growth ρ = -0. 406
Natural Resources and HDI u Natural resources are positively correlated with human development. u Natural resources affect human development primarily through channels other than income. u However, for Latin America the impact of natural resources on human development is significantly smaller compared with the rest of the natural resource abundant regions and countries, or close to zero.
Natural Resources and HDI Source: Pineda and Rodriguez, “Curse or Blessing? Natural Resources and Human Development”
Natural Resources and components of HDI
Policy recommendations: vulnerability u sound fiscal policy: a counter-cyclical fiscal policy with respect to commodity prices u conservative price assumptions for the major export commodities. u creation of a stabilization fund n n it helps to smooth government revenues - and thus government spending - over the commodity-price cycle. it can also serve to reduce exchange-rate fluctuations. u Resource-based economies also need a significant degree of exchange-rate flexibility in order to be able to accommodate shifts in their terms-of-trade.
Recommendation: DD u As for Dutch disease, direct taxation of the natural resource sector should be increased, though it must be assured that these sectors, which are often critical to growth, remain sufficiently profitable to allow for their further development. n n The proceeds of the increased resource taxes should then be used to lower overall tax levels in the economy and in particular, to cut non-wage labor costs. Taxing more of the resource rent away should also decrease wages in the resource sector and hence diminish the pressure on wages in other sectors.
Political Economy u The allocation of talent in natural resource economies may be biased in favor of the resource sector, as highly capable individuals focus on securing resource rents rather than building successful businesses in other sectors. u Countries with resource-based economies are also more likely to experience large-scale rebellions and civil wars. u A larger share of natural resources in exports is associated with more corruption, which, in turn, is associated with slower long-term growth. u A higher natural resource share in the economy is often accompanied by greater inequality of incomes, which has also been shown to undermine long-term growth performance. u Recommendations n n tax away a fair share of the resource rent fairly efficient and non-corrupt administration
Recommendations: Diversification u get framework conditions for entrepreneurship right u make sure that the business environment is generally competitive u give sufficient incentives to invest in non-resource sectors. u use the tax system to assist the development of the non-resource sector. u set up framework conditions so as to allow the banking sector to develop u facilitate the emergence of a venture capital industry
Dutch Disease and Natural Resource Curse