Discrete Choice ModelLimited Depend Model Python Working Group





- Slides: 47
Discrete Choice Model(Limited Depend Model) Python Working Group Presentation 2018 Fall Jikhan Jeong Presented in IAEE Conference 2015 Modified Version with ML approach
1 INTRO 2
DO WANT TO BUY PIZZA?
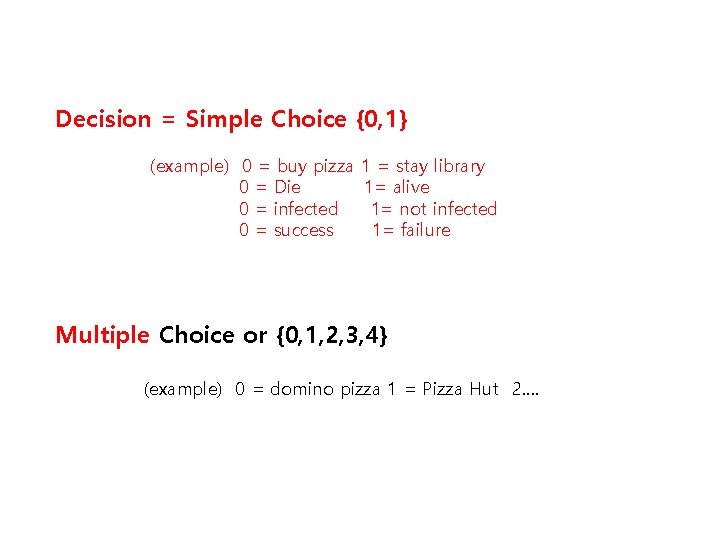
Decision = Simple Choice {0, 1} (example) 0 = buy pizza 0 = Die 0 = infected 0 = success 1 = stay library 1= alive 1= not infected 1= failure Multiple Choice or {0, 1, 2, 3, 4} (example) 0 = domino pizza 1 = Pizza Hut 2….
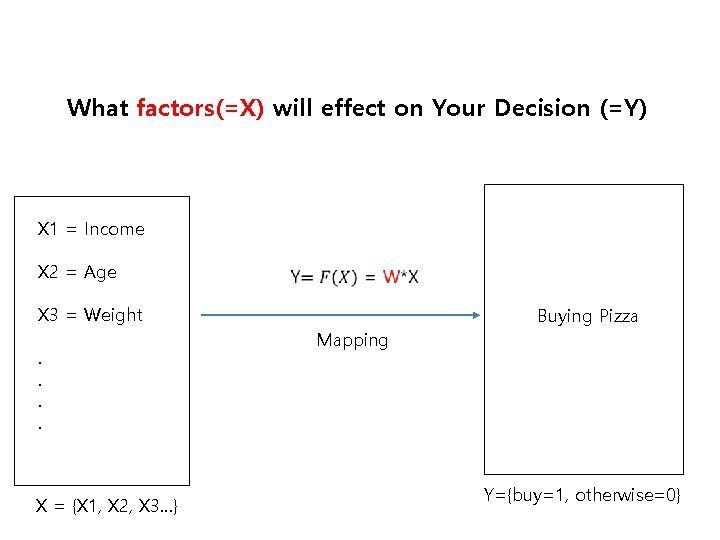
What factors(=X) will effect on Your Decision (=Y) X 1 = Income X 2 = Age X 3 = Weight. . X = {X 1, X 2, X 3…} Mapping Buying Pizza Y={buy=1, otherwise=0}
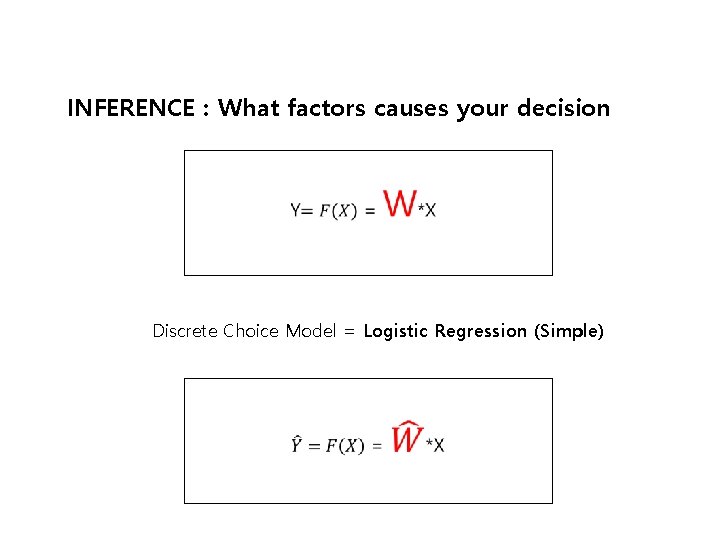
INFERENCE : What factors causes your decision Discrete Choice Model = Logistic Regression (Simple)
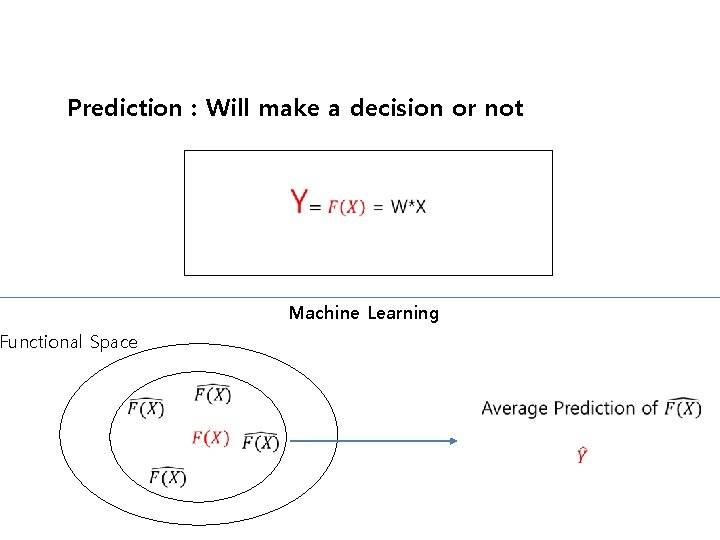
Prediction : Will make a decision or not Machine Learning Functional Space
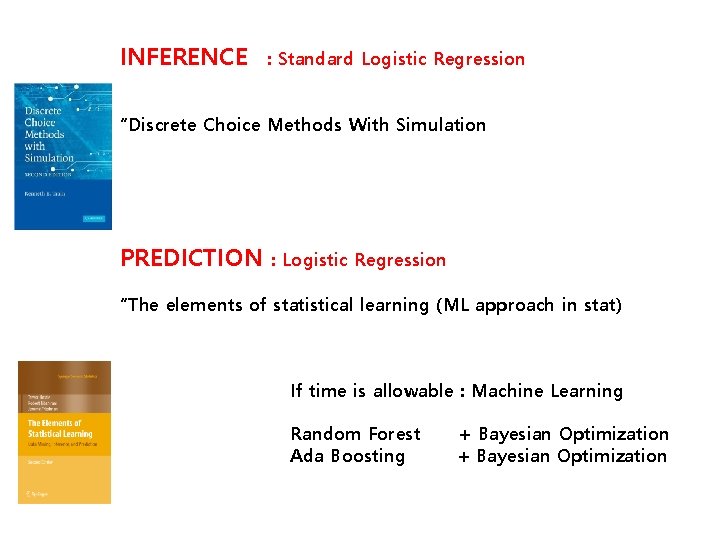
INFERENCE : Standard Logistic Regression “Discrete Choice Methods With Simulation PREDICTION : Logistic Regression “The elements of statistical learning (ML approach in stat) If time is allowable : Machine Learning Random Forest Ada Boosting + Bayesian Optimization
Research Example “ 1. How to apply” “ 2. Code for LR” “ 3. ML approach”
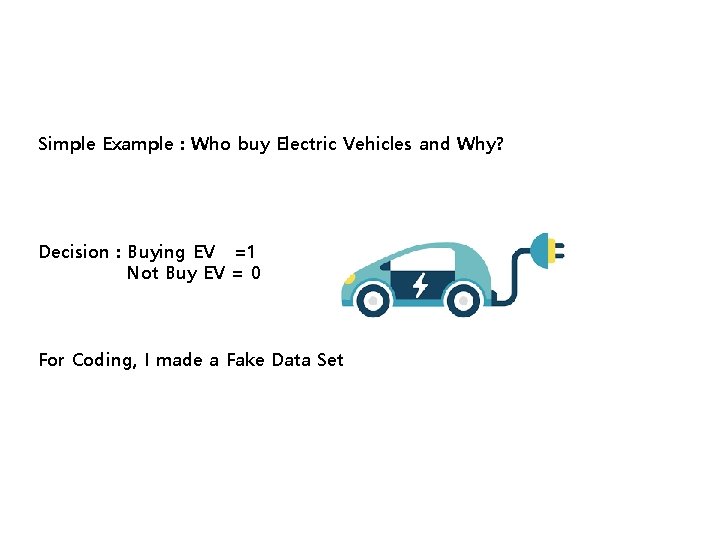
Simple Example : Who buy Electric Vehicles and Why? Decision : Buying EV =1 Not Buy EV = 0 For Coding, I made a Fake Data Set
Intro Why we need electric vehicles? National leaders have tried to find effective methods of reducing both carbon emissions and the dependency on fossil fuels. Electric Vehicles (EVs) enable us to reduce : ① Greenhouse gas emissions in the transport sector, ② Car operation costs in times of high oil prices ③ Our dependency on fossil fuels.
Intro EV Promotion in South Korean Government’s goal : L A O G ① Producing 1. 2 million electric vehicles by 2015 ② Registering 1 million electric vehicles by 2020. Subsiding EV : HOW ① The Ministry of Environment is subsidizing EV purchases by approximately $13, 900 ② 10 major cities or provincial jurisdictions are providing additional subsidies, ranging from $2, 800 to $7, 400
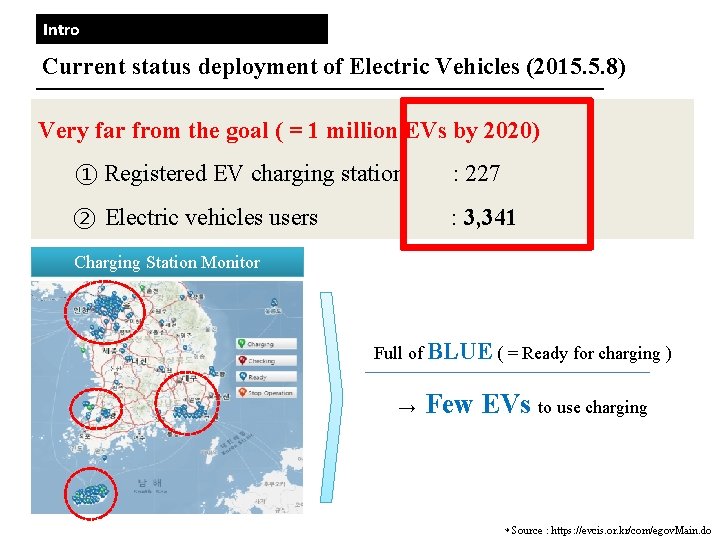
Intro Current status deployment of Electric Vehicles (2015. 5. 8) Very far from the goal ( = 1 million EVs by 2020) ① Registered EV charging station : 227 ② Electric vehicles users : 3, 341 Charging Station Monitor Full of BLUE ( = Ready for charging ) → Few EVs to use charging * Source : https: //evcis. or. kr/com/egov. Main. do
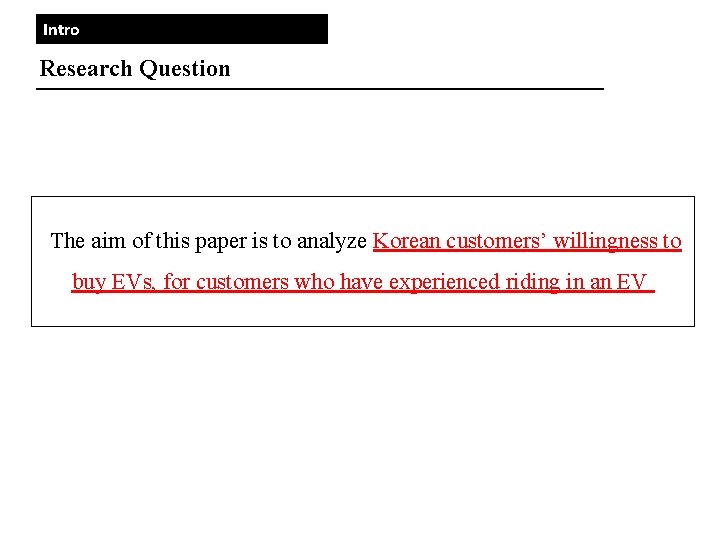
Intro Research Question The aim of this paper is to analyze Korean customers’ willingness to buy EVs, for customers who have experienced riding in an EV
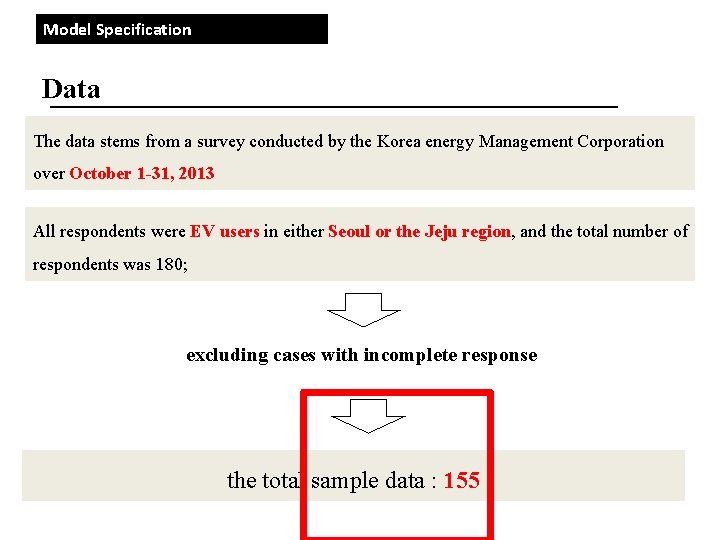
Model Specification Data The data stems from a survey conducted by the Korea energy Management Corporation over October 1 -31, 2013 All respondents were EV users in either Seoul or the Jeju region, and the total number of respondents was 180; excluding cases with incomplete response the total sample data : 155
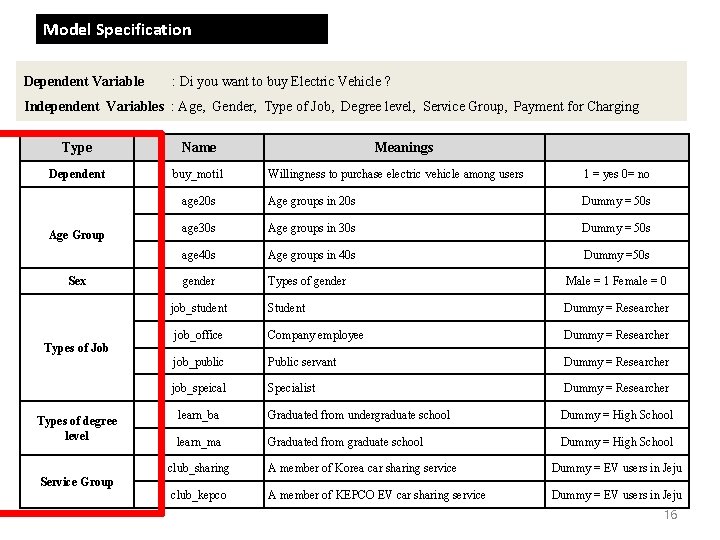
Model Specification Dependent Variable : Di you want to buy Electric Vehicle ? Independent Variables : Age, Gender, Type of Job, Degree level, Service Group, Payment for Charging Type Name Dependent buy_moti 1 Age Group Sex Meanings Willingness to purchase electric vehicle among users 1 = yes 0= no age 20 s Age groups in 20 s Dummy = 50 s age 30 s Age groups in 30 s Dummy = 50 s age 40 s Age groups in 40 s Dummy =50 s gender Types of gender Male = 1 Female = 0 job_student Student Dummy = Researcher job_office Company employee Dummy = Researcher job_public Public servant Dummy = Researcher job_speical Specialist Dummy = Researcher learn_ba Graduated from undergraduate school Dummy = High School learn_ma Graduated from graduate school Dummy = High School Types of Job Types of degree level club_sharing A member of Korea car sharing service Dummy = EV users in Jeju club_kepco A member of KEPCO EV car sharing service Dummy = EV users in Jeju Service Group 16
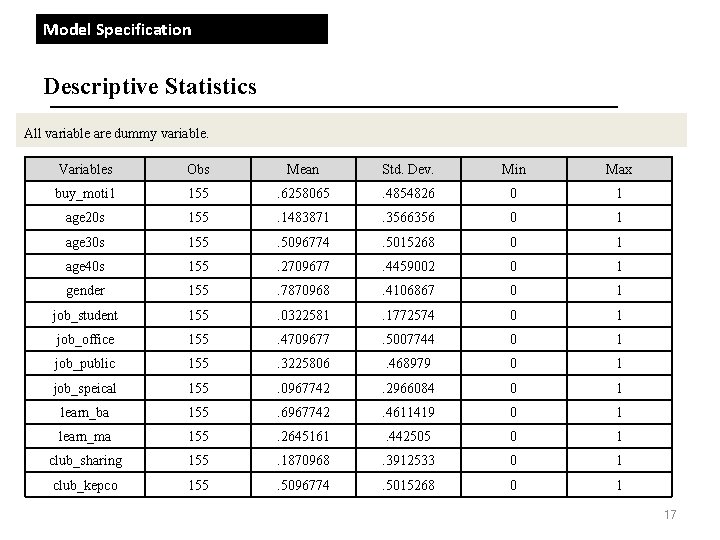
Model Specification Descriptive Statistics All variable are dummy variable. Variables Obs Mean Std. Dev. Min Max buy_moti 1 155 . 6258065 . 4854826 0 1 age 20 s 155 . 1483871 . 3566356 0 1 age 30 s 155 . 5096774 . 5015268 0 1 age 40 s 155 . 2709677 . 4459002 0 1 gender 155 . 7870968 . 4106867 0 1 job_student 155 . 0322581 . 1772574 0 1 job_office 155 . 4709677 . 5007744 0 1 job_public 155 . 3225806 . 468979 0 1 job_speical 155 . 0967742 . 2966084 0 1 learn_ba 155 . 6967742 . 4611419 0 1 learn_ma 155 . 2645161 . 442505 0 1 club_sharing 155 . 1870968 . 3912533 0 1 club_kepco 155 . 5096774 . 5015268 0 1 17
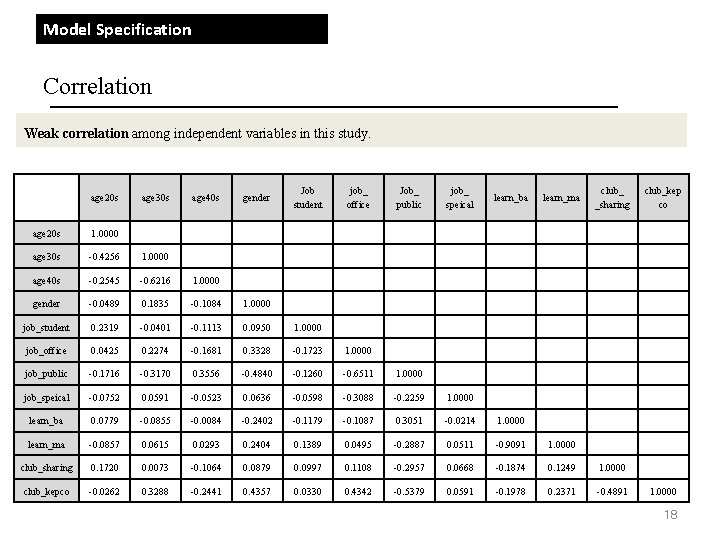
Model Specification Correlation Weak correlation among independent variables in this study. age 20 s age 30 s age 40 s gender Job student job_ office Job_ public job_ speical learn_ba learn_ma club_ _sharing age 20 s 1. 0000 age 30 s -0. 4256 1. 0000 age 40 s -0. 2545 -0. 6216 1. 0000 gender -0. 0489 0. 1835 -0. 1084 1. 0000 job_student 0. 2319 -0. 0401 -0. 1113 0. 0950 1. 0000 job_office 0. 0425 0. 2274 -0. 1681 0. 3328 -0. 1723 1. 0000 job_public -0. 1716 -0. 3170 0. 3556 -0. 4840 -0. 1260 -0. 6511 1. 0000 job_speical -0. 0752 0. 0591 -0. 0523 0. 0636 -0. 0598 -0. 3088 -0. 2259 1. 0000 learn_ba 0. 0779 -0. 0855 -0. 0084 -0. 2402 -0. 1179 -0. 1087 0. 3051 -0. 0214 1. 0000 learn_ma -0. 0857 0. 0615 0. 0293 0. 2404 0. 1389 0. 0495 -0. 2887 0. 0511 -0. 9091 1. 0000 club_sharing 0. 1720 0. 0073 -0. 1064 0. 0879 0. 0997 0. 1108 -0. 2957 0. 0668 -0. 1874 0. 1249 1. 0000 club_kepco -0. 0262 0. 3288 -0. 2441 0. 4357 0. 0330 0. 4342 -0. 5379 0. 0591 -0. 1978 0. 2371 -0. 4891 club_kep co 1. 0000 18
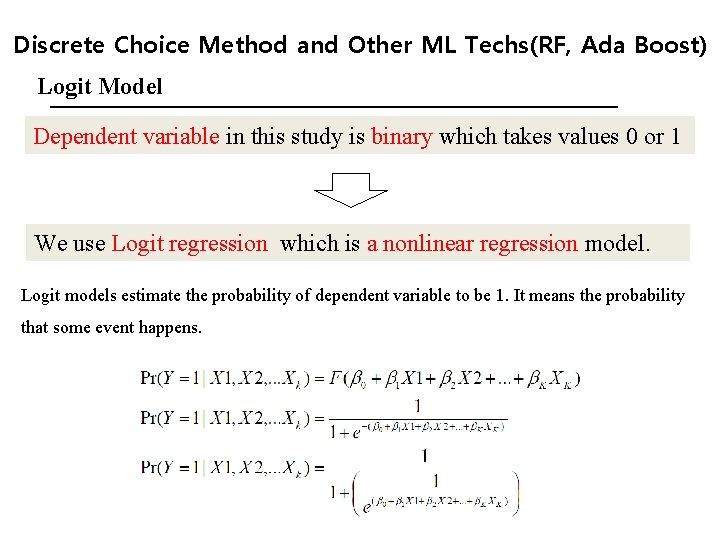
Discrete Choice Method and Other ML Techs(RF, Ada Boost) Logit Model Dependent variable in this study is binary which takes values 0 or 1 We use Logit regression which is a nonlinear regression model. Logit models estimate the probability of dependent variable to be 1. It means the probability that some event happens.
RESULT 20
2 INFERENCE 21
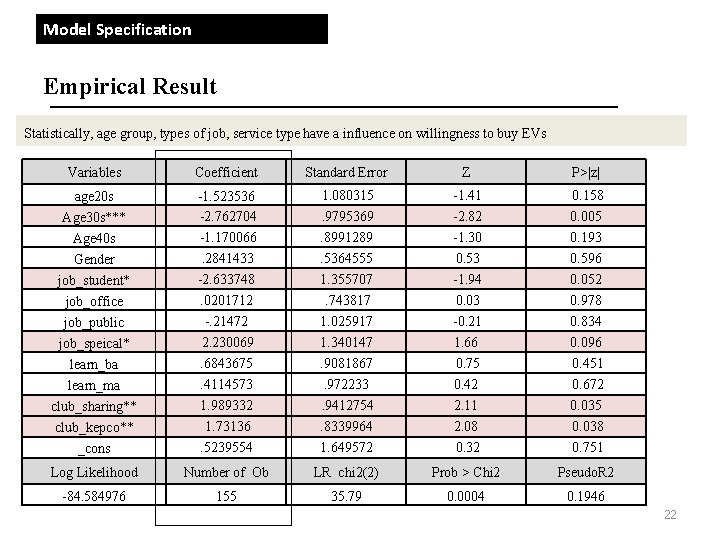
Model Specification Empirical Result Statistically, age group, types of job, service type have a influence on willingness to buy EVs Variables Coefficient Standard Error Z P>|z| age 20 s 1. 080315 -1. 41 0. 158 Age 30 s*** -1. 523536 -2. 762704 . 9795369 -2. 82 0. 005 Age 40 s -1. 170066 . 8991289 -1. 30 0. 193 Gender . 2841433 . 5364555 0. 53 0. 596 job_student* -2. 633748 1. 355707 -1. 94 0. 052 job_office . 0201712 . 743817 0. 03 0. 978 job_public -. 21472 1. 025917 -0. 21 0. 834 job_speical* 2. 230069 1. 340147 1. 66 0. 096 learn_ba . 6843675 . 9081867 0. 75 0. 451 learn_ma . 4114573 . 972233 0. 42 0. 672 club_sharing** 1. 989332 . 9412754 2. 11 0. 035 club_kepco** 1. 73136 . 8339964 2. 08 0. 038 _cons . 5239554 1. 649572 0. 32 0. 751 Log Likelihood Number of Ob LR chi 2(2) Prob > Chi 2 Pseudo. R 2 -84. 584976 155 35. 79 0. 0004 0. 1946 22
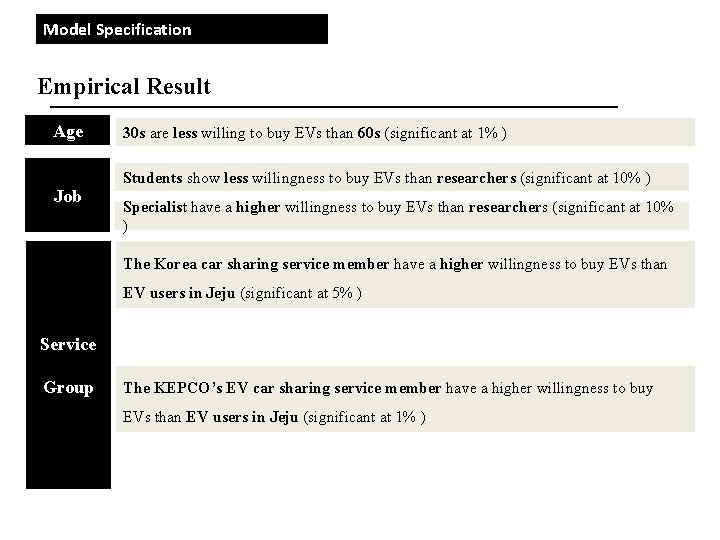
Model Specification Empirical Result Age Job 30 s are less willing to buy EVs than 60 s (significant at 1% ) Students show less willingness to buy EVs than researchers (significant at 10% ) Specialist have a higher willingness to buy EVs than researchers (significant at 10% ) The Korea car sharing service member have a higher willingness to buy EVs than EV users in Jeju (significant at 5% ) Service Group The KEPCO’s EV car sharing service member have a higher willingness to buy EVs than EV users in Jeju (significant at 1% )
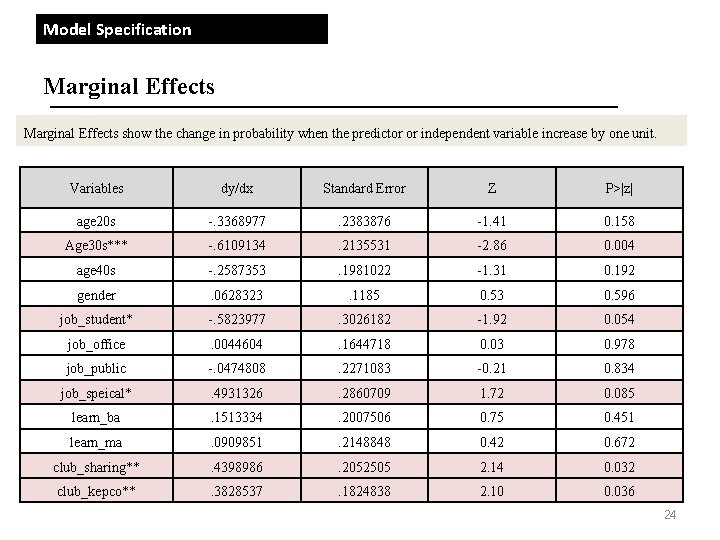
Model Specification Marginal Effects show the change in probability when the predictor or independent variable increase by one unit. Variables dy/dx Standard Error Z P>|z| age 20 s -. 3368977 . 2383876 -1. 41 0. 158 Age 30 s*** -. 6109134 . 2135531 -2. 86 0. 004 age 40 s -. 2587353 . 1981022 -1. 31 0. 192 gender . 0628323 . 1185 0. 53 0. 596 job_student* -. 5823977 . 3026182 -1. 92 0. 054 job_office . 0044604 . 1644718 0. 03 0. 978 job_public -. 0474808 . 2271083 -0. 21 0. 834 job_speical* . 4931326 . 2860709 1. 72 0. 085 learn_ba . 1513334 . 2007506 0. 75 0. 451 learn_ma . 0909851 . 2148848 0. 42 0. 672 club_sharing** . 4398986 . 2052505 2. 14 0. 032 club_kepco** . 3828537 . 1824838 2. 10 0. 036 24
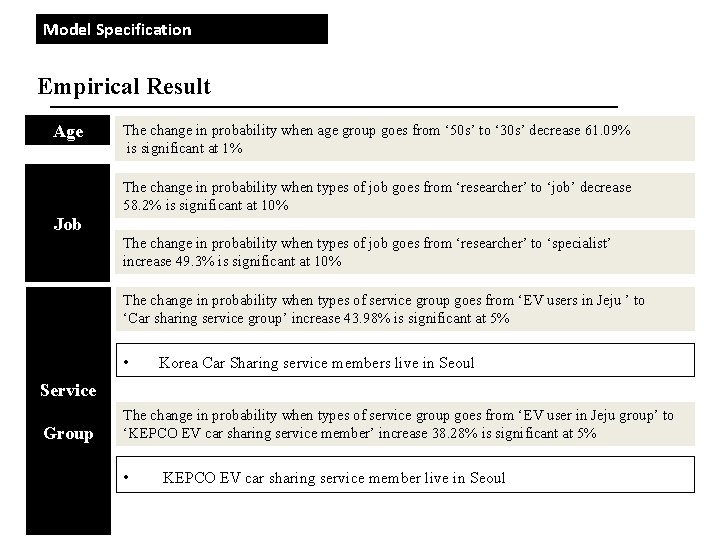
Model Specification Empirical Result Age The change in probability when age group goes from ‘ 50 s’ to ‘ 30 s’ decrease 61. 09% is significant at 1% The change in probability when types of job goes from ‘researcher’ to ‘job’ decrease 58. 2% is significant at 10% Job The change in probability when types of job goes from ‘researcher’ to ‘specialist’ increase 49. 3% is significant at 10% The change in probability when types of service group goes from ‘EV users in Jeju ’ to ‘Car sharing service group’ increase 43. 98% is significant at 5% • Korea Car Sharing service members live in Seoul Service Group The change in probability when types of service group goes from ‘EV user in Jeju group’ to ‘KEPCO EV car sharing service member’ increase 38. 28% is significant at 5% • KEPCO EV car sharing service member live in Seoul
3 RESULTS AND IMPLICATION
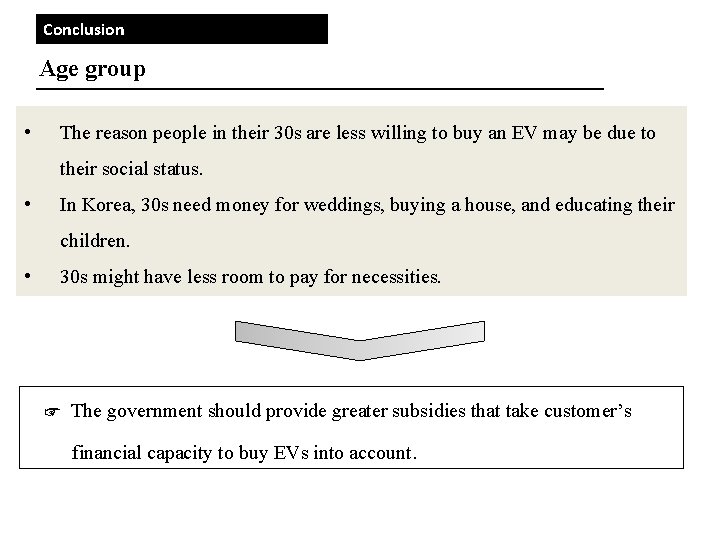
Conclusion Age group • The reason people in their 30 s are less willing to buy an EV may be due to their social status. • In Korea, 30 s need money for weddings, buying a house, and educating their children. • 30 s might have less room to pay for necessities. ☞ The government should provide greater subsidies that take customer’s financial capacity to buy EVs into account.
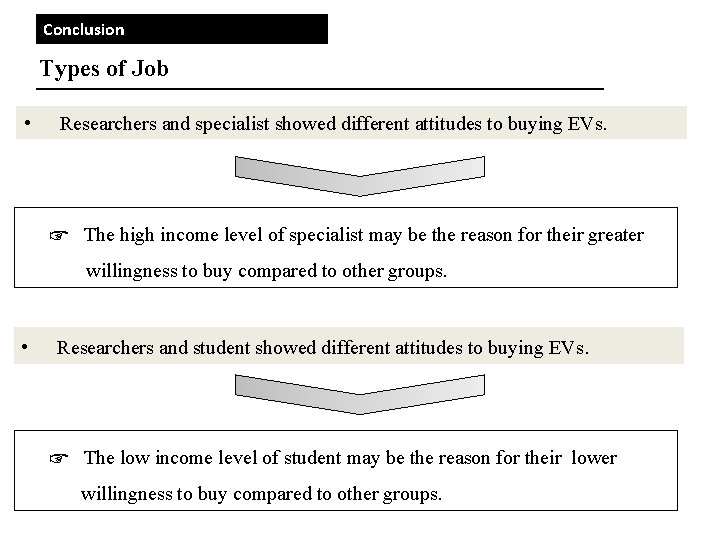
Conclusion Types of Job • Researchers and specialist showed different attitudes to buying EVs. ☞ The high income level of specialist may be the reason for their greater willingness to buy compared to other groups. • Researchers and student showed different attitudes to buying EVs. ☞ The low income level of student may be the reason for their lower willingness to buy compared to other groups.
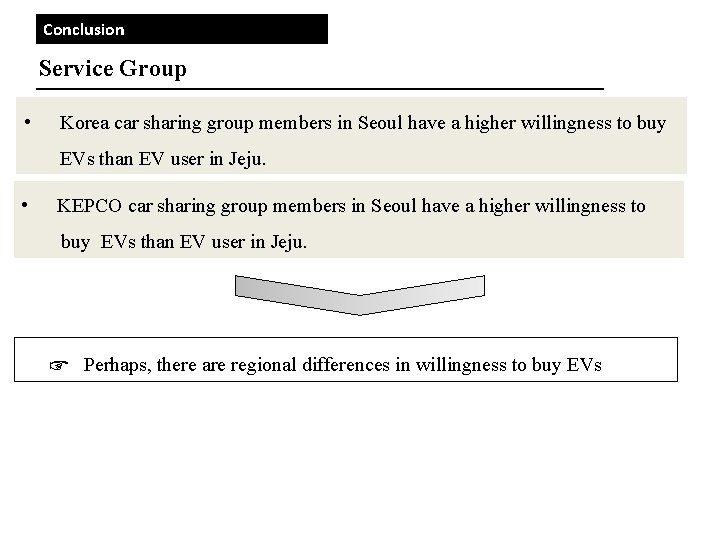
Conclusion Service Group • Korea car sharing group members in Seoul have a higher willingness to buy EVs than EV user in Jeju. • KEPCO car sharing group members in Seoul have a higher willingness to buy EVs than EV user in Jeju. ☞ Perhaps, there are regional differences in willingness to buy EVs
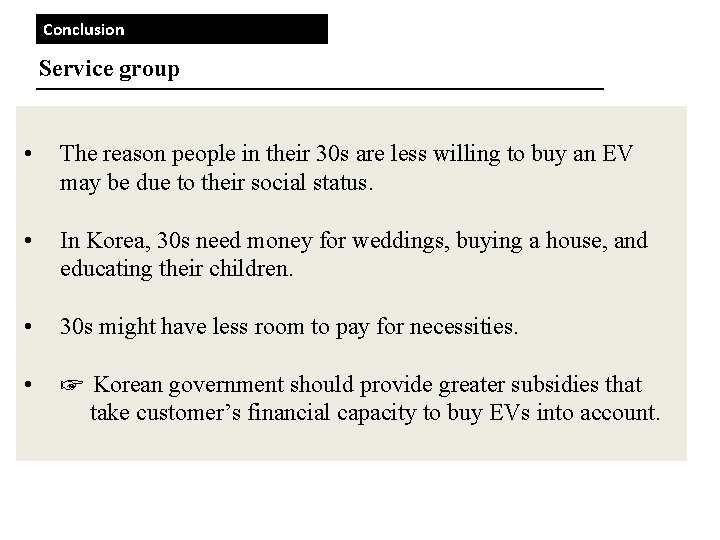
Conclusion Service group • The reason people in their 30 s are less willing to buy an EV may be due to their social status. • In Korea, 30 s need money for weddings, buying a house, and educating their children. • 30 s might have less room to pay for necessities. • ☞ Korean government should provide greater subsidies that take customer’s financial capacity to buy EVs into account.
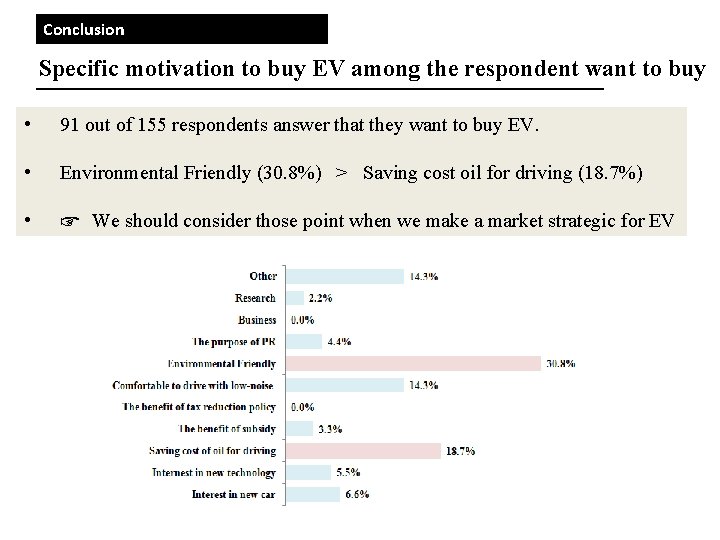
Conclusion Specific motivation to buy EV among the respondent want to buy • 91 out of 155 respondents answer that they want to buy EV. • Environmental Friendly (30. 8%) > Saving cost oil for driving (18. 7%) • ☞ We should consider those point when we make a market strategic for EV
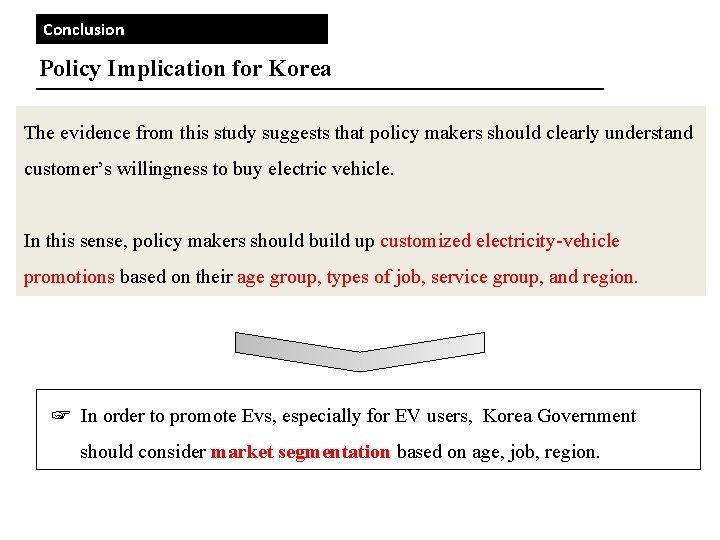
Conclusion Policy Implication for Korea The evidence from this study suggests that policy makers should clearly understand customer’s willingness to buy electric vehicle. In this sense, policy makers should build up customized electricity-vehicle promotions based on their age group, types of job, service group, and region. ☞ In order to promote Evs, especially for EV users, Korea Government should consider market segmentation based on age, job, region.
Key Reference • Ona Egbue, Suzanna Long, Barriers to widespread adoption of electric vehicles: An analysis of customer attitude and perceptions, Energy Policy, Volume 48, 2012, Pages 717– 729 • Alexander Kihm, Stefan Trommer, The new car market for electric vehicles and the potential for fuel substitution, Energy Policy, Volume 73, 2014, 147– 157 • Korea Energy Management Corporation (KEMCO), EV demonstration project data analysis and EV distribution, internal paper by KEMCO, October • 2013 Electric Vehicle News, Electric car sales set to take off in South Korea, April 18, 2014
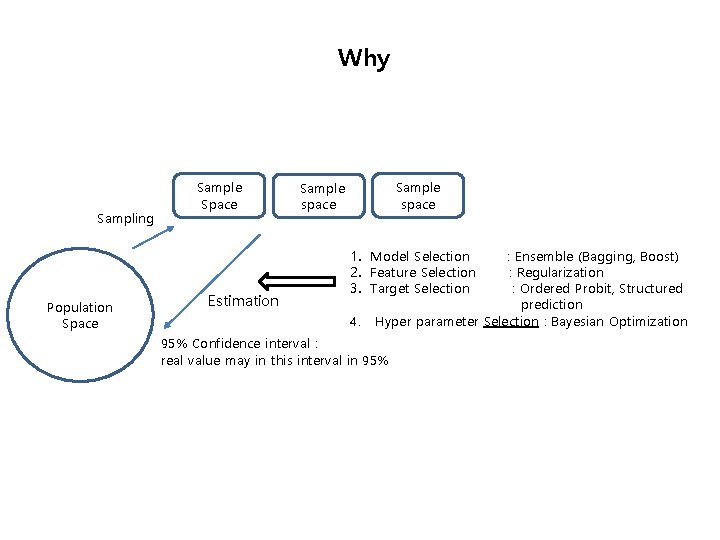
Why Sampling Population Space Sample Space Estimation Sample space SSample space 1. Model Selection 2. Feature Selection 3. Target Selection 4. : Ensemble (Bagging, Boost) : Regularization : Ordered Probit, Structured prediction Hyper parameter Selection : Bayesian Optimization 95% Confidence interval : real value may in this interval in 95%
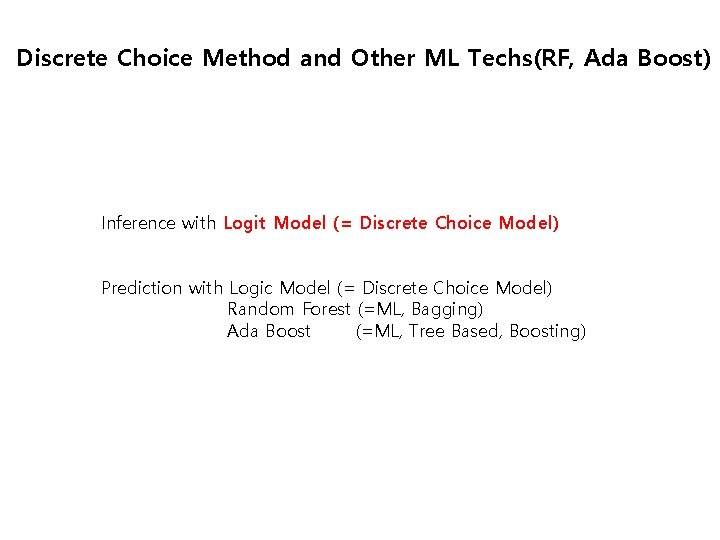
Discrete Choice Method and Other ML Techs(RF, Ada Boost) Inference with Logit Model (= Discrete Choice Model) Prediction with Logic Model (= Discrete Choice Model) Random Forest (=ML, Bagging) Ada Boost (=ML, Tree Based, Boosting)
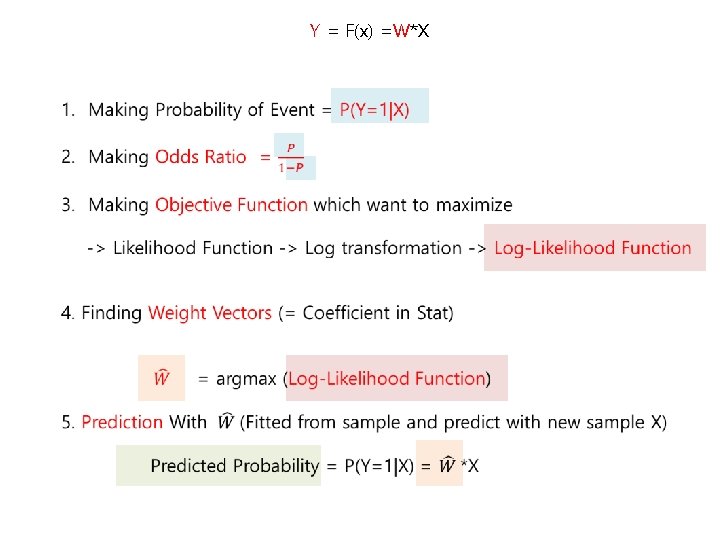
Y = F(x) =W*X
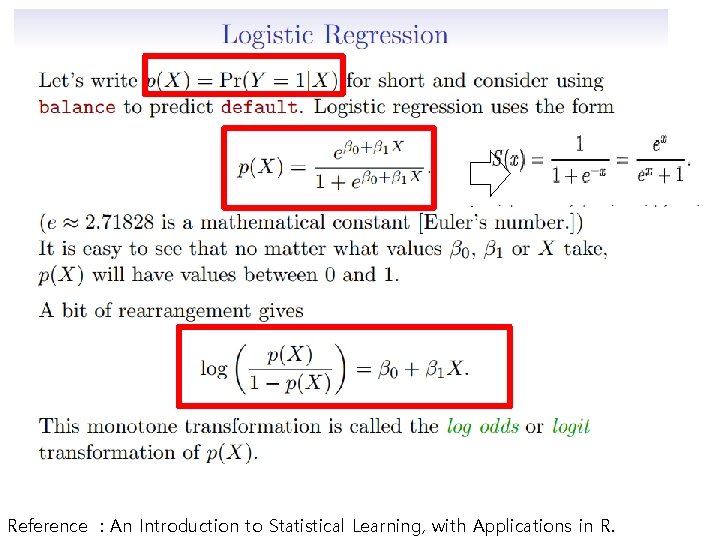
Reference : An Introduction to Statistical Learning, with Applications in R.
From : An Introduction to Statistical Learning, with Applications in R. Monotonic Transformation : Loglikelihood
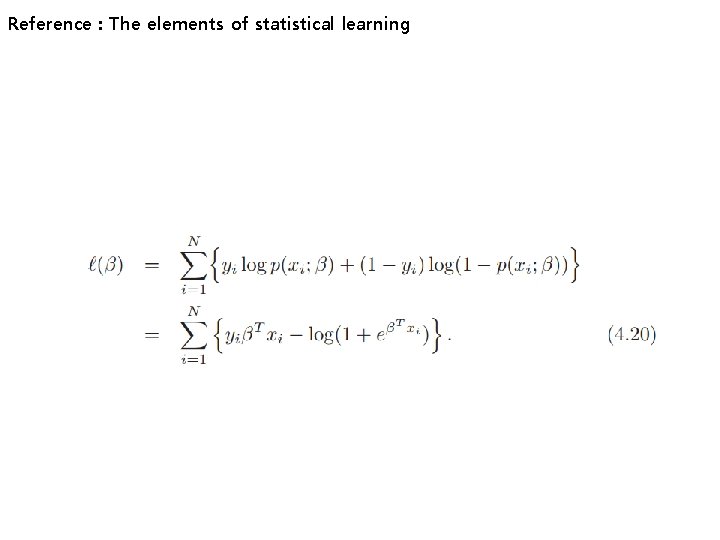
Reference : The elements of statistical learning
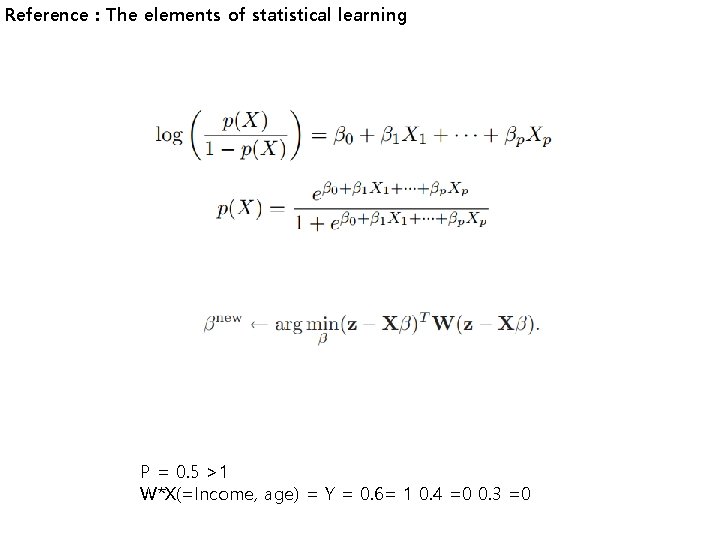
Reference : The elements of statistical learning P = 0. 5 >1 W*X(=Income, age) = Y = 0. 6= 1 0. 4 =0 0. 3 =0
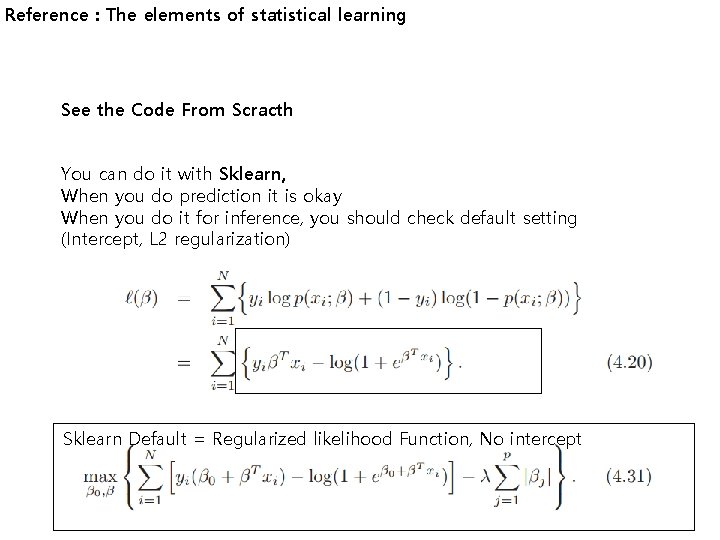
Reference : The elements of statistical learning See the Code From Scracth You can do it with Sklearn, When you do prediction it is okay When you do it for inference, you should check default setting (Intercept, L 2 regularization) Sklearn Default = Regularized likelihood Function, No intercept
Coding from scratch and compare the results with Sklearn https: //scikit-learn. org/stable/modules/generated/sklearn. linear_model. Logistic. Regression. html
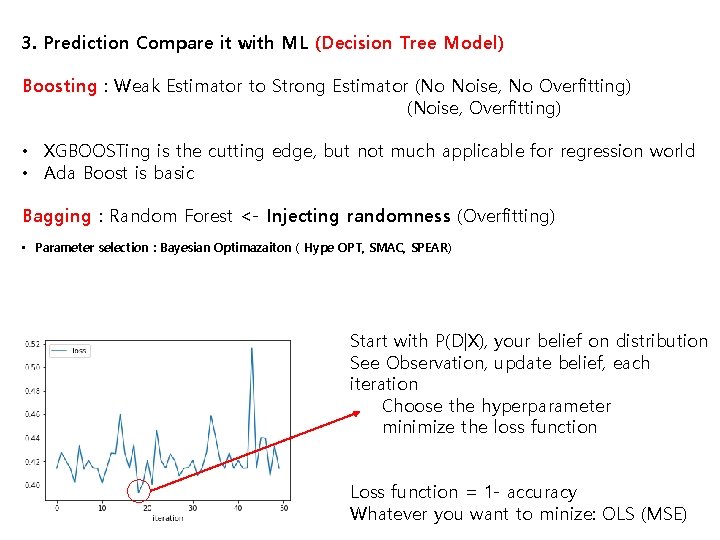
3. Prediction Compare it with ML (Decision Tree Model) Boosting : Weak Estimator to Strong Estimator (No Noise, No Overfitting) (Noise, Overfitting) • XGBOOSTing is the cutting edge, but not much applicable for regression world • Ada Boost is basic Bagging : Random Forest <- Injecting randomness (Overfitting) • Parameter selection : Bayesian Optimazaiton ( Hype OPT, SMAC, SPEAR) Start with P(D|X), your belief on distribution See Observation, update belief, each iteration Choose the hyperparameter minimize the loss function Loss function = 1 - accuracy Whatever you want to minize: OLS (MSE)
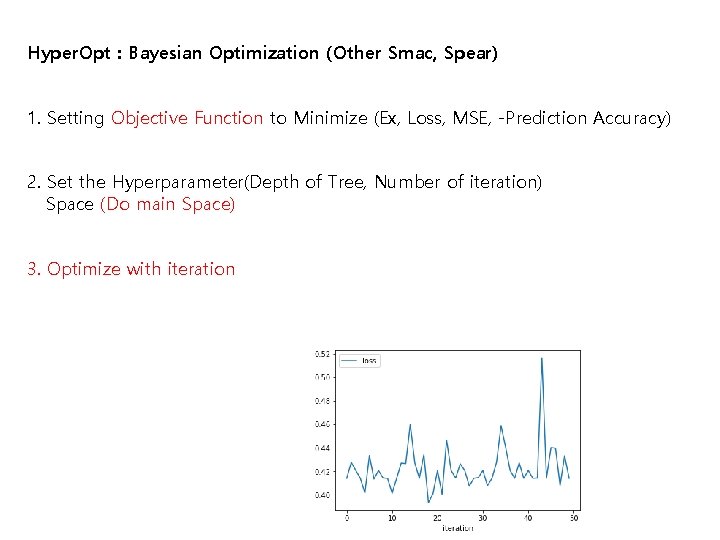
Hyper. Opt : Bayesian Optimization (Other Smac, Spear) 1. Setting Objective Function to Minimize (Ex, Loss, MSE, -Prediction Accuracy) 2. Set the Hyperparameter(Depth of Tree, Number of iteration) Space (Do main Space) 3. Optimize with iteration
Bayesian Optimization (Other Smac, Spear) 1. With Prior Belif P(D|X), Logic P= P(Y=1|X) 2. See the actual observation 3. Update P(D’|X) 4. Repeat until converge -> Decrease the number of parameter to estimate Python Bayesian Optimization Modul : https: //conference. scipy. org/proceedings/scipy 2013/pdfs/bergstra_hyperopt. pdf
2 PREDICTION 46
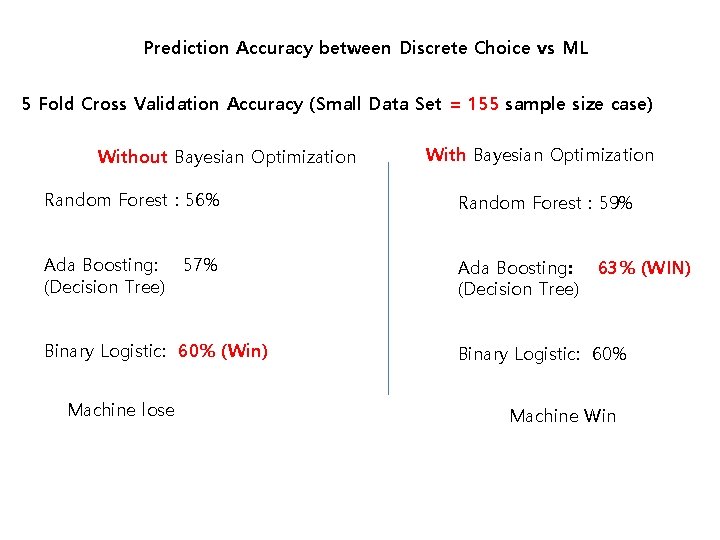
Prediction Accuracy between Discrete Choice vs ML 5 Fold Cross Validation Accuracy (Small Data Set = 155 sample size case) Without Bayesian Optimization With Bayesian Optimization Random Forest : 56% Random Forest : 59% Ada Boosting: 57% (Decision Tree) Ada Boosting: (Decision Tree) Binary Logistic: 60% (Win) Binary Logistic: 60% Machine lose 63% (WIN) Machine Win