Diffraction Literature V Valvoda M Polcarov P Luk


- Slides: 61

Diffraction Literature: V. Valvoda, M. Polcarová, P. Lukáč: Základy strukturní analýzy, Karolinum, Praha 1992 M. Birkholz: Thin Film Analysis by X-Ray Scattering, Wiley-WCH, Weinheim 2006 • properties of X-rays, high-energy electrons and neutrons used in diffraction analysis • geometrical principles of diffraction • Diffracted intensity – kinematical & dynamical theory • Basic experimental techniques • X-ray diffractometry • Bragg-Brentano geometry • Grazing incidence diffraction • Crystallite size • High resolution set-up • X-ray topography

Grazing incidence set-up – GIXRD Parallel plate collimator moving detector Göbel mirror X-ray tube sample Fixed angle of incidence

Göbel parabolic mirror laterally graded multilayer divergent beam parallel beam Focus of X-ray tube Conversion of divergent beam to parallel one. Decrease of divengence to ~ 0. 03°. Elimination of β line.

Parallel plate collimator detector wide diffracted beam incident parallel beam sample 0. 3 ~ 2°

Limits of GIXRD measurements thickness 6. 6 nm thickness 14 nm 111 200 220 Layer of Pr 6 O 11 deposited on Si substrate. Annealed at 600° C 311

Attenuation of intensity - absorption symmetric diffraction Lambert-Beer law various beam paths θ θ finite thickness (thin films) z l t infinite thickness (bulk samples) advantage of Bragg-Brentano geometry

Attenuation of intensity - absorption GI diffraction 2θ – α finite thickness (thin films) α infinite thickness (bulk samples) t configuration factor

Absorption factor and penetration depth absorption factor symmetric diffraction penetration depth GI diffraction limitation for α ?

Total external reflection smooth sample surface – RMS ≈ nm refractive index for X-rays for critical angle for Zn. O δ = 1. 7 x 10 -5 β = 3. 3 x 10 -7 αc = 0. 334° or

Reflectivity curves Al 2 O 3 /Si – 21 nm, roughness 0. 5 nm La. Sr. Mn. O 3/YSZ/Si – roughness? ? ? Mo. S 2/Si – rough surface

Penetration depth for polycrystalline Zn. O thin film measuring at angles close to αc enables to determine the depth variation of structural parameters on the scale of nm!

Example – oxidation of thin Ir layer 15 nm thick Ir layer on Al. Ga. N – RT annealing

GI diffraction analysis of Ni. W/Fe Fe 110 α = 2° α = 4° α = 6° α = 12° α = 24°

GI diffraction analysis of Ni. W/Fe detected intensity of Fe 110 absorption in layer absorption in substrate ln( ) – linear function of kα μNi. W = 1060 cm-1 t = 0. 41 μm

Crystallite size – Scherrer equation Bertaut’s column theorem Ghkl D no effect

Crystallite size? D <D> Ghkl averaged column height <D> evaluation (TOPAS): volume weighted mean column height Lvol crystallite shape – cube, sphere, etc… K crystallite size distribution – monodisperse/polydisperse distribution function?

Determination of the size distribution function Warren-Averbach Stokes-Wilson (TOPAS)

Magnetite powder – fitted by TOPAS 6. 5 nm 53 nm

Au nanoparticles – fitted by TOPAS 1. 4 nm 25 nm

High resolution diffraction – epitaxial layers completely relaxed layer Strained layer perfectly matched to the substrate partially relaxed layer with misfit dislocations

Diffraction from the substrate with epi-layer Intensity substrate peak layer peak θlayer θsubstrate θ Different interplanar spacing dhkl of planes parallel to the sample surface causes that the diffraction from the substrate and the layer occurs at different Bragg angles. For high quality epitaxial layers this difference can be as small as 0. 01°. Further improvements of the quality of the primary beam are necessary.

Description of the epitaxial layer in RS perfectly matched strained layer substrate reciprocal lattice

Description of the epitaxial layer in RS completely relaxed layer substrate reciprocal lattice

Description of the epitaxial layer in RS partially relaxed layer reciprocal lattice substrate determination of the composition and the degree of relaxation requires to measure at least one symmetric and one asymmetric diffraction

Why do we need high resolution diffraction? epitaxial layers – similar lattice parameters of the substrate and the layer(s) the difference may be spectral width of the radiation the precision of the measurement is given by beam divergence parameters of standard diffractometry Cu Kα 1 – Kα 2 separation slit collimator Goebel mirror elimination of Kα 2 and decreasing of the angular divergence is necessary

Limitation of standard diffractometry h s intensity profile d divergence s = 0. 1 mm h = 0. 1 mm d ~ 100 m d = 200 mm monochromators

Monochromator – principle focus of X-ray tube λ<λ

Non-dispersive arrangement focus of X-ray tube λ<λ all wavelengths are diffracted at the same orientation

Dispersive arrangement λ<λ focus of X-ray tube each wavelength is diffracted at different orientation

Monochromatization of the primary beam Bartels monochromator two Ge channel cut crystals with 220 symmetrical diffraction incoming beam outgoing beam

Analyzer crystal - Pathfinder Bartels monochromator detector sample Pathfinder – Focus of X-ray tube slit collimator or triple bounce Ge channel cut crystal Monochromator in the diffracted beam – analyzer • excellent angular resolution of the diffracted beam • misorientation of mosaic blocks and strain can be separated

Epitaxial layer Ga. As/Ga 1 -x. Inx. P – diffraction 004 standard diffraction Bartels monochromator Bartels + Pathfinder

Si/Al. N/3 x Al. Ga. N/Ga. N – diffraction 0002

Accessible region of the reciprocal space (RS) Ewald construction sample origin of RS

Scans in RS symmetric θ-2θ scan 2θ θ

Scans in RS asymmetric – offset ω-2θ scan 2θ ω

Scans in RS ω scan 2θ ω

Scans in RS detector scan 2θ ω

Scans in RS accessible lattice points in coplanar geometry “forbidden“ area symmetric ω/2θ or 2θ/ω scan “forbidden“ area

Scans in RS RS mapping transformation into the rectangular coordinates by an appropriate software is necessary

Reciprocal space – angular vs. linear scans curved streets – advisable for poetic walking but complicated orientation straight streets – monotonous walking but easy orientation

Scans in RS linear scans PC controll of up-to-date diffractometers h l

Scans in RS direct mapping of rectangular area additional numerical processing of the data is not necessary

Cross section of RS for Ga. N lattice symmetric and asymmetric angular scans 5% 22% 3% 11 -24 - 0004 11 -22 - 0002 11 -24+ 45%

Failure of asymmetric angular scan of Si/Al. N/3 x Al. Ga. N/Ga. N maxima of Al. N and Al. Ga. N layers are not detected

Solution – use of linear scans 0004 11 -24

Reconstruction of RS 11 -24– path of 2θ/ω scan h scans 0004 Stacking in real space Al. N Ga. N Al. Ga. N-80 Al. Ga. N-20 Al. Ga. N-50 Al. Ga. N-20 Al. Ga. N-80 Al. N silicon (111) Reciprocal coordinates of the layer points can be determined and the composition and the lateral strain can be calculated l scan Ga. N

RS map – confirmation of the results Advantage – complete information on the epitaxial system Disadvantage – measuring of RS map requires ~102 times more time than the linear scans

Resolution in the reciprocal space divergence of the monochromator acceptance of the analyzer spectral width of Kα 1 2θ Resolution power θ

Double axis vs. Triple axis diffractometry TAXRD DAXRD acceptance of the analyzer angular acceptance of the detector - entrance slit divergence of the monochromator

Lattice tilt or lattice strain? θ DAXRD – angular resolution of the diffracted beam is not sufficient! θ

DAXRD – /2θ scan strain tilt θ θ

TAXRD – /2θ scan strain tilt off-set /2θ scan symmetric /2θ scan θ θ

X-ray topography arrangement of diffraction experiments on single crystalline samples large number of diffractions one particular diffraction structure, symmetry many beams around the central one – HRTEM intensity distribution in the diffracted beam e- – transmission electron microscopy TEM imaging techniques – analysis of lattice defects n 0, X-rays – topography measured parameters • directions • intensities central (forward scattered) beam – only for TEM (bright field)

Lang topography r to c e t de slits diffracted beam forward scattered beam tube focus synchronized translation goniometer axis

Lang topography top view recording medium slits source sample synchronized translation of sample and recording medium

Contrast of defects Dislocations are invisible or exhibit only weak contrast if triangular stacking faults in Ga. As circular stacking faults in Ga. As

Contrast of defects dislocations in Si Lang topograph contrast width ~ extinction length TEM

Double crystal topography detection of fine variations of lattice parameter ~ 10 -5 steepest part of the rocking curve

Double crystal topography Si wafer – double crystal topograph comparison of Lang and double crystal topography

Thank you for your attention!
 Epp zavarivanje
 Wayne luk
 Luk samfundet op
 Luk jenž od západu napíná se
 łuk braterstwa co zawiera
 Nerko delovi
 Ju mul luk
 Omotac kupe
 Romanika umetnost
 Luk samfundet op
 Luk samfundet op
 A nazváno buď
 Lukas 15:11-32
 Luk samfundet op
 Mitsubishi electric zubadan
 živočíchy spoločenstva lúk
 Lukas 5 17-26 auslegung
 Luk samfundet op
 Luk katalog
 Spolocenstvo luk
 Luk samfundet op
 Den generaliserede anden
 100-lük kvadrat cədvəli
 Luk vanhauwaert
 Mikroprocesorski sistemi u medicini
 Slit diffraction
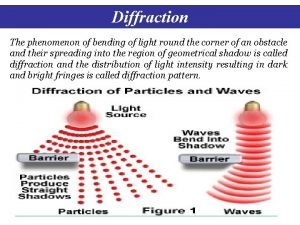
 Diffraction
 Diffraction is the tendency of light to:
 For viewing tiny objects in a microscope diffraction is
 When a wave strikes an object and bounces off
 Diffraction
 Dispersive power of grating
 Coherent and incoherent sources of light
 Electron diffraction experiment results
 Huygens principle
 Diffraction in a sentence
 Electron diffraction
 Magnets for neutron diffraction
 Principal maxima and secondary maxima
 Slit diffraction
 How to find the critical angle
 Reciprocal lattice vector
 Powder diffraction database
 Fresnel and fraunhofer difference
 Diffraction plate
 Reflection refraction diffraction interference
 Diffraction and scattering
 Kevin cowtan
 Diffraction of light
 Laue diffraction
 Transmission grating
 Sound diffraction
 Slit diffraction
 Fraunhofer diffraction circular aperture
 Diffraction examples
 Fresnel and fraunhofer diffraction difference
 Missing order in diffraction
 Reflection refraction diffraction
 Fraunhoffer diffraction
 Diffraction
 Double slit diffraction
 Tamar mentzel


