Demography Ashry Gad Mohamed Prof of Epidemiology Science


 added")


/female • under 15 years: 1. 04")


- Slides: 18
Demography Ashry Gad Mohamed Prof. of Epidemiology
• Science studies population from various aspects: • Size • Composition • Distribution
Population size • Number of all persons in the community. • Census • Estimated population
Census • A process of enumeration of all persons in the community. • Time: 10 Years • Procedures: Enumeration Demographic Socioeconomic
Methods 1 - De Jure Counting individuals at their legal residence regardless of their physical presence. Factual Expensive
2 -De Facto Counting individuals wherever they actually are on day of census. Easier Economic
Estimation Methods 1 -Natural increase (Number of live births – Number of deaths) added to last census population. No migration in or out.
2 -Arthmatic mean Two consecutive censuses Mean annual increase Population = last census +(Mean annual increase X number of years). Example: 1410 30000 1420 40000 Annual increase = 10000/10 =1000 1429 40000 + (9 X 1000) = 49000
3 - Geometric method Most accurate Special equation
• Graphical method
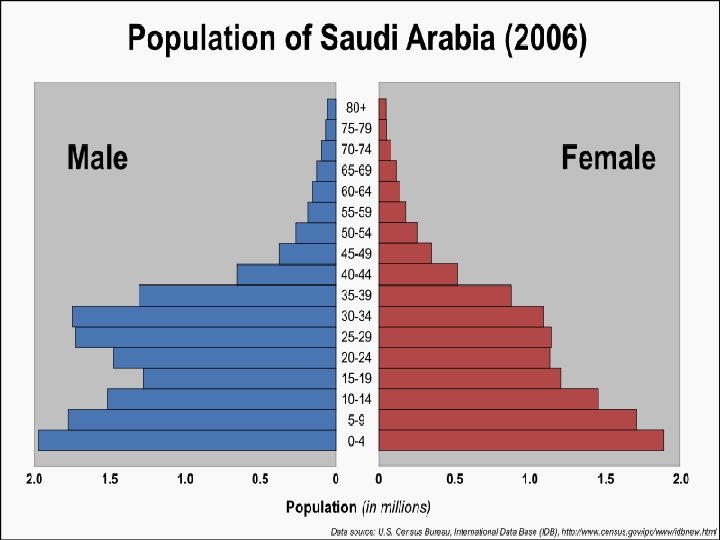
Saudi population
Population • 28, 161, 417 note: includes 5, 576, 076 nonnationals (July 2008 est. )
Age structure • 0 -14 years: 38. 1% (male 5, 469, 641/female 5, 258, 508) • 15 -64 years: 59. 5% (male 9, 467, 325/female 7, 284, 077) • 65 years and over: 2. 4% (male 355, 173/female 326, 693) (2008 est. )
Median age • total: 21. 5 years • male: 22. 9 years • female: 19. 7 years (2008 est. )
Sex ratio • at birth: 1. 05 male(s)/female • under 15 years: 1. 04 male(s)/female • 15 -64 years: 1. 3 male(s)/female • 65 years and over: 1. 09 male(s)/female • total population: 1. 19 male(s)/female (2008 est. )
Life expectancy at birth • total population: 76. 09 years • male: 74. 04 years • female: 78. 25 years (2008 est. )
• Dependency Ratio Total Dependency Ratio= <15 + >60 years / 15 -60 years Young Dependency Ratio = <15 / 15 -60 years. Elderly Dependency Ratio= >60 years / 15 -60 years