Epidemiology of Obesity Ashry Gad Mohamed Prof of

Epidemiology of Obesity Ashry Gad Mohamed Prof. of Epidemiology College of Medicine & KKUH

OBJECTIVES OF THE LECTURE At the end of the session you should be able to: • 1 -describe the magnitude of the problem of obesity. • 2 - Recognize the sequences of obesity. • 3 -know risk factors of obesity. • 4 - understand the prevention of obesity

No body is exempted from obesity. It can be you.


From Ancient to Modern. . … Work

Obesity classification. • CDC, Obesity is divided into three separate classes, with Class III obesity being the most extreme of the three. With a BMI of: You are considered: Below 18. 5 Underweight 18. 5 - 24. 9 Healthy Weight 25. 0 - 29. 9 Overweight 30 or higher Obese Obesity class BMI (kg/m 2) Class I 30. 0 - 34. 9 Class II 35. 0 -39. 9 Class III ≥ 40. 0 (Extreme Obesity)

A Global Epidemic Why is obesity accelerating in developing countries? • Increased consumption of energy dense, nutrient poor foods. • Reduced physical activity.
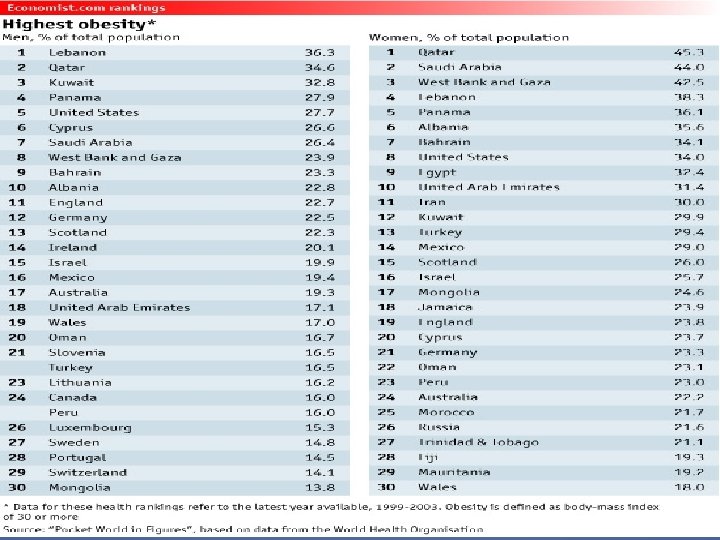

Global Prevalence of Obesity in Adult Males With examples of the top 5 Countries in each Region North America USA 31% Mexico 19% Canada (self report) 17% Guyana 14% Bahamas 14% % Obese 0 -9. 9% 10 -14. 9% 15 -19. 9% 20 -24. 9% 25 -29. 9% ≥ 30% Self Reported data European Region Croatia 31% Cyprus 27% Czech Republic 25% Albania (urban) 23% England 23% Eastern Mediterranean Lebanon 36% Qatar 35% Jordan 33% Kuwait 28% Saudi Arabia 26% Africa South Africa 10% South Central America Seychelles 9% Panama 28% Cameroon (urban) 5% South East Asia & Paraguay 23% Pacific Region Ghana 5% Argentina (urban) 20% Tanzania (urban) 5% Nauru 80% Uruguay (self report) 17% Tonga 47% Dominican Republic 16% Cook Island 41% French Polynesia With the limited data available, prevalence's are not age standardised. Self reported surveys may 36% underestimate true prevalence. Sources and references are available from the IOTF. © Samoa 33% International Obesity Task. Force, London –January 2007

Global Prevalence of Obesity in Adult Females With examples of the top 5 Countries in each Region North America USA 33% Barbados 31% Mexico 29% St Lucia 28% Bahamas 28% % Obese 0 -9. 9% 10 -14. 9% 15 -19. 9% 20 -24. 9% 25 -29. 9% ≥ 30% Self Reported data European Region Albania 36% Malta 35% Turkey 29% Slovakia 28% Czech Republic 26% Eastern Mediterranean Jordan 60% Qatar 45% Saudi Arabia 44% Palestine 43% Lebanon 38% South Central America Panama 36% Paraguay 36% Peru (urban) 23% Chile (urban) 23% Dominican Republic 18% Africa Seychelles 28% South Africa 28% Ghana 20% Mauritania 19% Cameroon (urban) 14% With the limited data available, prevalence's are not age standardised. Self reported surveys may underestimate true prevalence. Sources and references are available from the IOTF. International Obesity Task. Force, London –January 2007 South East Asia & Pacific Region Nauru 78% Tonga 70% Samoa 63% Niue 46% ©French Polynesia
 studies showing the prevlanece of obesity and overweight Author , and place")
Regional (local) studies showing the prevlanece of obesity and overweight Author , and place of study Age group Khashoggi et al (1994)Attendees at PHC jedahh 11 -70 years Mean age 32. 2 No of subjects Criteria used Prevalence among male % Prevalence among Female% Obese BMI >30 ---- 64. 3 Overweight BMI 25 -29. 9 ---- 26. 8 852 female Obese BMI >30 AL- Shammati et al (1994 b) Attendees at PHC, Riyadh AL- Jassir et al (1998) Emploees of M. O. H Riyadh Mean male = 34 Female 32 20 and above 47. 0 733 With back pain Obese BMI >30 51. 6 Overweight BMI 25 -29. 9 40. 3 ---- Obese BMI >30 18. 4 . . … 1238 males

Causes of Obesity

Causes of Obesity • Not necessarily overeating. • Factors that predispose a person to gain excessive weight gain. – Eating patterns Eating environment – Food packaging Food availability – Body image Physical inactivity – Basal body temp Dietary thermogenesis – Fidgeting Biochemical differences – Quantity & sensitivity to satiety hormones

Causes of Obesity • Characteristics of fast food linked to increased adiposity: – Higher energy density – Greater saturated fat – Reduced complex carbohydrates & fiber – Reduced fruits and vegetables.

Causes of Obesity • Genetics plays a role. – How much variation in weight gain among individuals can be accounted for by genetic factors? – Largest transmissible variation is cultural.

Causes of Obesity – A satiety hormone that influences the appetite control in the hypothalamus. – There is a role of a mutant “obese” gene in obesity development.

Causes of Obesity

Causes of Obesity A defective ob gene In addition to deficient causes inadequate leptin production, leptin production. Thus, scientists also propose the brain receives an the possibility of under assessment of defective receptor body’s adipose stores action (via a leptin and urge to eat. receptor molecule on brain cells), which increases a person’s resistance to satiety.

Causes of Obesity • Physical Activity: an important component • For young & middle aged men, physical activity relates inversely to body fat levels. • No relationship between caloric intake and body fat levels.

Complications of obesity

Children & adults • Obesity is a long term process. • Obesity frequently begins in childhood. • Obese parents likely have overweight children. • Regardless of final body weight as adults, overweight children exhibit more illnesses as adults than normal kids.
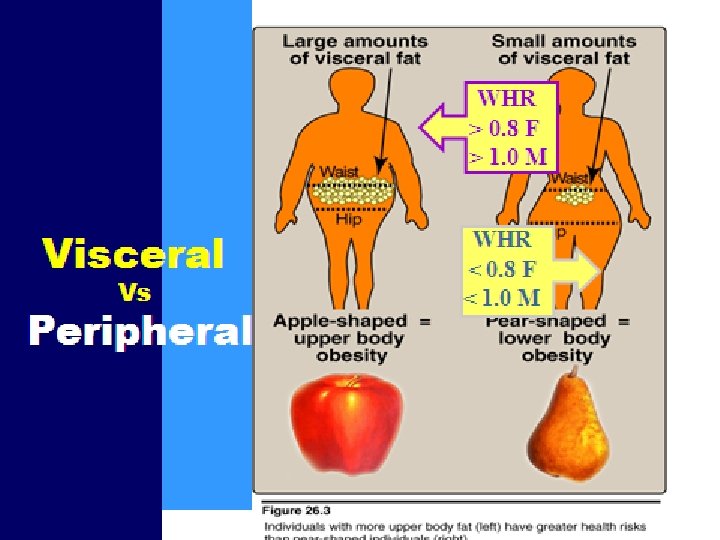

Abdominal body fat increases health risks Degree of abdominal fat accumulation is correlated with increased risk of: u Cardiovascular disease 1 u Type 2 diabetes 2, 3 u Premature death 4 u Some types of malignancies 5 1 Hubert HB et al. Circulation 1996; 93: 1372– 9 GA et al. Am J Epidemiol 1990; 132: 501– 13 3 Chan JM et al. Diabetes Care 1994; 17: 961– 9 4 Soloman CG, Manson JE. Am J Clin Nutr 1997; 66 (Suppl. 4): 1055 S– 50 S 5 Schapira DV et al. Cancer 1994; 74: 632– 9 2 Colditz


Obese Syndrome Components Glucose intolerance Insulin resistance Dyslipidemia Type 2 diabetes Hypertenision Elevated plasma leptin concentration • Increased visceral adipose tissue • Increased risk of CHD & some cancers • • •

10 kg Weight Loss in 100 kg Patient With Obesity Related Co-morbidities u Mortality 20 -25% fall in total mortality 30 -40% fall in diabetes related deaths 40 -50% fall in obesity related cancer deaths u Blood pressure fall of approximately 10 mm/Hg in both systolic and diastolic values u Reduces the risk of developing diabetes by >50% Fall of 30 -50% F. glucose Fall of 15% Hb. AIC u Lipids: Fall of 10% in total cholesterol Fall of 15% LDL Fall of 30% triglycerides Increase of 8% in HDL

Thank You
- Slides: 28