Demographic Structural Changes in Japan Fertility Decline and


 • • Meaning of a “Sho-shi-ka”")
; total of the agespecific")


 5. The influence of the fertility change appears as")

- Slides: 24
Demographic Structural Changes in Japan Fertility Decline and Population Trends KOHEI WADA Faculty of Economics, Chuo University, Japan the Australian Demographic and Social Research Institute, the Australian National University
Objective Understanding of 1. The current and future fertility and population trends in Japan. 2. The difference between the cohort and period, and the policy timing for getting into the replacement level. 3. The impact of the demographic changes on the consumption patterns in Japan.
Outline 1. 2. 3. 4. 5. 6. 7. Trend of fertility Period TFR and Cohort TFR Fertility projected by the cohort Decrease of total population Fertility target for the replacement level Ageing The impact to the consumption market
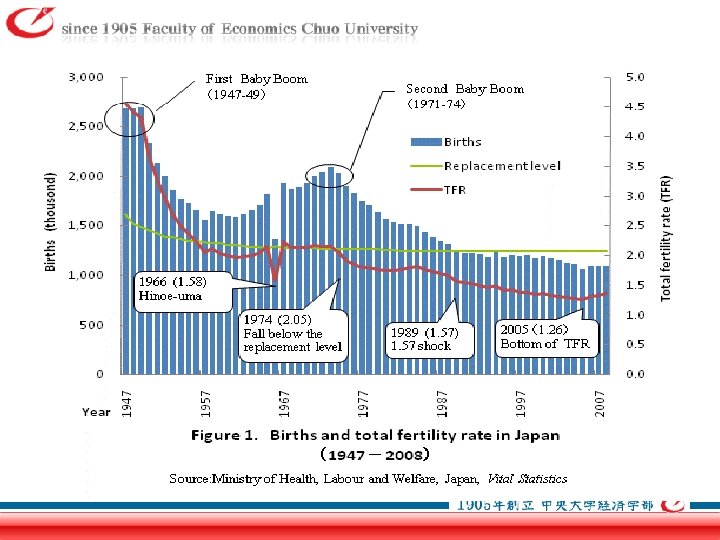
1. Trend of fertility - Period TFR (PTFR) • • Meaning of a “Sho-shi-ka” 「少子化」 PTFR fell below the population replacement level in mid- 1970’s. PTFR continued to decline by 2005 PTFR has risen slightly in recent years.
2. Period TFR and Cohort TFR • Period TFR (PTFR); total of the agespecific fertility rate at the same period. • Cohort TFR (CTFR) ; total of the agespecific fertility rate with the same cohort. • PTFR has been commonly used as an indicator of fertility. • CTFR should be focused for projection with the cohort effect like “catch-up effect”.
• The value of the integral of the age-specific fertility rates has been falling. • The variance of age is increasing, especially with the distribution moving towards older ages.
Figure 3. The interacting structure between period TFR and cohort TFR Source: Wada, Kohei (2007 b) "Declining Fertility Rate: Demographic Factors" JAPAN SPOTLIGHT Bimonthly, 2007 Nov/Dec.
3. Fertility projected by cohort • Age-specific fertility rate for the female cohort born between 1935 -1975. • The cumulative fertility rates for comparing the CTFR. • There should be the critical divide between the 1955 cohort and the 1960 cohort. • the PTFR is rising slightly by “catch-up effect”, but will be around 1. 2 during this century without any population policy.
To compare the CTFR clearly, transform this into the cumulative fertility rates for the cohort ….
• CTFRs of cohorts born before 1955 were recorded at around 2. • The cohort born after 1960 started to shift downward, with the TFR of the cohort born in 1965 falling to 1. 6 and finally the cohort born in 1975 is expected to dip to 1. 44.
• The TFR in the medium-variant of IPSS will gradually decline to 1. 21 in 2013. It is then expected to turn upward to 1. 24 in 2030, and eventually level off at 1. 26. • I projected PTFR would continue to decline until 2015, and will slightly “catch up” from 2015 to 2035, leveling off around 1. 17.
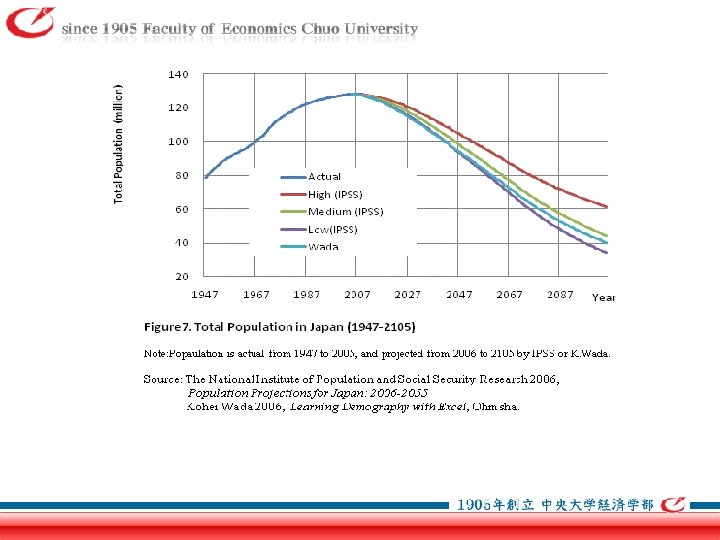
4. Decrease of total population • Projection by the cohort component method. • The peak of total population was 127, 768 at the 2004 Census. • Total population is projected to decrease by 2/3 during this century.
5. Fertility target for the replacement level Relationship • the recovery time towards the replacement level • the reaching time to the stationary state • the size of stationary population It is possible to calculate approximately by when the TFR should reach the replacement level in order to ensure the target population size satisfies policy.
• The influence of the fertility change appears as the change of the total population after the time lag of about 65 or 70 years. • the TFR needs to recover towards the replacement level by 2024 to keep the total population at 1, 000.
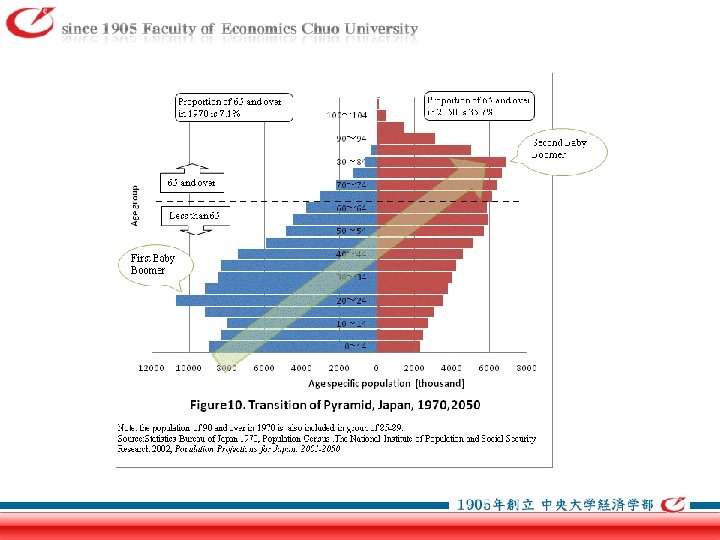
6. Ageing • The fertility rate declines accelerate the ageing of the population. • Presently, the proportion of the 65 and over population is 19. 75% and it will remain ranked first at least by the mid-this century. • The old-age dependency ratio is currently 31%. It will continue to rise, and finally reach 76% by 2050, indicating a potential support ratio equal to 1. 3.
7. The impact to consumption market C: consumption, P: total population, α(= C /P ): per-capita consumption (consumption level) In decomposing the consumption change, C = (C /P )×P =αP ⊿C ≒P⊿α+α⊿P 1≒(P⊿α /⊿ C )+(α⊿P/⊿C). (P⊿α /⊿ C ) ; consumption level effect. (α⊿P/⊿C) ; total population effect.
• Consuming population market size will expand dramatically with higher consumption needs of the elderly people, even though the others of younger or working-age population are decreasing. • The total population effect has declined. By contrast, the consumption level effect was projected to increase uniformly due to the population decline and ageing.
Key findings to remember 1. Birthrate continues to decline since the late 1970 s. 2. Period fertility rate has a possibility of backward rising by “catch-up effect” for the delay in giving birth. 3. There should be the line of population reproduction, which divides between the 1955 cohort and the 1960 cohort. 4. Total population is projected to decrease by 2/3 during this century.
Key findings to remember (cont’d) 5. The influence of the fertility change appears as the change of the total population after the time lag of about 65 or 70 years. 6. About 40% of population will be the elderly in the mid-this century. Just 1. 3 workers have to support one senior resident by 2050. 7. Consumption market is not shrinking thanks to the positive purchasing behavior by the elderly people.
Thank you. Any comments or questions. But please speak slowly and in easy-to-understand English… Following the criteria “a population size reduction of 50% and over projected or suspected to be met within the next 10 years or three generations, whichever is the longer” of the famous Red Data List of Life Threatened Species by IUCN , the population in Japan would be categorized as Endangered (EN), like Australian Sea Lion or Tasmanian Devil.