Danielle Sanderson School of Real Estate and Planning





- Slides: 28
Danielle Sanderson: School of Real Estate and Planning The Tenant as Customer: can good service improve real estate performance? http: //www. henley. ac. uk/school/page/rep-working-papers-2014/
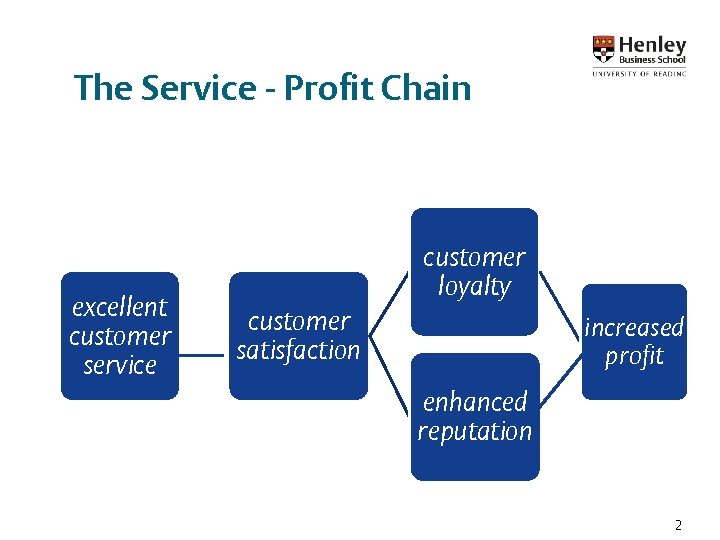
The Service - Profit Chain excellent customer service customer loyalty customer satisfaction increased profit enhanced reputation 2
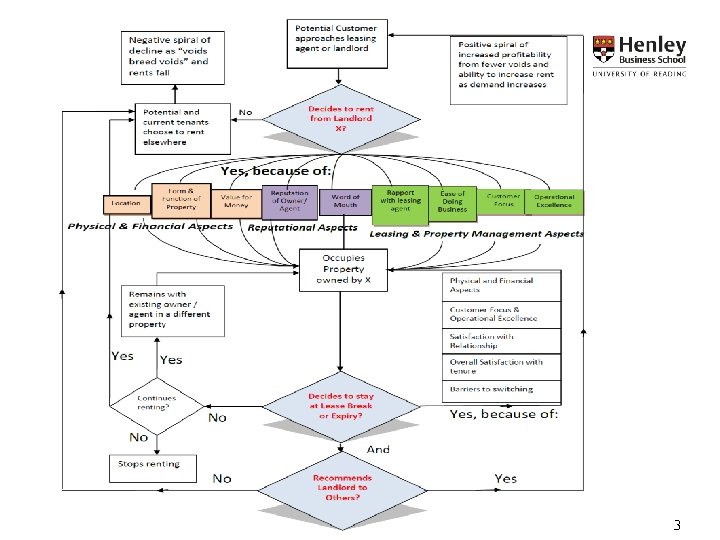
3
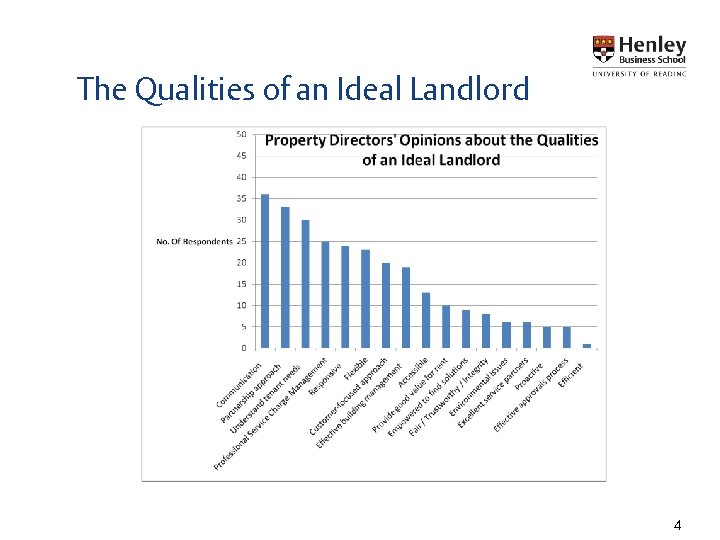
The Qualities of an Ideal Landlord 4
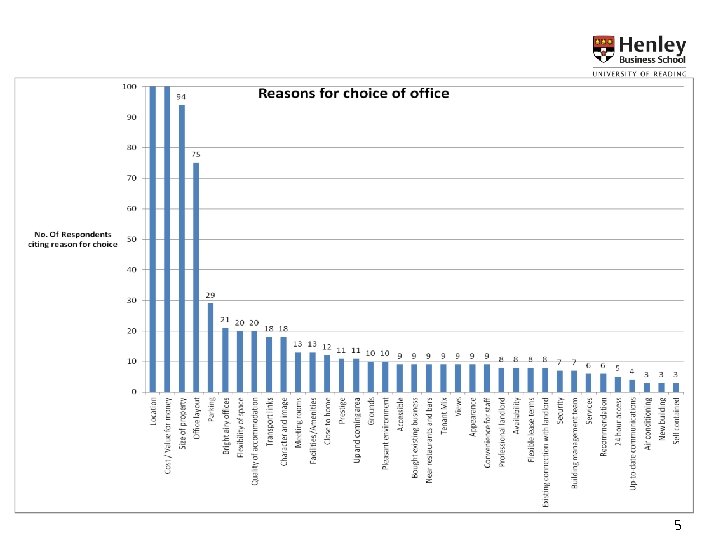
5
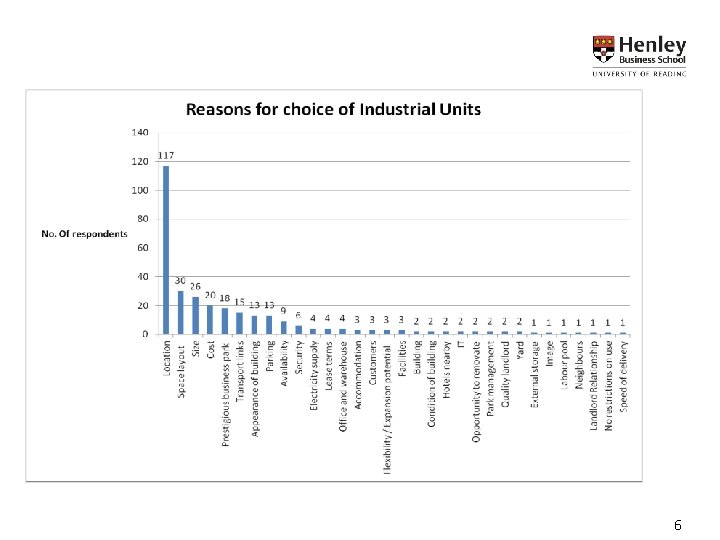
6
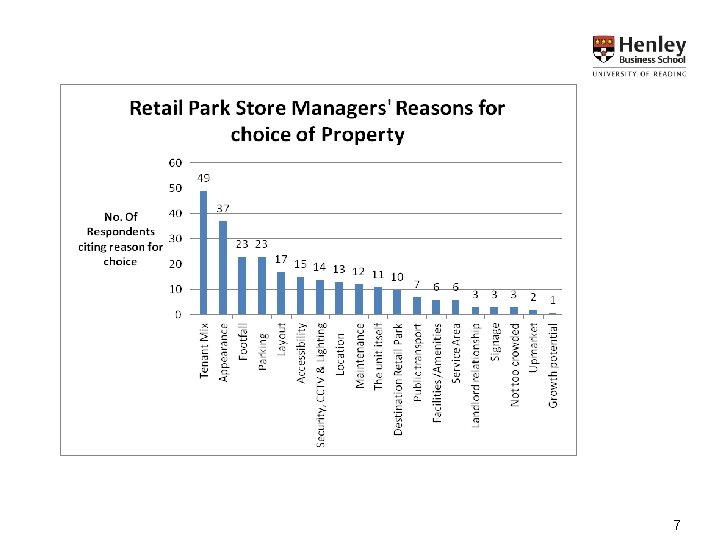
7
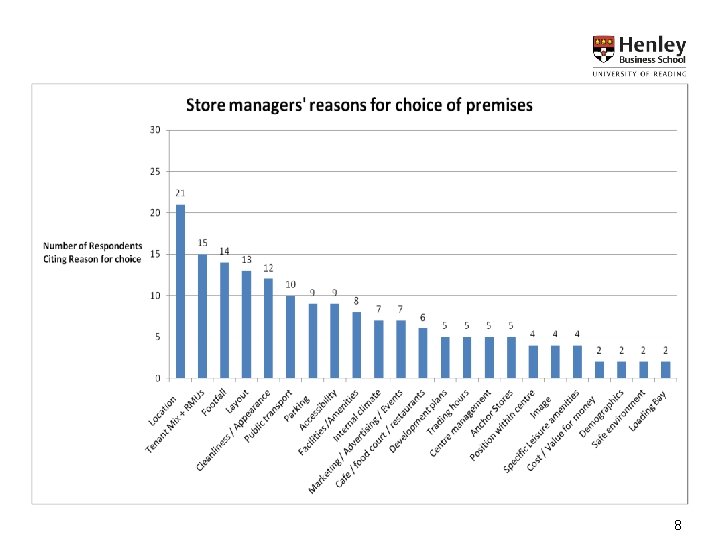
8
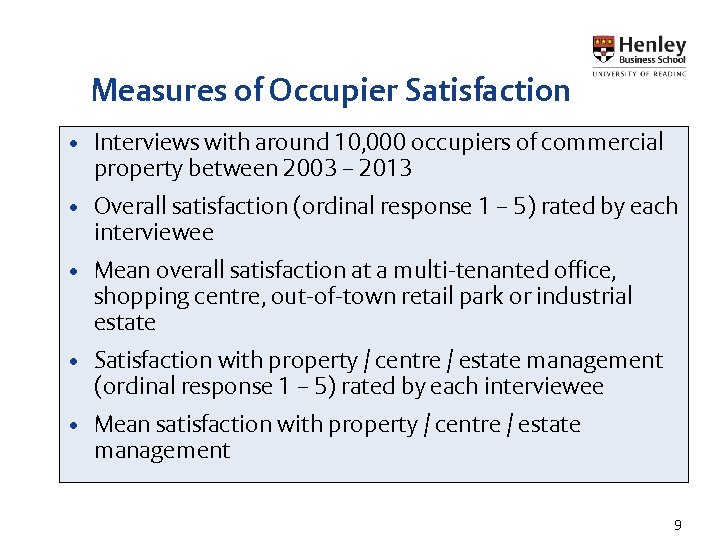
Measures of Occupier Satisfaction • Interviews with around 10, 000 occupiers of commercial property between 2003 – 2013 • Overall satisfaction (ordinal response 1 – 5) rated by each interviewee • Mean overall satisfaction at a multi-tenanted office, shopping centre, out-of-town retail park or industrial estate • Satisfaction with property / centre / estate management (ordinal response 1 – 5) rated by each interviewee • Mean satisfaction with property / centre / estate management 9
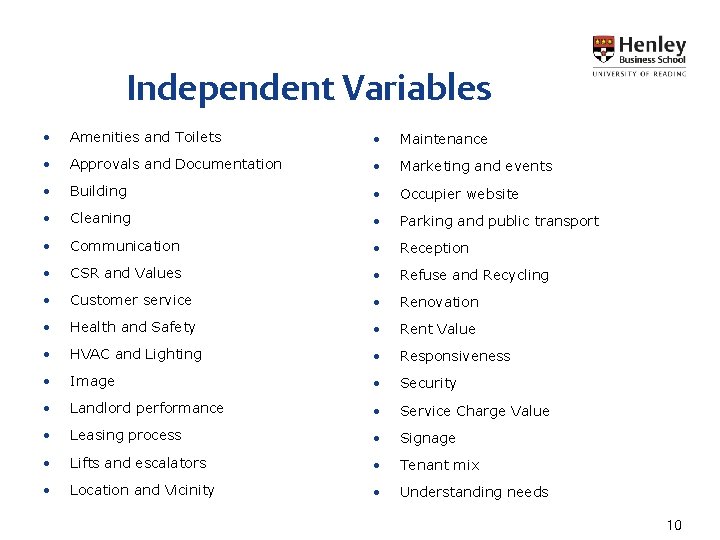
Independent Variables • Amenities and Toilets • Maintenance • Approvals and Documentation • Marketing and events • Building • Occupier website • Cleaning • Parking and public transport • Communication • Reception • CSR and Values • Refuse and Recycling • Customer service • Renovation • Health and Safety • Rent Value • HVAC and Lighting • Responsiveness • Image • Security • Landlord performance • Service Charge Value • Leasing process • Signage • Lifts and escalators • Tenant mix • Location and Vicinity • Understanding needs 10
11
12
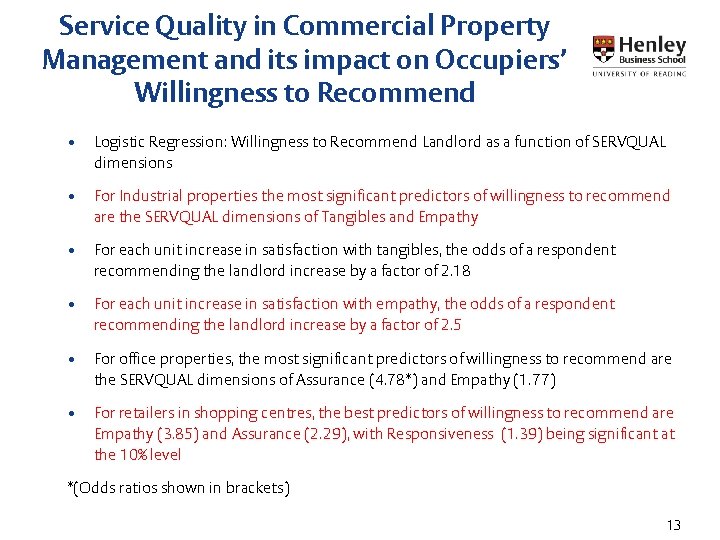
Service Quality in Commercial Property Management and its impact on Occupiers’ Willingness to Recommend • Logistic Regression: Willingness to Recommend Landlord as a function of SERVQUAL dimensions • For Industrial properties the most significant predictors of willingness to recommend are the SERVQUAL dimensions of Tangibles and Empathy • For each unit increase in satisfaction with tangibles, the odds of a respondent recommending the landlord increase by a factor of 2. 18 • For each unit increase in satisfaction with empathy, the odds of a respondent recommending the landlord increase by a factor of 2. 5 • For office properties, the most significant predictors of willingness to recommend are the SERVQUAL dimensions of Assurance (4. 78*) and Empathy (1. 77) • For retailers in shopping centres, the best predictors of willingness to recommend are Empathy (3. 85) and Assurance (2. 29), with Responsiveness (1. 39) being significant at the 10% level *(Odds ratios shown in brackets) 13
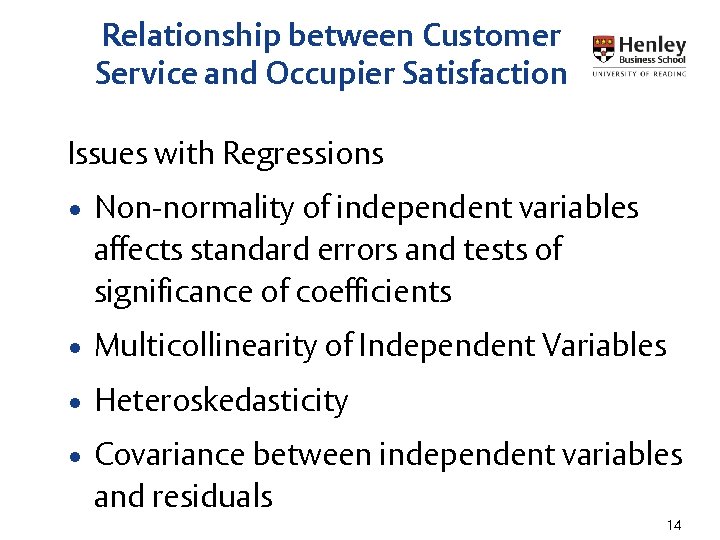
Relationship between Customer Service and Occupier Satisfaction Issues with Regressions • Non-normality of independent variables affects standard errors and tests of significance of coefficients • Multicollinearity of Independent Variables • Heteroskedasticity • Covariance between independent variables and residuals 14
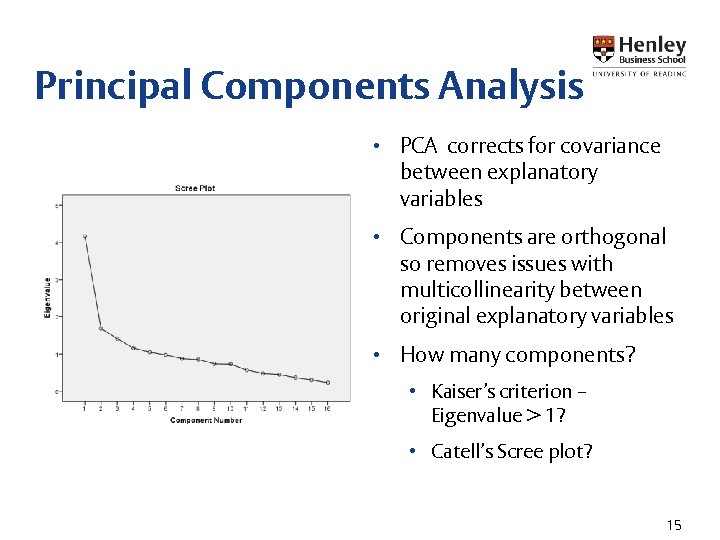
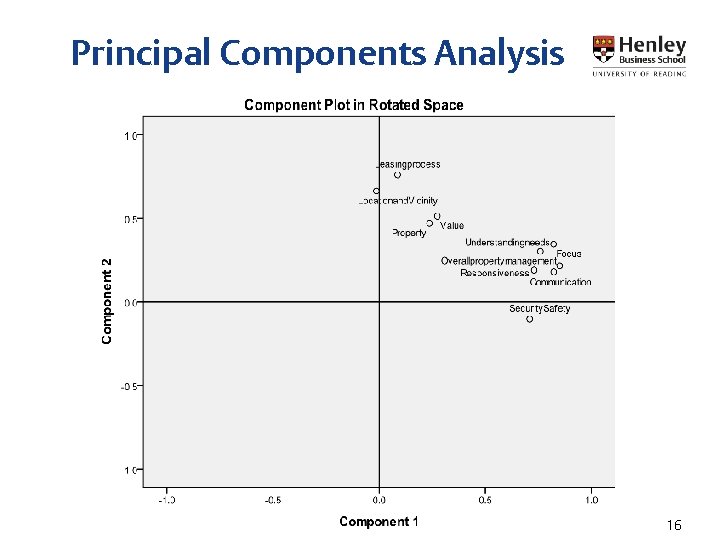
Principal Components Analysis • PCA corrects for covariance between explanatory variables • Components are orthogonal so removes issues with multicollinearity between original explanatory variables • How many components? • Kaiser’s criterion – Eigenvalue > 1? • Catell’s Scree plot? 15
Principal Components Analysis 16
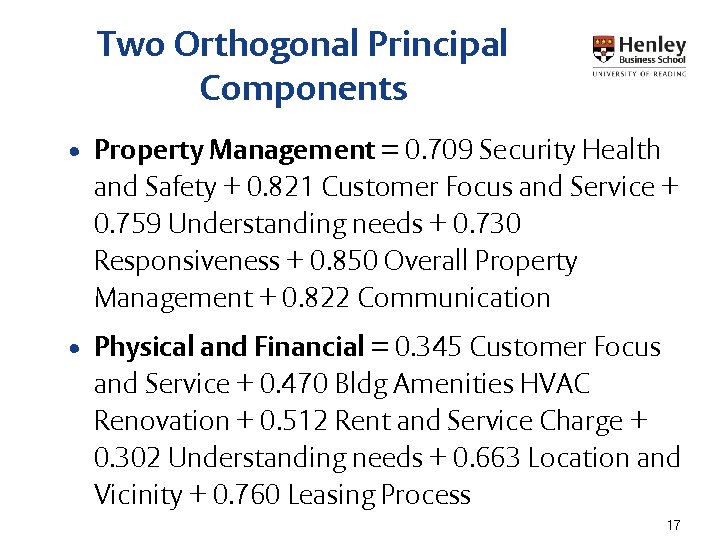
Two Orthogonal Principal Components • Property Management = 0. 709 Security Health and Safety + 0. 821 Customer Focus and Service + 0. 759 Understanding needs + 0. 730 Responsiveness + 0. 850 Overall Property Management + 0. 822 Communication • Physical and Financial = 0. 345 Customer Focus and Service + 0. 470 Bldg Amenities HVAC Renovation + 0. 512 Rent and Service Charge + 0. 302 Understanding needs + 0. 663 Location and Vicinity + 0. 760 Leasing Process 17
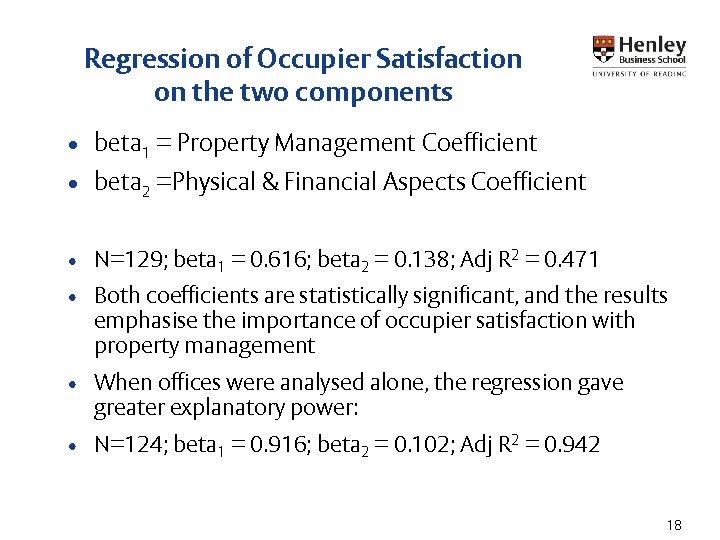
Regression of Occupier Satisfaction on the two components • beta 1 = Property Management Coefficient • beta 2 =Physical & Financial Aspects Coefficient • N=129; beta 1 = 0. 616; beta 2 = 0. 138; Adj R 2 = 0. 471 • Both coefficients are statistically significant, and the results emphasise the importance of occupier satisfaction with property management • When offices were analysed alone, the regression gave greater explanatory power: • N=124; beta 1 = 0. 916; beta 2 = 0. 102; Adj R 2 = 0. 942 18
Danielle Sanderson: School of Real Estate and Planning What is the Relationship between Occupier Satisfaction and Property Performance? http: //www. henley. ac. uk/school/page/rep-working-papers-2014/ 19
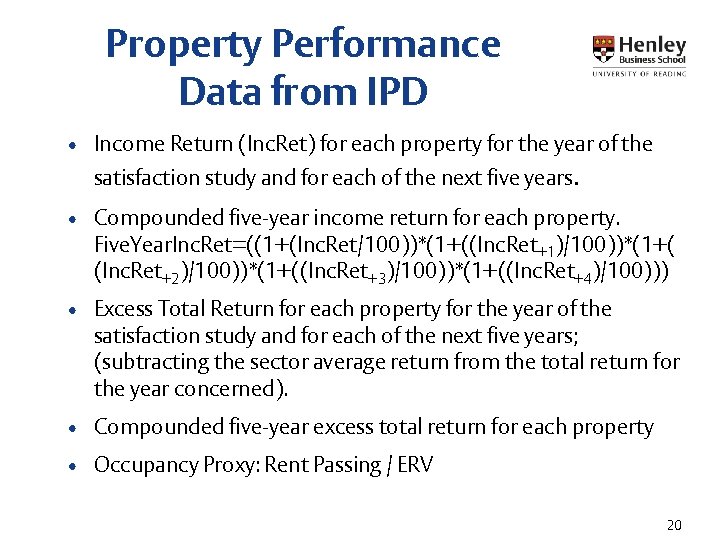
Property Performance Data from IPD • Income Return (Inc. Ret) for each property for the year of the satisfaction study and for each of the next five years. • Compounded five-year income return for each property. Five. Year. Inc. Ret=((1+(Inc. Ret/100))*(1+((Inc. Ret+1)/100))*(1+( (Inc. Ret+2)/100))*(1+((Inc. Ret+3)/100))*(1+((Inc. Ret+4)/100))) • Excess Total Return for each property for the year of the satisfaction study and for each of the next five years; (subtracting the sector average return from the total return for the year concerned). • Compounded five-year excess total return for each property • Occupancy Proxy: Rent Passing / ERV 20
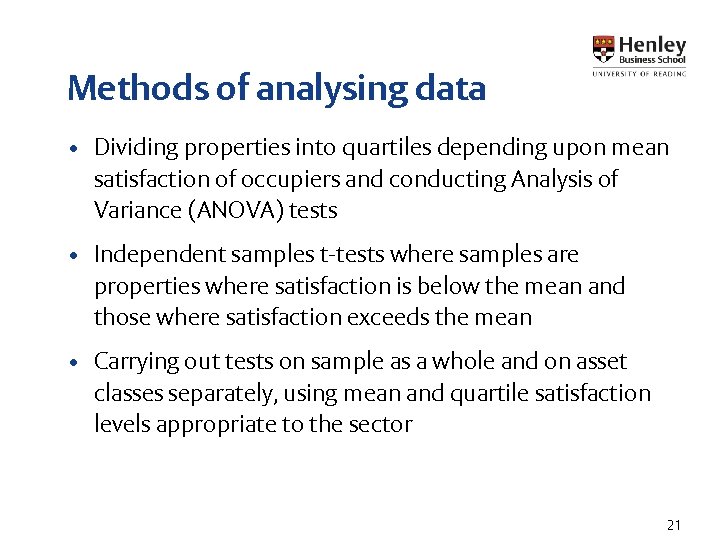
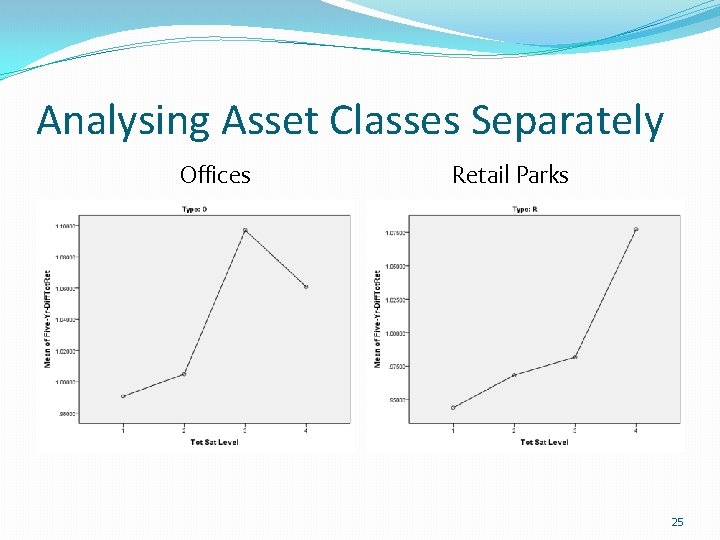
Methods of analysing data • Dividing properties into quartiles depending upon mean satisfaction of occupiers and conducting Analysis of Variance (ANOVA) tests • Independent samples t-tests where samples are properties where satisfaction is below the mean and those where satisfaction exceeds the mean • Carrying out tests on sample as a whole and on asset classes separately, using mean and quartile satisfaction levels appropriate to the sector 21
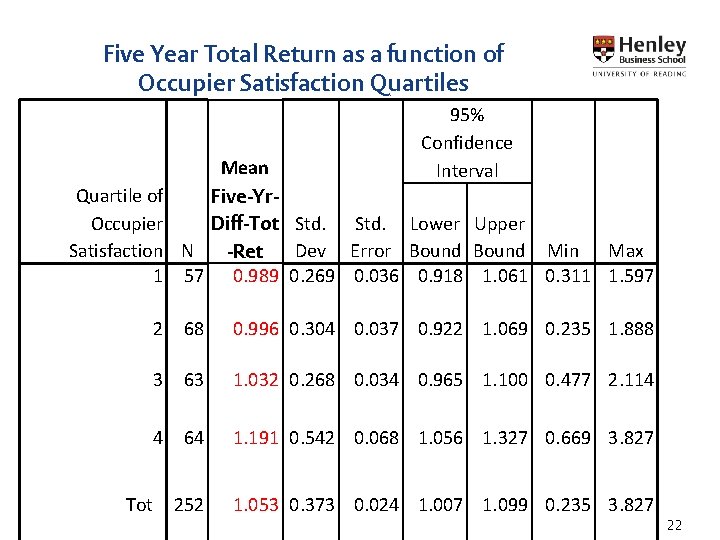
Five Year Total Return as a function of Occupier Satisfaction Quartiles 95% Confidence Interval Mean Quartile of Five-Yr. Occupier Diff-Tot Std. Lower Upper Satisfaction N Dev Error Bound Min Max -Ret 1 57 0. 989 0. 269 0. 036 0. 918 1. 061 0. 311 1. 597 Tot 2 68 0. 996 0. 304 0. 037 0. 922 1. 069 0. 235 1. 888 3 63 1. 032 0. 268 0. 034 0. 965 1. 100 0. 477 2. 114 4 64 1. 191 0. 542 0. 068 1. 056 1. 327 0. 669 3. 827 252 1. 053 0. 373 0. 024 1. 007 1. 099 0. 235 3. 827 22
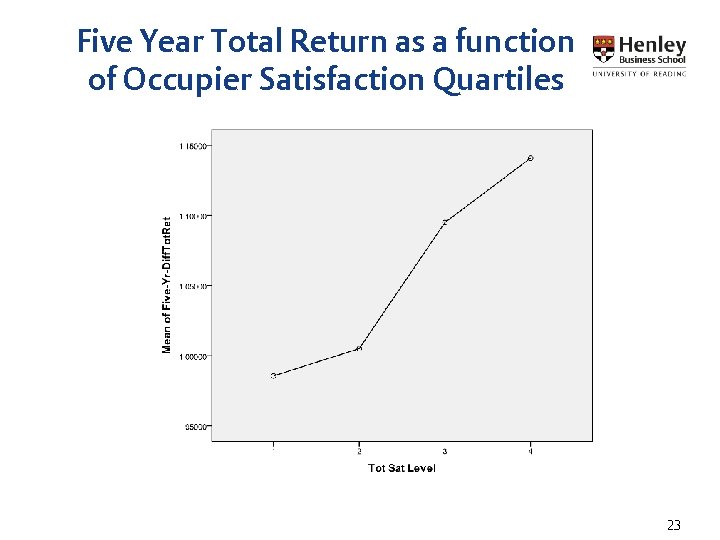
Five Year Total Return as a function of Occupier Satisfaction Quartiles 23
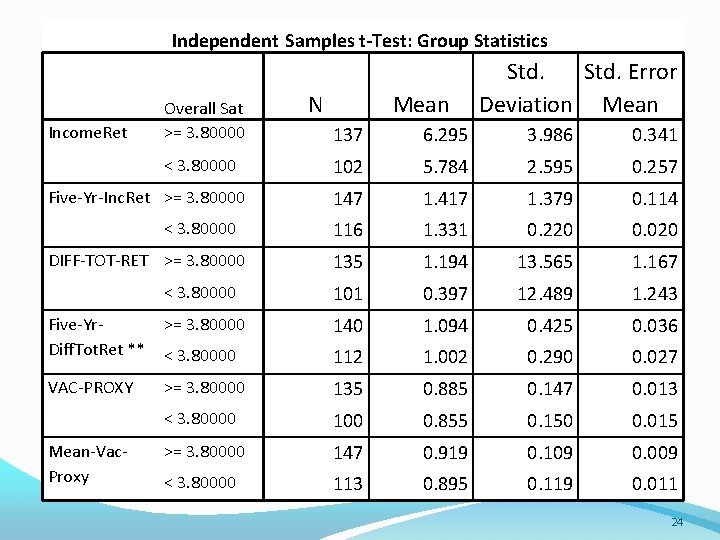
Independent Samples t-Test: Group Statistics Income. Ret Overall Sat >= 3. 80000 N Mean Std. Error Deviation Mean 137 6. 295 3. 986 0. 341 102 5. 784 2. 595 0. 257 147 1. 417 1. 379 0. 114 116 1. 331 0. 220 0. 020 135 1. 194 13. 565 1. 167 < 3. 80000 101 0. 397 12. 489 1. 243 Five-Yr. Diff. Tot. Ret ** >= 3. 80000 140 1. 094 0. 425 0. 036 < 3. 80000 112 1. 002 0. 290 0. 027 VAC-PROXY >= 3. 80000 135 0. 885 0. 147 0. 013 < 3. 80000 100 0. 855 0. 150 0. 015 >= 3. 80000 147 0. 919 0. 109 0. 009 < 3. 80000 113 0. 895 0. 119 0. 011 < 3. 80000 Five-Yr-Inc. Ret >= 3. 80000 < 3. 80000 DIFF-TOT-RET >= 3. 80000 Mean-Vac. Proxy 24
Analysing Asset Classes Separately Offices Retail Parks 25
Shopping Centres 26
Key Findings and Conclusions • Adjusted five year total return does show correlation with occupier satisfaction for the sample as a whole, and for the individual asset classes. • Income return shows a variable relationship with occupier satisfaction, according to the sector • The fact that the total returns exceed the IPD sector averages for the sample as a whole indicates that a company that takes occupier satisfaction seriously does appear to benefit as a whole, perhaps from improved reputation or from occupiers who need to move premises choosing to rent with the same landlord or have the same property manager. Insert footer on Slide Master 27
Confounding Factors / Caveats • Returns show great volatility – expenditure may be spread across more than one year, or may take place one year to reap benefits the following year. For this reason, five year compounded returns were chosen as a more appropriate measure. • The data represents a fairly small sample from a single landlord. A much larger sample is needed from a variety of owners / investors to confirm or refute the findings of this pilot study. • Whilst returns from this sample exceed IPD sector averages, this could be the result of astute investment in properties / locations where there is high demand. 28