Crisis Wealth Inequalities Thomas Piketty Paris School of


 • Everybody")
- Slides: 46
Crisis, Wealth & Inequalities Thomas Piketty Paris School of Economics Banque de France, November 29 th 2010
Can we study macro issues without looking at distributions? • Distribution & balanced growth = key question asked by 19 C economists • Many came with apocalyptic answers • Ricardo-Marx: a small group in society (land owners or capitalists) will capture an ever growing share of income & wealth; no balanced growth path can occur • During 20 C, a more optimistic consensus emerged: “growth is a rising tide that lifts all boats” (Kuznets 1953; cold war context)
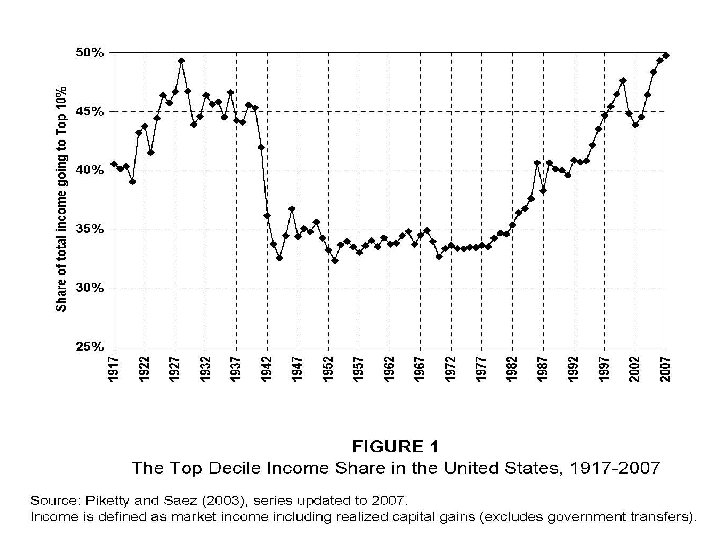
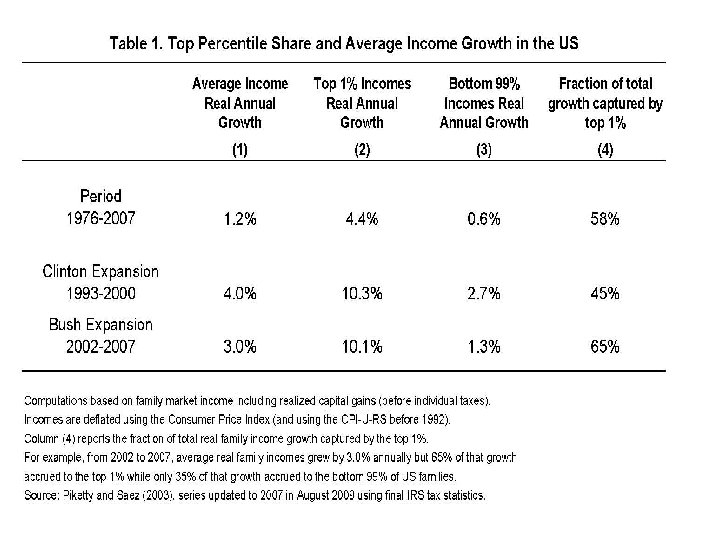
• But inequality ↑ since 1970 s destroyed this fragile consensus (US 1976 -2007: >50% of total growth was absorbed by top 1%) • 2007 -2010 crisis also raised doubts about balanced devt path… did rising inequality cause the crash? will stock options & bonuses, or oil-rich countries & China, or tax havens, absorb an ever growing share of world ressources in 21 C capitalism? → 19 C economists raised the right questions; we need to adress these questions again; we have no strong reason to believe in balanced growth path; it is high time to put distribution back into mainstream macroeconomics
This talk: two points • 1. The rise of inequality & the crisis (Atkinson-Piketty-Saez, « Top Incomes in the Long Run of History » JEL 2010) • 2. Wealth & inheritance in a low growth world: where is Europe heading? (Piketty, « On the Long Run Evolution of Inheritance – France 1820 -2050 » , PSE WP 2010, & on-going research on global trends in wealth distribution)
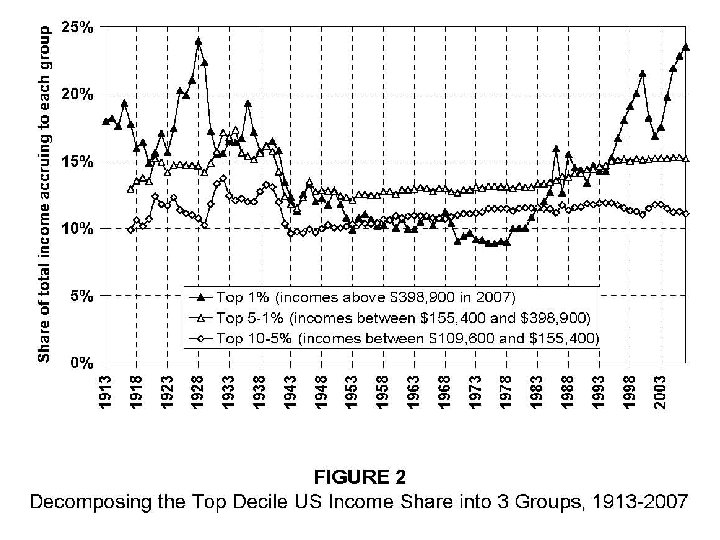
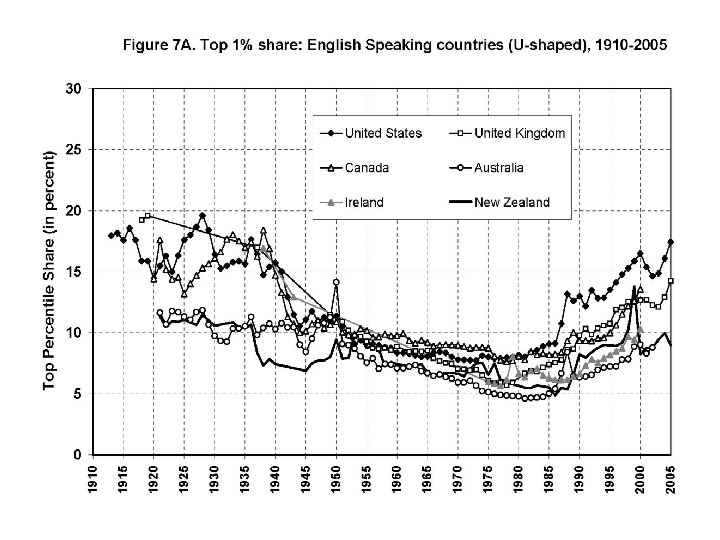
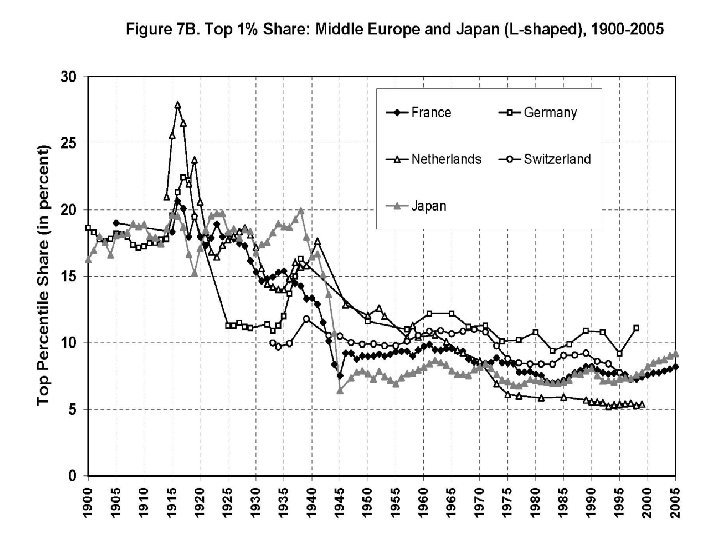
1. The Rise of inequality & the crisis • Top income project: 23 countries, annual series over most of 20 C. Two main findings: - The fall of rentiers: inequality ↓ during first half of 20 C = top capital incomes hit by 19141945 capital shocks; never fully recovered, possibly because of progressive taxation → no long run decline of earnings inequality; nothing to do with a Kuznets-type process - The rise of working rich: inequality ↑ since 1970 s; mostly due to top labor incomes → what happened? did it cause the crash?
Did inequality ↑ cause the crash? • Kumhof-Ranciere, « Inequality, Leverage & Crises » , IMF WP 2010: YES: US poor borrowed a lot because of inequality ↑ & stagnant incomes • My own view: - global financial systems are so fragile that they can crash without inequality↑ - but inequality ↑ does put extra stress on the financial system; large financial transactions between income gainers & loosers; domestic imbalances are even bigger than global imbalances - Europe: this effect can get much bigger in the future
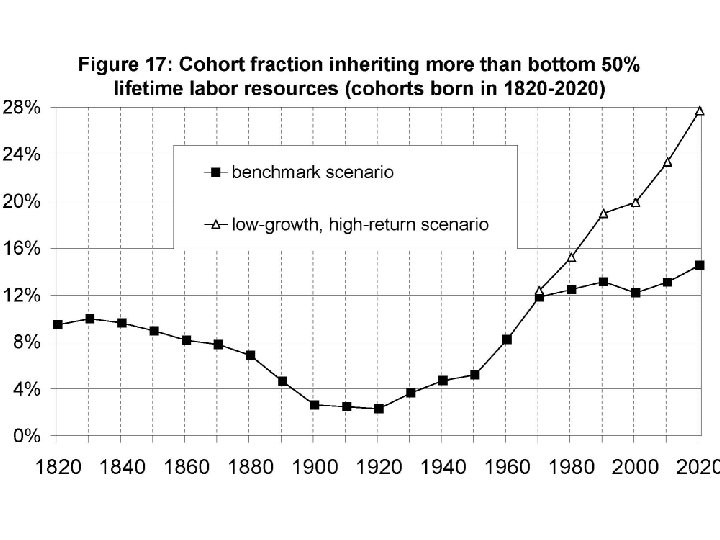
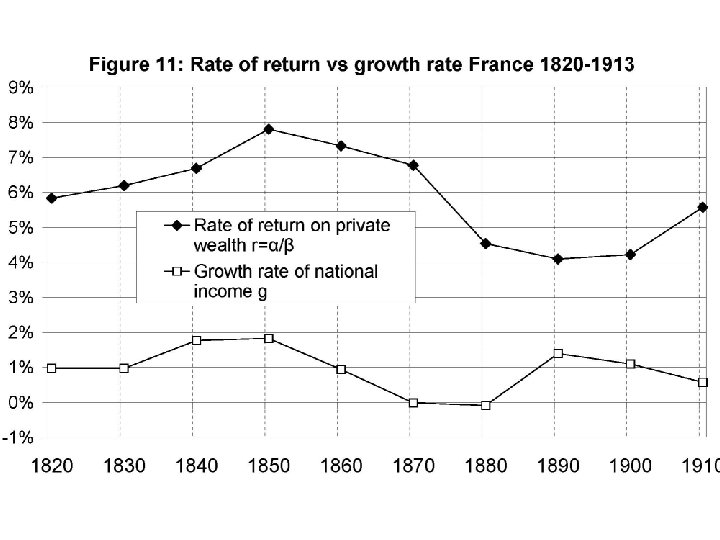
2. Wealth in a low growth world • Wealth inequality did not decline very much in the long run • What made 20 c societies less unequal & more meritocratic than 19 c societies is the decline in the share of inherited wealth • But this was purely temporary: with g small & r>g, inherited wealth is bound to dominate again self-made wealth in the future • Europe: with negative population growth, this r>g effect is likely to become very large
Policy implications • A world with g low & r>g is gloomy for workers with zero inherited wealth … especially if global tax competition drives capital taxes to 0% and the tax system relies entirely on labor income … especially if top labor incomes take a rising share of aggregate labor income → let’s unite to tax capital & top labor at the EU level; otherwise the future looks gloom
Why are US working rich so rich? • Hard to account for obs. variations with a pure technological, marginal-product story • One popular view: US today = working rich get their marginal product (globalization, superstars); Europe today (& US 1970 s) = market prices for high skills are distorted (social norms, etc. ) → very naïve view of the top labor market… & very ideological: we have zero evidence on the marginal product of top executives; social norms can also go the other way…
• Another view: grabbing hand model = marginal products are unobservable; top executives have an obvious incentive to convince shareholders & subordinates that they are worth a lot; no market convergence because constantly changing corporate & job structure (& costs of experimentation) → when pay setters set their own pay, there’s no limit to rent extraction. . . unless confiscatory tax rates at the very top (memo: US top rate (1 m$+) 1932 -1980 = 82%) (no more fringe benefits than today)
• A more consensual view: the truth must be somewhere in between these two views; we know very little; top labor market institutions & pay setting processes are important and ought to attract more research; be careful with low quality survey data (with bad coverage of the top)
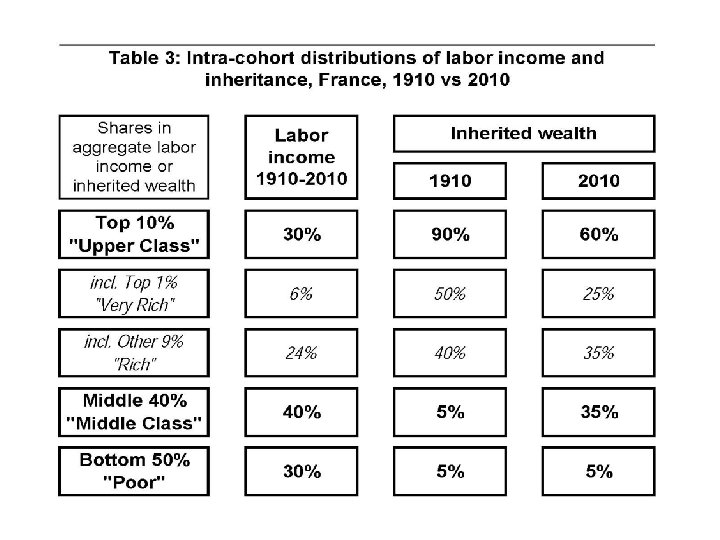
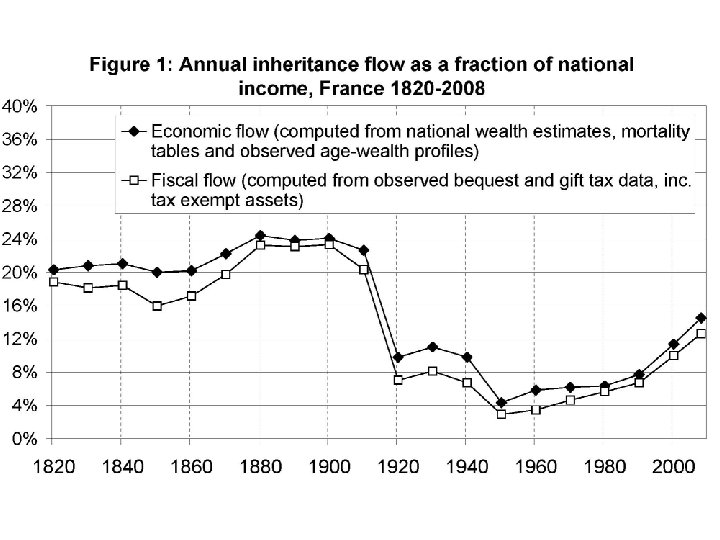
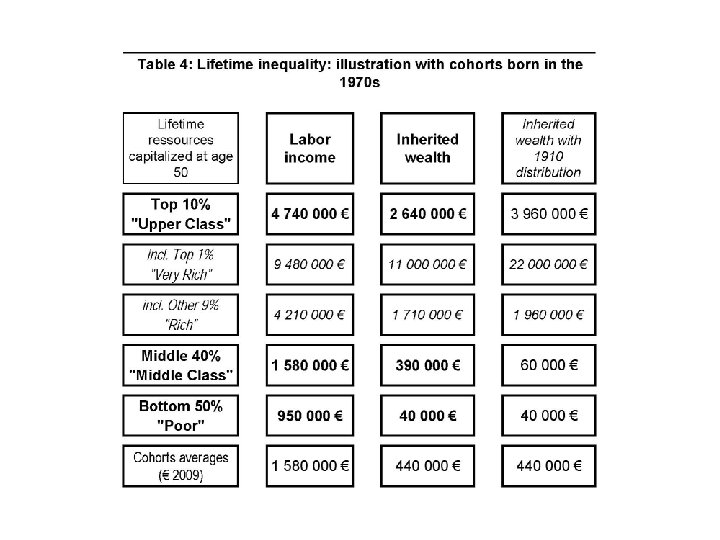
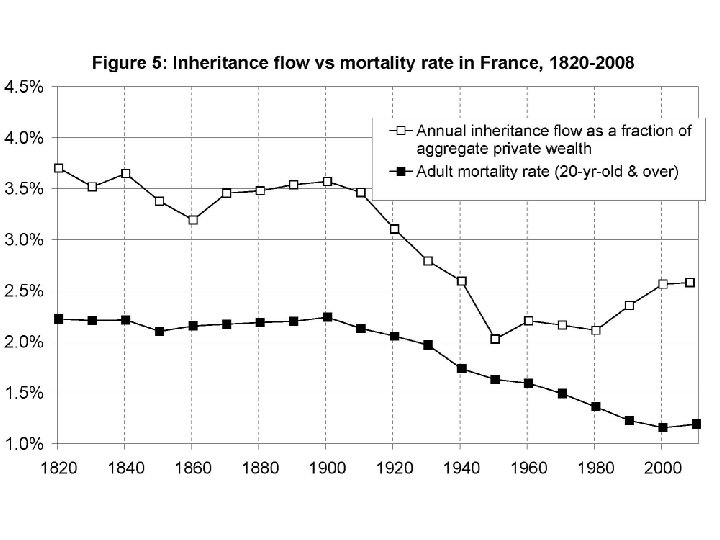
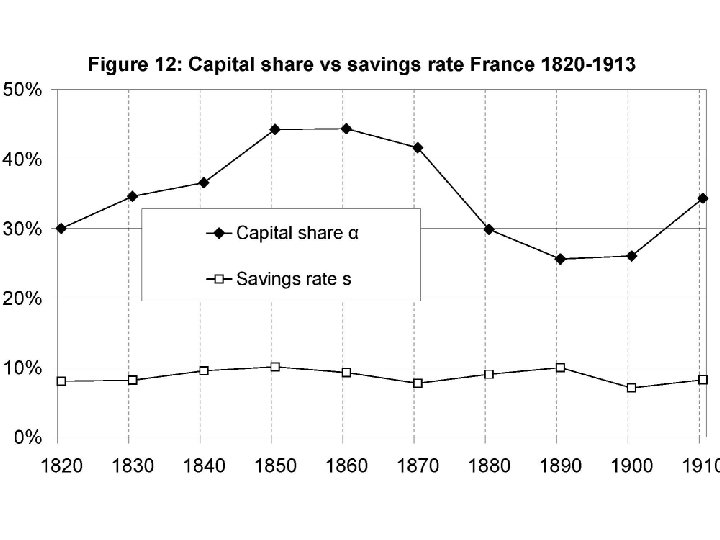
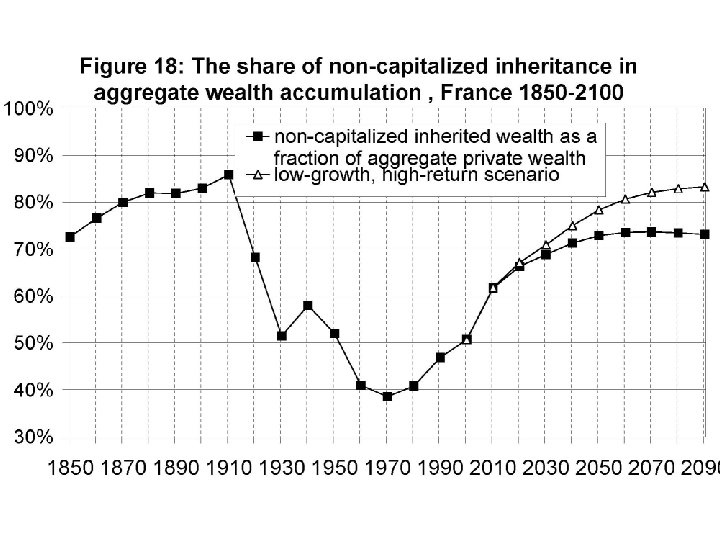
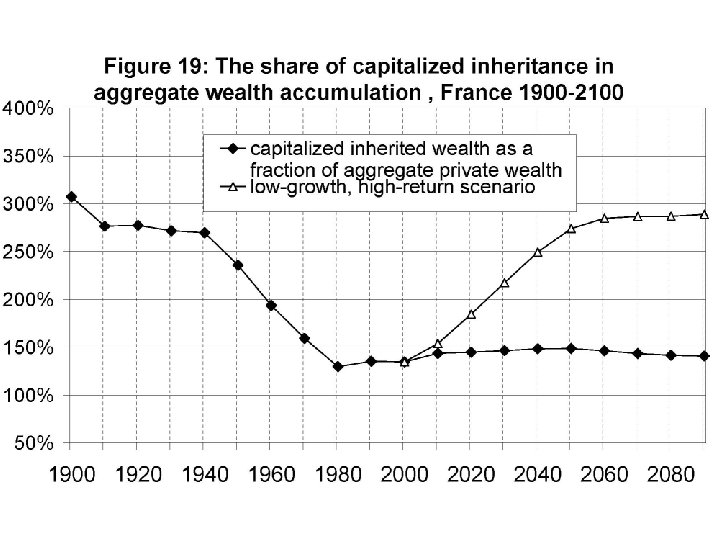
The return of inheritance • Distributional issue: wealth inequality ↓ during 20 C. . but not that much (see table) • Macro issue: aggregate inheritance flow vs aggregate labor income → this is the issue explored in « On the Long Run Evolution of Inheritance – France 18202050 »
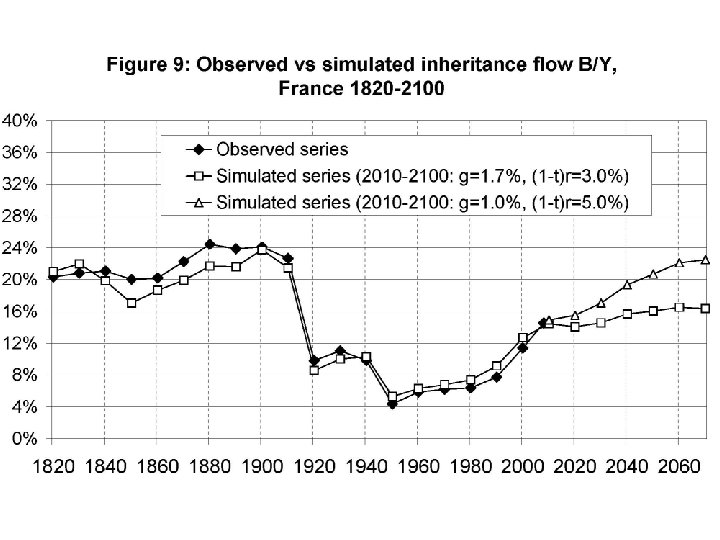
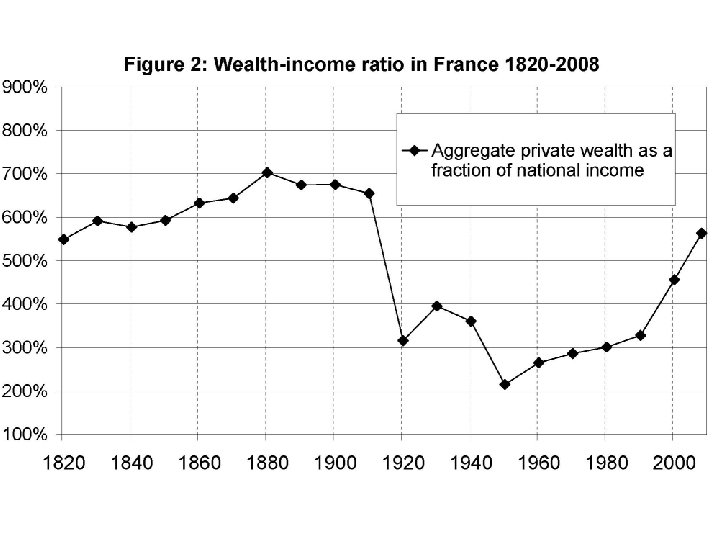
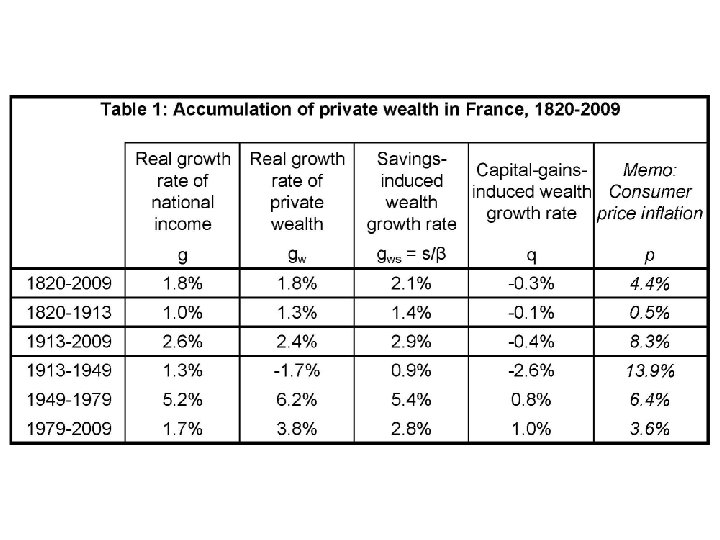
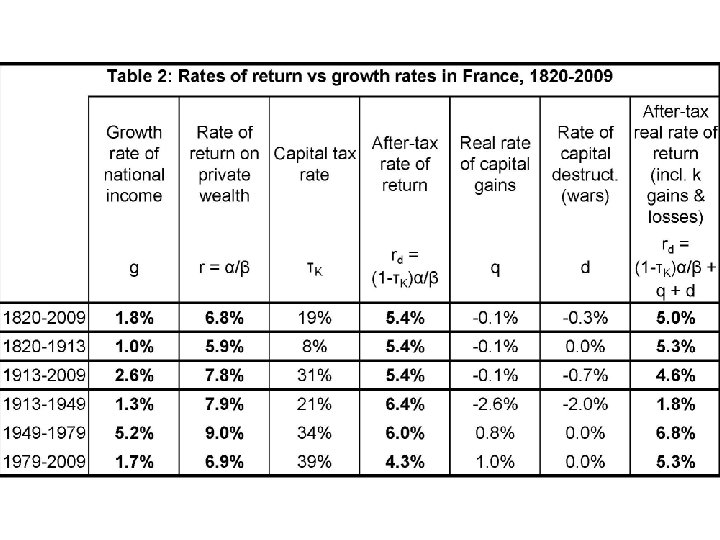
What this paper does • Documents this fact • Develops a simple theoretical model explaining & reproducing this fact • Main lesson: with r>g, inheritance is bound to play a key role & to dominate new wealth • Intuition: with r>g (& g low), wealth coming from the past is being capitalized faster than growth; heirs just need to save a fraction g/r of the return to inherited wealth → by=β/H → with β=600% & H=30, then by=20% • It is only in countries & time periods with g exceptionally high that self-made wealth dominates inherited wealth
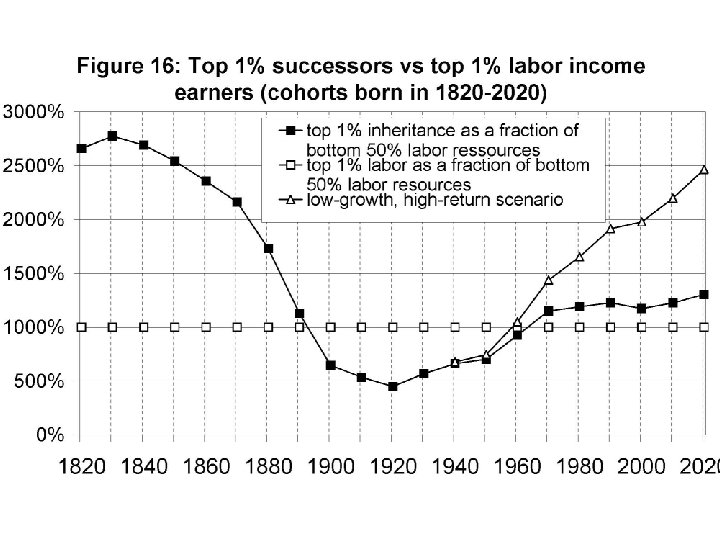
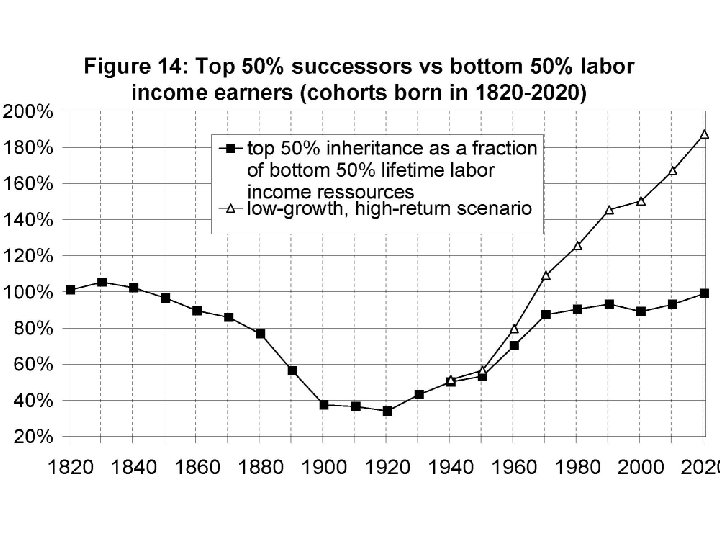
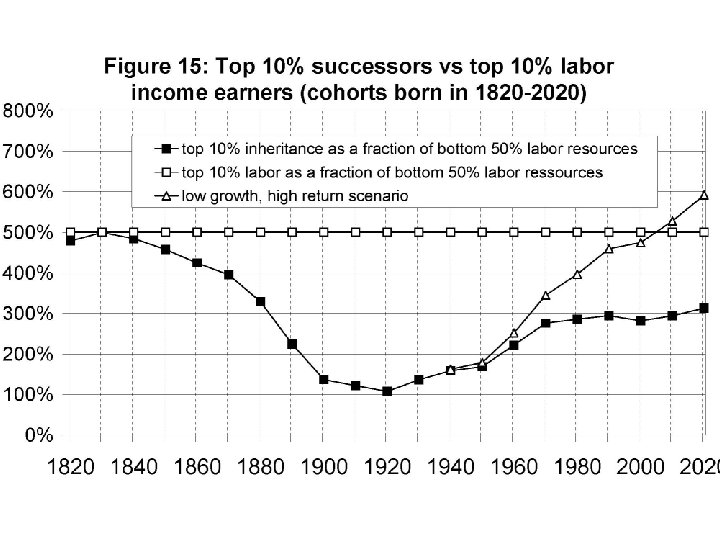
Back to distributional analysis • For cohorts born in the 1910 s-1950 s, inheritance did not matter too much → labor-based, meritocratic society • But for cohorts born in the 1970 s & after, inheritance matters a lot → 21 c closer to 19 c rentier society than to 20 c merit society • The rise of human capital was an illusion. . especially with a labor-based tax system
Supplementary slides
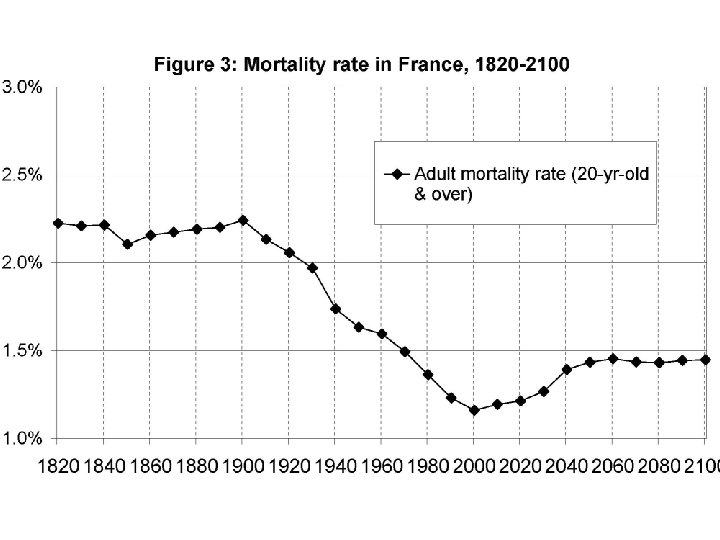
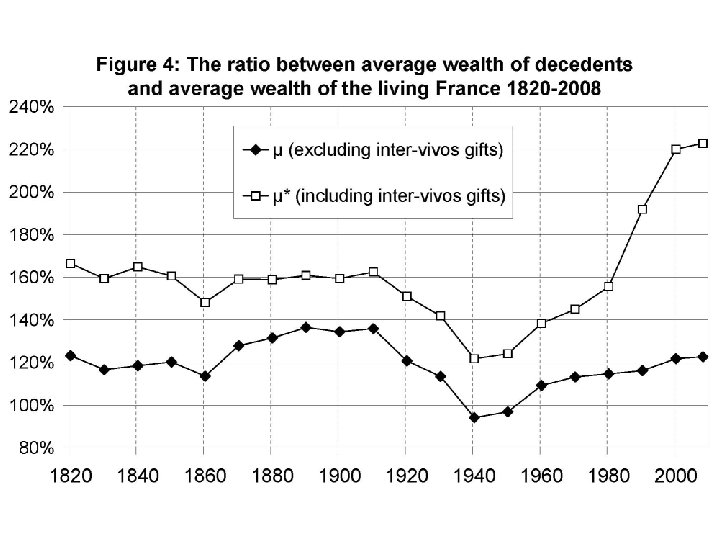
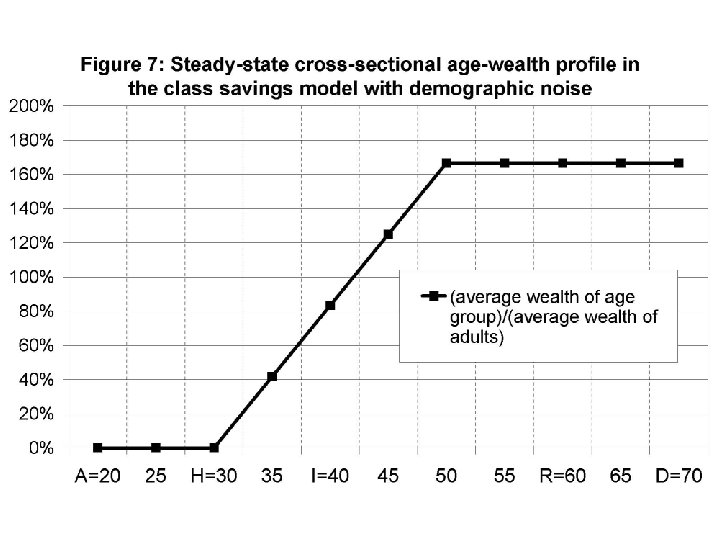
Computing inheritance flows: simple macro arithmetic Bt/Yt = µt mt Wt/Yt ▪ Wt/Yt = aggregate wealth/income ratio ▪ mt = aggregate mortality rate ▪ µt = ratio between average wealth of decedents and average wealth of the living (= age-wealth profile) → The U-shaped pattern of inheritance is the product of three U-shaped effects
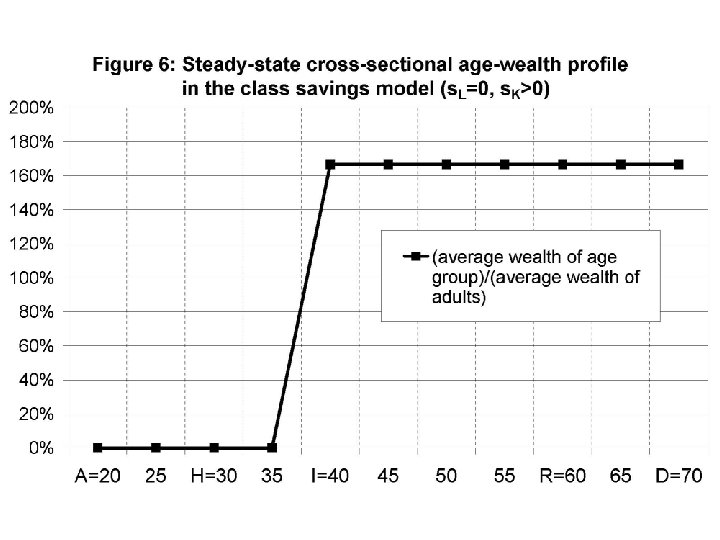
Steady-state inheritance flows • Standard models: r = θ+σg = αg/s (>g) • Everybody becomes adult at age A, has one kid at age H, inherits at age I, and dies at age D → I = D-H, m = 1/(D-A) • Dynastic or class saving: µ = (D-A)/H → by = µ m β = β/H • Proposition: As g→ 0, by→β/H