Context Diagrams and DFDs Strathmore Secondary College 2015


 Level 1 diagram Level 2")


- Slides: 27
Context Diagrams and DFDs Strathmore Secondary College 2015
Data and Data Flow Analysis • Context and Data Flow Diagrams: – Main tools used to pictorially represent how application data and information flow through the system – Four symbols used: • • Process Interface Data Store Data Flow
Context Diagram Symbols
Context Diagram • Generally, does not show much detail – Very similar to a Use Case Diagram, but focuses on the input of data • Overview of the input from the outside world • Doesn’t show processing steps or storage procedures, just show processing within the system and the output from the system • Only data and information is supplied
DFDs • Data Flow Diagrams are a graphical way to represent the flow of data • They’re a more structured and scientific way of showing how a system works – it’s a visualisation of data processing within a system • This is different from a Flow Chart, which you should be familiar with from Year 11 – Flow charts are a graphical way to represent decisions and “control”. – DFDs represent “processes” and “transformations”
DFDs • Data flow diagrams are used to describe how the system transforms information. They define how information is processed and stored and identify how the information flows through the processes. • Use a Data Flow Diagram (DFD) to show the relationships among the business processes within an organization to: – external systems, – external organizations, – customers, – other business processes.
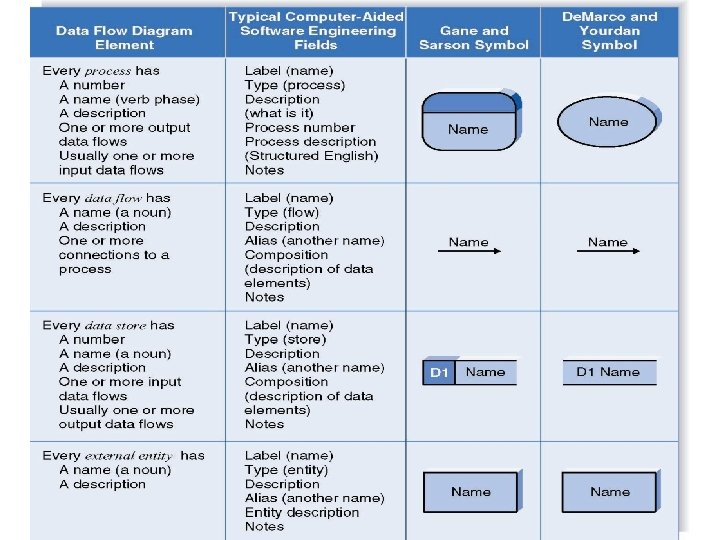
DFDs - Definitions • Process – An activity or function performed for a specific business reason – Manual or computerized • Data flow – A SINGLE PIECE of data or a logical collection of data – Always starts or ends at a process
DFDs - Definitions • Data Store – A collection of data that is stored in some way – Data flowing out is retrieved from the data store – Data flowing in updates or is added to the data store • External entity/interface – A person, organization, or system that is external to the system but interacts with it.
Using DFDs • Business processes are too complex to be shown on a single DFD • Decomposition is the process of representing the system in a hierarchy of DFD diagrams – Child diagrams show a portion of the parent diagram in greater detail • So, DFDs are created in layers – called LEVELS – Each level must be BALANCED – Balancing involves insuring that information presented at one level of a DFD is accurately represented in the next level DFD.
Sample DFD Level 0 – Context Diagram
Sample DFD
Relationship among Levels of DFDs Context diagram (Level 0) Level 1 diagram Level 2 diagram Level 3 diagram
DFDs • When building a data flow diagram, the following items should be considered: – where does the data that passes through the system come from and where does it go? – what happens to the data once it enters the system (i. e. , the inputs) and before it leaves the system (i. e. , the outputs)? – what delays occur between the inputs and outputs (i. e. , identifying the need for data stores)?
Drawing a DFD • Identify the BUSINESS PROCESSES to perform the work needed to generate the input and output data flows • Connect the data flows from the external entities to the processes. • Identify any data stores and draw them
Drawing a DFD • Connect the processes and data stores with data flows. • Check to make sure you’ve got all of the correct information showing • Continue to decompose to the nth level required DFD • Draw all DFDs at one level before moving to the next level.
Level 1 DFDs • Generally, one level 1 diagram is created for every major process on the level 0 diagram • Shows all the internal processes that comprise a single process on the level 0 diagram • Shows how information moves from and to each of these processes • If a parent process is decomposed into, for example, three child processes, these three child processes wholly and completely make up the parent process
Level 2 DFDs • Shows all processes that comprise a single process on the level 1 diagram • Shows how information moves from and to each of these processes • Level 2 diagrams may not be needed for all level 1 processes • Correctly numbering each process helps the user understand where the process fits into the overall system
Alternative Data Flows • Where a process can produce different data flows given different conditions • We show both data flows and use the process description to explain why they are alternatives • Tip -- alternative data flows often accompany processes with IF statements
Class Task • At this point in the process it is easy to lose track of the “big picture”. • Describe the difference between data flows, data stores, and processes. • Describe in your own words the relationship between the DFD and the ultimate new application being developed.
Process Descriptions • Text-based process descriptions provide more information about the process than the DFD alone • If the logic underlying the process is quite complex, more detail may be needed in the form of – Structured English – Decision trees – Decision tables
Layout Suggestions • Layouts typically place – processes in the center – inputs from the left – outputs to the right – stores beneath the processes
Sample DFD
At what level do you stop? • When to stop decomposing DFDs? – Ideally, a DFD has at least three processes and no more than seven to nine.
Validating a DFD • For each DFD: • Check each process for: – A unique name: action verb phrase; number; description – At least one input data flow – At least one output data flow – Output data flow names usually different than input data flow names – Between 3 and 7 processes per DFD
Validating a DFD • For each DFD: – Check each data flow for: • A unique name: noun; description • Connects to at least one process • Shown in only one direction (no two-headed arrows) • A minimum number of crossed lines – Check each data store for: • A unique name: noun; description • At least one input data flow • At least one output data flow – Check each external entity for: • A unique name: noun; description • At least one input or output data flow
Class Task • Draw a Context Diagram for a bank ATM – Ensure you consider all of the data required to: • Initiate Banking Processes • Check balances • Withdraw cash